. 2019 Jul 25;10(1):3310.
doi: 10.1038/s41467-019-10945-z.

Non-coding variability at the APOE locus contributes to the Alzheimer's risk

Collaborators, Affiliations

Non-coding variability at the APOE locus contributes to the Alzheimer's risk

Xiaopu Zhou et al. Nat Commun. .

Abstract

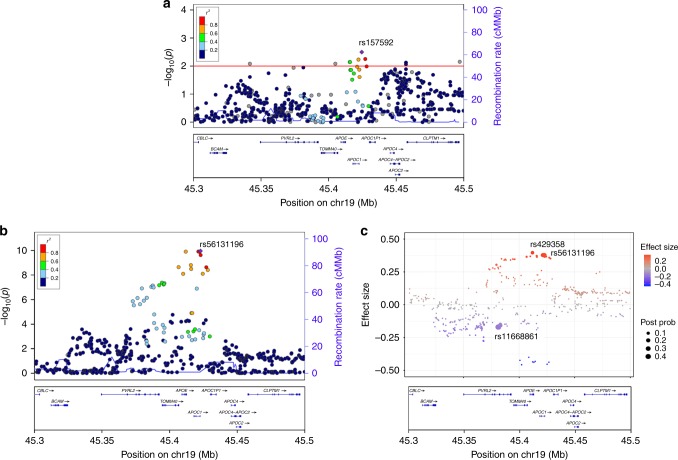
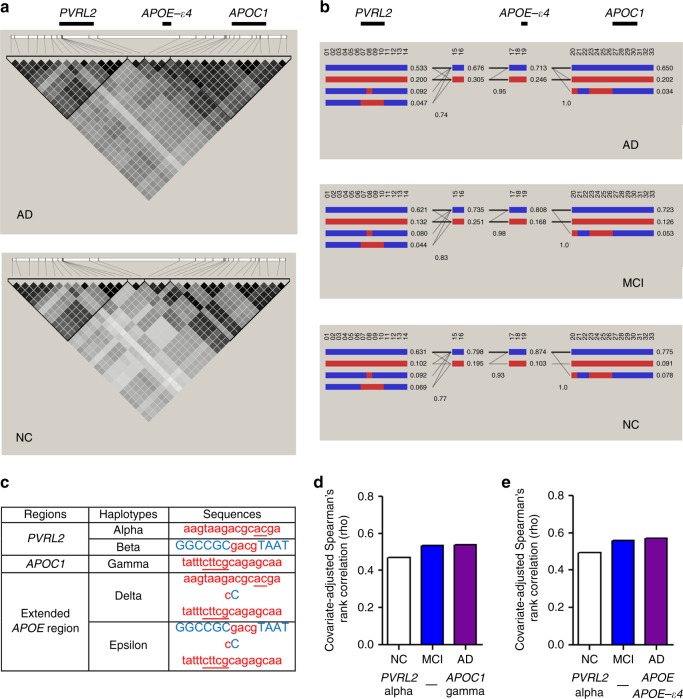
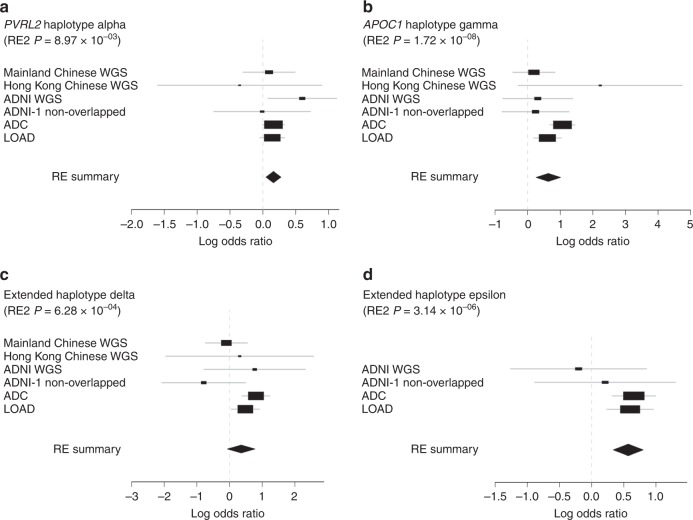
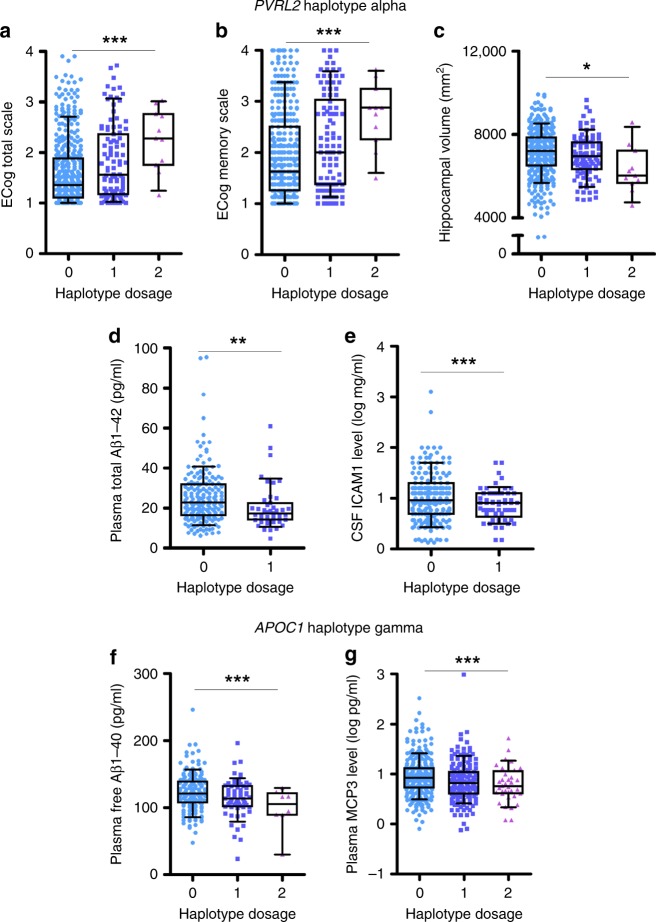
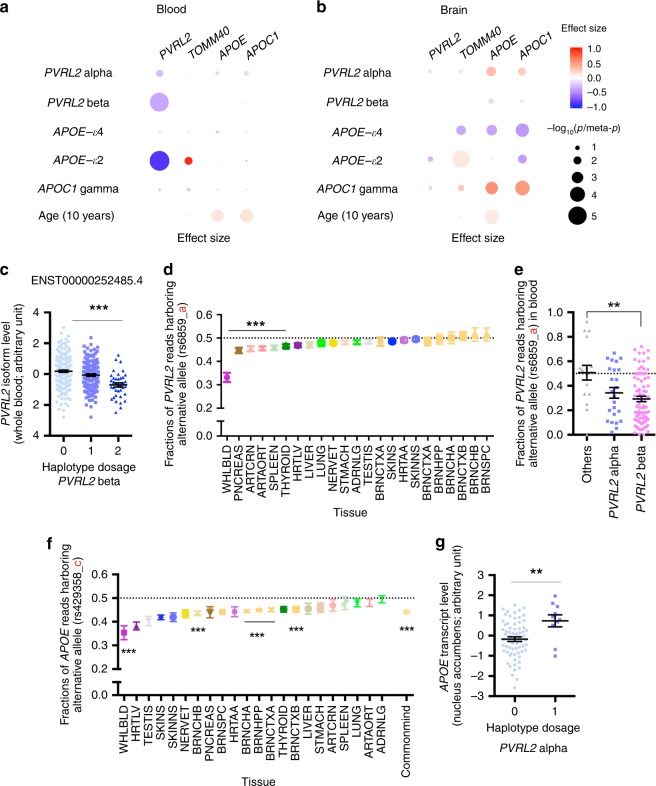
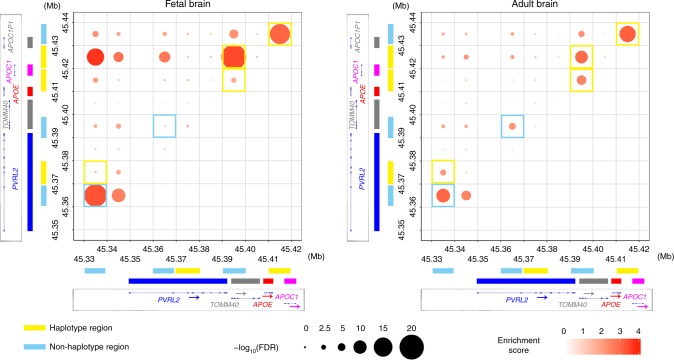
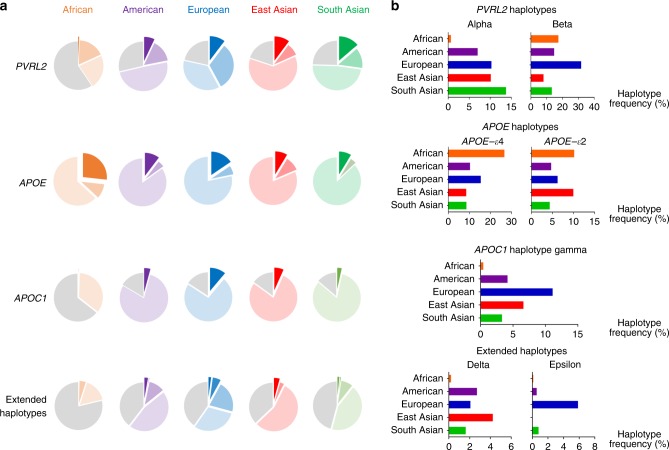
Alzheimer's disease (AD) is a leading cause of mortality in the elderly. While the coding change of APOE-ε4 is a key risk factor for late-onset AD and has been believed to be the only risk factor in the APOE locus, it does not fully explain the risk effect conferred by the locus. Here, we report the identification of AD causal variants in PVRL2 and APOC1 regions in proximity to APOE and define common risk haplotypes independent of APOE-ε4 coding change. These risk haplotypes are associated with changes of AD-related endophenotypes including cognitive performance, and altered expression of APOE and its nearby genes in the human brain and blood. High-throughput genome-wide chromosome conformation capture analysis further supports the roles of these risk haplotypes in modulating chromatin states and gene expression in the brain. Our findings provide compelling evidence for additional risk factors in the APOE locus that contribute to AD pathogenesis.


Conflict of interest statement

The authors declare no competing interests.

Figures

Fig. 1
Fig. 1
Multivariant effects of the APOE locus in the Chinese AD cohort. a Regional association plot of the AD risk variants in APOE-ε3 homozygous subjects. The horizontal red line denotes the p-value threshold of 0.01. b Regional association plot of the AD risk variants (SNPs and INDELs with frequency ≥ 5%) located in the APOE locus. The purple diamond specifies the sentinel variant (with the SNP ID marked in the plot). Dot colors illustrate the LD (measured as R2) between the sentinel variant and its neighboring variants. c CAVIAR analysis results for mapping of possible causal variants in the APOE locus. Dots represent the variants tested in the APOE locus; the y-axis and dot color denote the effect size. Dot size corresponds to the posterior probabilities of the variants being the causal variants obtained from CAVIAR analysis, with the sentinel variants located in three loci marked with SNP IDs. AD Alzheimer’s disease, CAVIAR causal variants identification in associated regions, cM/Mb centimorgans per megabase, INDELs insertions and deletions, LD linkage disequilibrium, SNP single nucleotide polymorphism, Post Prob posterior probabilities of being the causal variants
Fig. 2
Fig. 2
Haplotype structure of AD-associated risk variants in the Chinese AD cohort. a Pairwise LD plot of the 33 selected variants in LD with the potential risk variants in different phenotypic groups. The color map corresponds to the pairwise r2 values between variants, with nine potential risk variants located in the PVRL2, APOE, and APOC1 loci marked at the top panel, respectively. b Haplotype analysis of the 33 selected variants among different phenotypic groups. Each column (marked with numbers) represents one of the 33 variants, with red and blue indicating the minor (i.e., AD risk) and major alleles, respectively. Each row represents a particular haplotype defined by a specific combination of major and minor alleles in the given haplotype blocks, with decimals on the right side specifying the frequencies of corresponding haplotypes in the given phenotypic groups. Intersecting lines represent the frequency of associations between two connected haplotypes (thin and thick lines denote associations with frequency > 1% and > 10% in the corresponding groups, respectively). c Table summarizing the identified minor haplotypes in PVRL2, APOC1, and extended APOE regions. Letters in uppercase blue or lowercase red denote the major and minor (risk) alleles, respectively; underlined letters highlight INDELs. d, e Pairwise correlations between the minor haplotypes of PVRL2 alpha and APOC1 gamma or APOE-ε4 measured by Spearman’s partial rank-order correlation, adjusted for age, gender, and principal components in corresponding phenotypic groups (presented as Spearman’s ρ in the y-axis). AD Alzheimer’s disease, INDELs insertions and deletions, LD linkage disequilibrium, MCI mild cognitive impairment, NC normal controls
Fig. 3
Fig. 3
Forest plot of haplotypes contributing to AD after controlling for APOE genotypes. Forest plot with values of effect size obtained from independent datasets or meta-results denoted by rectangles and diamonds, respectively. For each row representing the independent dataset, lines indicate 95% confidence intervals, and sizes of rectangles are proportional to the weights in the meta-analysis. a, b PVRL2 alpha and APOC1 gamma haplotypes were associated with AD in an APOE genotype-independent manner (p-values shown are for Han and Eskin’s random effects model). c, d Association results of extended minor haplotypes delta and epsilon after controlling for APOE-ε4 genotypes (p-values are for Han and Eskin’s random effects model). AD Alzheimer’s disease, RE random effects, RE2 Han and Eskin’s random effects model
Fig. 4
Fig. 4
Functional implications of PVRL2 and APOC1 haplotypes in an APOE-ε4–independent manner. ae. Associations between PVRL2 minor haplotype alpha, and cognitive performance and biomarker expression in an APOE-ε4-independent manner. a, b Associations between PVRL2 alpha haplotype dosage with (a) cognitive performance indicated by total ECog score (scored between 0−4; higher scores represent more severe disability in functioning) reported by study partners (n= 527, T = 3.71, ***p < 0.001, Beta = 0.25) and (b) memory performance indicated by ECog memory score reported by study partners (n= 527, T = 3.60, ***p < 0.001, Beta = 0.29). c Association between PVRL2 alpha haplotype with hippocampal volume (n= 1,121, T = −2.31, *p < 0.05, Beta = −165.60 [mm]). d, e Associations between PVRL2 alpha haplotype with (d) total Aβ1–42 in plasma (n = 226, T = −3.098, **p < 0.01, Beta = −4.113 [pg/mL]) and (e) ICAM-1 in cerebrospinal fluid; n = 298, T = −3.361, ***p < 0.001, Beta = −0.199 [log ng/mL]). Individuals harboring two copies of haplotypes were not included due to the small samples size. f, g Association between APOC1 gamma haplotype with levels of (f) plasma free Aβ1–40 (n= 226, T = −4.823, ***p < 0.001, Beta = −40.231 [pg/mL]) and (g) plasma MCP3 (CCL7) (n = 537, T = −3.665, ***p < 0.001, Beta = −0.229 [log ng/mL]). Aβ amyloid-beta, ECog everyday cognition. Data are presented in box plots, with boxes extending from the 25th to 75th percentiles and whiskers specifying the 10th and 90th percentiles; the line in the middle of the box denotes the median
Fig. 5
Fig. 5
Modulatory effects of AD-associated haplotypes in APOE and the surrounding region on the expression of nearby genes. a, b Dot plots showing the haplotype–expression association results of the AD-associated haplotypes in PVRL2, APOE, and APOC1 and their nearby genes in (a) blood and (b) the brain. Dot color and size represent effect size and significance level (p or meta-p values), respectively. c Association between PVRL2 beta haplotype with transcript level of blood PVRL2 isoform (ENST00000252485.4) (n = 365, T = −5.470, ***p < 0.001, Beta = −0.449). d Allelic imbalance of PVRL2 variant rs6859 across multiple tissues. One-sample t-test (***p < 0.001). Data were obtained from the GTEx dataset. e Association between PVRL2 minor haplotypes and transcripts of PVRL2 with variant rs6859 in blood (n = 124, T = −3.218, **p < 0.01, Beta = −0.209, for beta haplotype against the major haplotype). f Allelic imbalance of APOE variant rs429358 across multiple tissues. One-sample t-test (***p < 0.001 for representative results). Data were obtained from the GTEx and CommonMind datasets. g PVRL2 haplotype alpha was associated with changes of brain APOE transcript level in individuals not carrying an APOE-ε4 allele (nucleus accumbens, n = 67 or 10 for non-APOE-ε4 carrying individuals harboring 0 or 1 copies of PVRL2 haplotype alpha, respectively; T = 2.963, **p < 0.01, Beta = 0.943, for alpha haplotype against the major haplotype). Data are plotted as mean ± SEM in c, e, and g. Tissue abbreviations: ADRNLG adrenal gland, ARTAORT artery-aorta, ARTCRN artery-coronary, BRNCHA brain-cerebellum, BRNCHB brain-cerebellar hemisphere, BRNCTXA brain-cortex, BRNCTXB brain-frontal cortex (BA9), BRNHPP brain-hippocampus, BRNSPC brain-spinal cord (cervical c-1), HRTAA heart-atrial appendage, HRTLV heart-left ventricle, LIVER liver, LUNG lung, NERVET nerve-tibial, PNCREAS pancreas, SKINNS skin-not sun exposed (Suprapubic), SKINS skin-sun exposed (Lower leg); SPLEEN spleen, STMACH stomach, TESTIS testis, THYROID thyroid, UTERUS uterus, WHLBLD whole blood
Fig. 6
Fig. 6
Chromatin interaction analysis showing the physical interactions between the PVRL2, APOE, and APOC1 regions in fetal and adult human brain tissues. Chromatin interaction events were measured by Hi-C assay. Dot plots show the physical interaction events in and near the APOE region (19:45,330–45,440 kb) with a bin size of 10 kb. X and y-axes denote the genomic coordinates, with the corresponding gene body marked on the side (blue, red, and pink bars denote the gene body regions of PVRL2, APOE, and APOC1, respectively). Genomic regions that cover the risk haplotypes are denoted in yellow, and haplotype regions are denoted in cyan. The color intensity of dots represents the interaction strength of the corresponding pair of genomic regions (the enrichment score was calculated by dividing the observed number of contact events by the expected number of contact events; dark colors indicate strong interactions). Dot size corresponds to statistical significance (−log10 of the FDR); larger dots indicate higher confidence of the observed interaction. Hi-C results obtained from fetal (left panel) and adult (right panel) brain are shown. Interaction hotspots located in the regions that cover risk haplotypes and non-haplotype regions are bordered by yellow and cyan, respectively. For both groups, three replicates were pooled for the analysis. Mb megabases in GRCh37 coordinates, FDR false discovery rate
Fig. 7
Fig. 7
Heterogeneity of the prevalence of risk haplotypes in APOE and the surrounding region among populations. Data were derived from the 1000 Genomes phase 3 whole-genome sequencing dataset (n = 2504, comprising 661 African, 347 American, 503 European, 504 East Asian, and 489 South Asian genomes). a Major and minor haplotypes among populations. The proportions of minor haplotypes are shown as exploded areas in dark colors; areas with light colors denote the proportions of major haplotypes (i.e., the most frequent ones), and gray areas indicate the proportions of all other haplotypes for the corresponding locus. Exploded areas denote the phenotype-associated minor haplotypes for comparison across ethnic groups, with detailed frequencies shown in the right panel. b Frequencies of minor haplotypes across different ethnic groups, with the x-axis denoting the haplotype frequencies across super-populations

References

    1. Association As. 2018 Alzheimer's disease facts and figures. Alzheimer's. Dement. 2018;14:367–429. doi: 10.1016/j.jalz.2018.02.001. - DOI
    1. Lambert JC, et al. Meta-analysis of 74,046 individuals identifies 11 new susceptibility loci for Alzheimer's disease. Nat. Genet. 2013;45:1452–1458. doi: 10.1038/ng.2802. - DOI - PMC - PubMed
    1. Saunders AM, et al. Association of apolipoprotein E allele epsilon 4 with late-onset familial and sporadic Alzheimer's disease. Neurology. 1993;43:1467–1472. doi: 10.1212/WNL.43.8.1467. - DOI - PubMed
    1. Strittmatter WJ, et al. Apolipoprotein E: high-avidity binding to beta-amyloid and increased frequency of type 4 allele in late-onset familial Alzheimer disease. Proc. Natl Acad. Sci. USA. 1993;90:1977–1981. doi: 10.1073/pnas.90.5.1977. - DOI - PMC - PubMed
    1. Bullido MJ, et al. A polymorphism in the regulatory region of APOE associated with risk for Alzheimer's dementia. Nat. Genet. 1998;18:69–71. doi: 10.1038/ng0198-69. - DOI - PubMed

Publication types

MeSH terms