. 2019 Jul 25;10(1):3321.
doi: 10.1038/s41467-019-11316-4.

Artificial morphogen-mediated differentiation in synthetic protocells

Affiliations

Artificial morphogen-mediated differentiation in synthetic protocells

Liangfei Tian et al. Nat Commun. .

Abstract

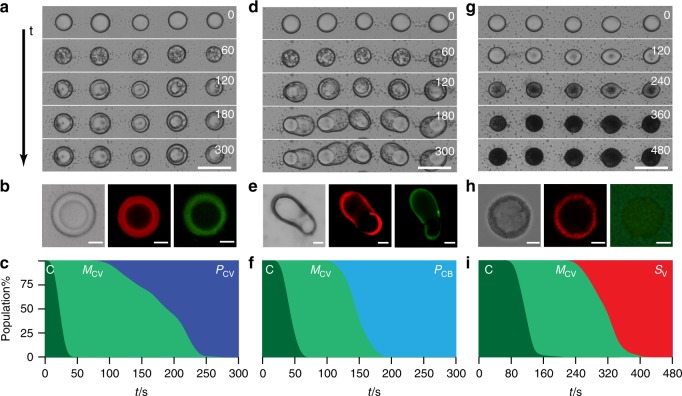
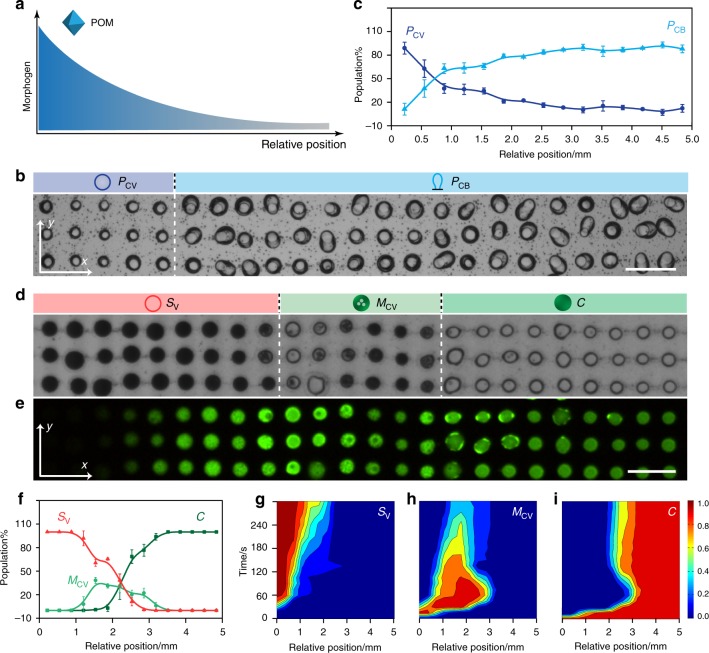
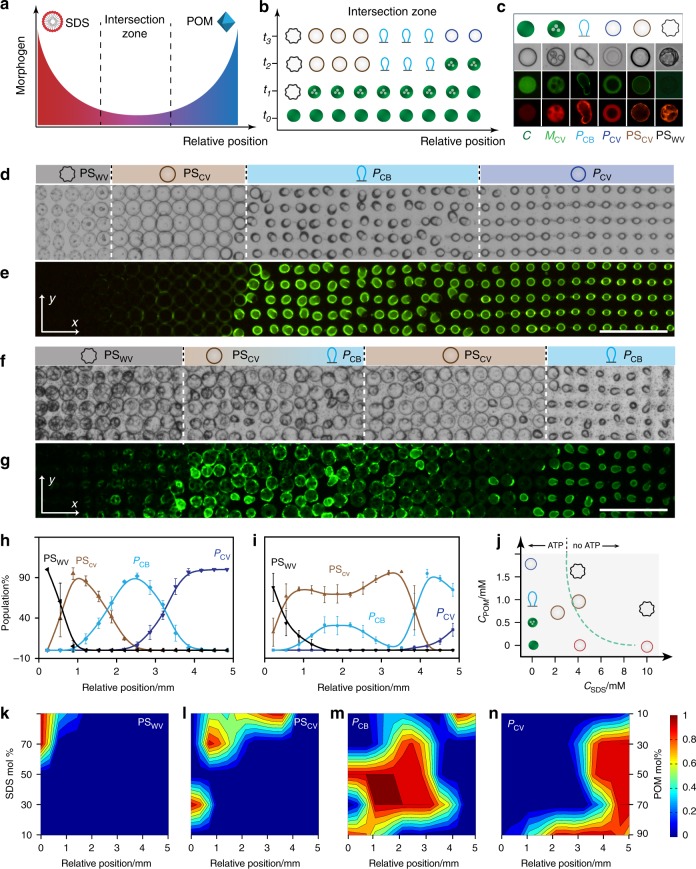
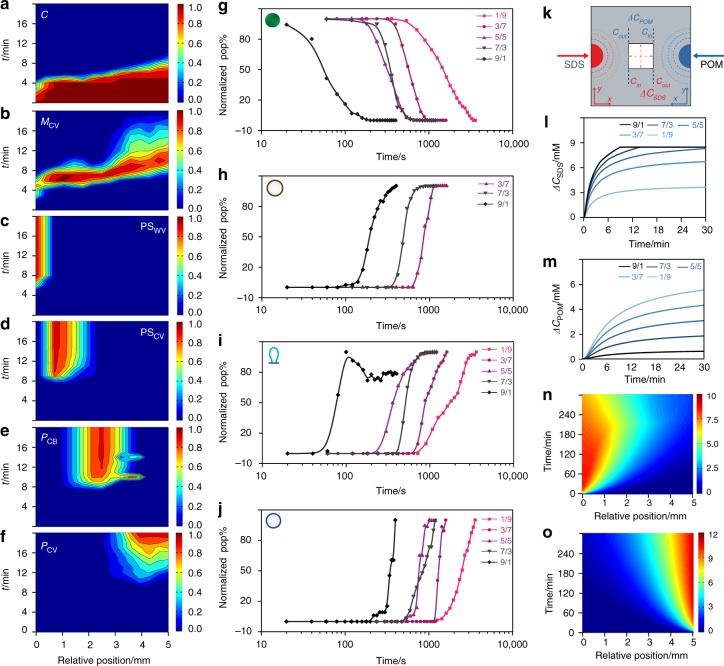
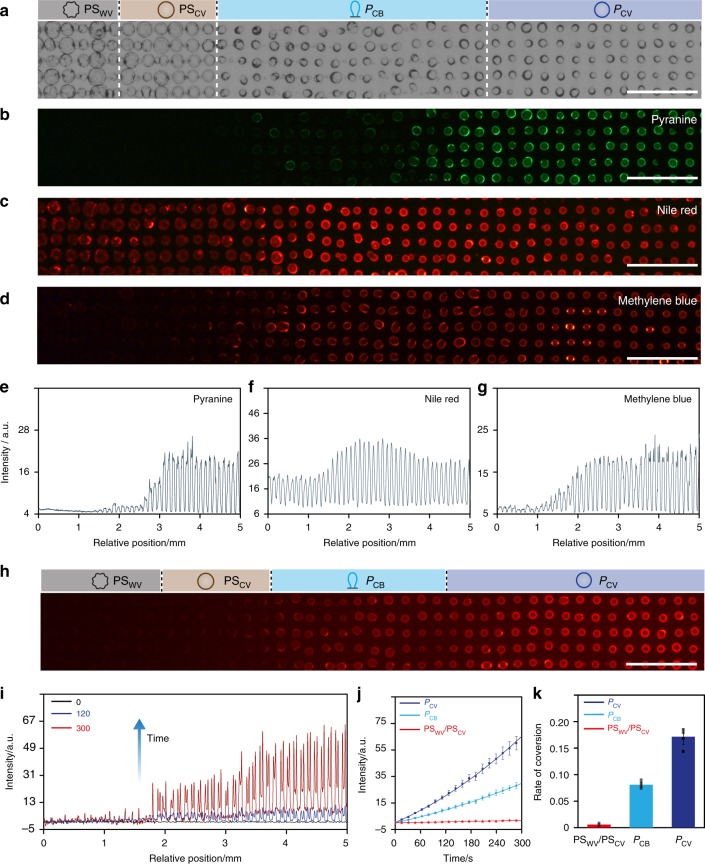
The design and assembly of artificial protocell consortia displaying dynamical behaviours and systems-based properties are emerging challenges in bottom-up synthetic biology. Cellular processes such as morphogenesis and differentiation rely in part on reaction-diffusion gradients, and the ability to mimic rudimentary aspects of these non-equilibrium processes in communities of artificial cells could provide a step to life-like systems capable of complex spatiotemporal transformations. Here we expose acoustically formed arrays of initially identical coacervate micro-droplets to uni-directional or counter-directional reaction-diffusion gradients of artificial morphogens to induce morphological differentiation and spatial patterning in single populations of model protocells. Dynamic reconfiguration of the droplets in the morphogen gradients produces a diversity of membrane-bounded vesicles that are spontaneously segregated into multimodal populations with differentiated enzyme activities. Our results highlight the opportunities for constructing protocell arrays with graded structure and functionality and provide a step towards the development of artificial cell platforms capable of multiple operations.


Conflict of interest statement

The authors declare no competing interests.

Figures

Fig. 1
Fig. 1
Morphological transformations under equilibrium conditions. a Time (t)-dependent optical microscopy images recorded from an acoustically formed array of PDDA/ATP coacervate micro-droplets at 0, 60, 120, 180 and 300 s after addition of a stirred solution of sodium phosphotungstate (POM, final concentration 2 mM). Scale bar, 100 µm. b Representative optical microscopy image (left), and RITC-PAH-doped (middle, red fluorescence) and TNP-ATP-doped (right, green fluorescence) fluorescence microscopy images of a single-POM/coacervate vesicle. Scale bars, 20 µm. c Corresponding area plot showing time-dependent changes in the numbers of native coacervate micro-droplets (C, dark green), multi-compartmentalized coacervate vesicles (MCV, light green) and spherical POM/coacervate vesicles (PCV, dark blue) over 300 s. Changes in populations are shown as percentage of total. df)As for ac) but in the presence of a lower final POM concentration (1 mM) showing transformation of the coacervate micro-droplets into POM/coacervate vesicles with balloon-like morphology (PCB, light blue) via a series of MCV intermediates (see images at t = 60 s). Scale bars, 100 µm (d) and 20 µm (e). gi As for ac but without POM and in the presence of SDS micelles (final concentration, 20 mM). Optical microscopy images are recorded at 0, 120, 240, 360 and 480 s (g). The coacervate droplets transform into ATP-depleted SDS/PDDA vesicles (SV) (h). Transformation to SV (red area in (i)) occurs sequentially over 300 s via a MCV intermediate. Scale bars, 100 µm (g) and 5 µm (h). Source data are provided as a Source Data file
Fig. 2
Fig. 2
Protocell differentiation in unidirectional gradients. a Graphical representation of a unidirectional POM chemical gradient (x-axis). Similar experiments were undertaken with a SDS chemical gradient. b Optical microscopy image of an acoustically patterned array of PDDA/ATP coacervate droplets observed in the viewing window after exposure to a unidirectional POM diffusion gradient advancing along the x-axis. Images were recorded after no further changes in morphology were observed (15 min). Only a small section (3 × 23 droplet grid) of the array in the observation window is displayed. Sodium phosphotungstate (POM) is introduced into the chamber from the left-hand side of the image (50 µL, 12.5 mM, final POM concentration, 0.625 mM). Dashed white line marks the interface between the two differentiated protocell populations; spherical and balloon-shaped POM/coacervate vesicles, PCV (dark blue circle) and PCB (light blue graphic), respectively. Scale bar, 200 µm. (c) Plot showing changes in the population number densities of PCV and PCB morphological types along the chemical gradient (from left to right along the x-axis) after POM-mediated differentiation under conditions as described in (b); number of counted protocells, n = 1500. d Optical microscopy image of a PDDA/ATP coacervate droplet array after exposure to a SDS chemical gradient advancing along the x-axis. Images were recorded after no further changes in morphology were observed (30 min). Only a thin section (3 × 24 droplet grid) of the array viewed in the observation window is displayed. SDS is introduced into the chamber (50 µL, 50 mM; final concentration, 2.5 mM) from the left-hand side of the image. Three spatially separated populations consisting of ATP-depleted SDS/PDDA vesicles (SV; red circle; left side), multi-compartmentalized coacervate vesicles (MCV; green circle with dots; centre) and native coacervate droplets (C; green filled circle; centre) are observed. Dashed white lines mark the interfaces between the differentiated protocell populations; scale bar, 200 µm. e Corresponding fluorescence microscopy image for (d); droplets were initially prepared with green fluorescent TNP-ATP. f Plot showing changes in the population number densities of SV, MCV and C morphological types along the morphogen gradient (from left to right along the x-axis) after SDS-mediated differentiation under conditions as described in (d); number of counted protocells, n = 1500. gi 2D plots showing spatial and temporal distributions of morphological types SV (g) MCV (h) and C (i) produced under conditions described in (d); colour scale represents percentage of a given population. Total number of counted protocells, n = 1500. The C to MCV transition occurs across regions of relatively high SDS concentration (left and centre-left) after approximately 30 s, followed by subsequent transformation to SV in areas of highest SDS concentration (far left). Coacervate droplets remain unchanged in domains of relatively low SDS concentration (right side). Source data are provided as a Source Data file. Error bars represent the standard deviation of the statistics count of the different lines of different protocells (n = 3)
Fig. 3
Fig. 3
Protocell differentiation in opposing gradients. a Graphical representation showing counter-directional SDS (left, red) and POM (right, blue) chemical gradients along the x-axis. b Graphic showing possible sequence of morphogen-mediated transformations in the intersection zone shown in (a) for a single row of PDDA/ATP coacervate droplets (green filled circles, time t = 0). The various spatiotemporal responses produce a row of differentiated protocells with different morphologies (see (c) for details). Relative positions are along the x-axis; tn = time intervals. c Panel of protocell morphological types produced in the SDS/POM intersection zone displaying representative graphics (row 1) and corresponding optical (row 2) and fluorescence microscopy images (row 3, TNP-ATP green fluorescence; row 4, RITC-PAH red fluorescence). From left to right; native coacervate droplet (C, filled green circle), multi-compartmentalized coacervate vesicle (MCV, green circle with dots), balloon-shaped POM/coacervate vesicle (PCB, (light blue graphic), spherical POM/coacervate vesicle (PCV, dark blue circle), POM/SDS/coacervate vesicle (PSCV, red circle) and POM/SDS wrinkled vesicle (PSWV, black graphic). d, e Optical (d) and corresponding fluorescence microscopy (e) images showing a 2D array of differentiated protocells viewed in the observation window after intersection of an opposing reaction-diffusion gradient of SDS (from left to right) and POM (from right to left) at an initial SDS : POM molar ratio of 2.3. Four spatially distinct populations are observed (white dashed lines). Images were recorded after no further changes in morphology were observed (30 min); displayed grid size, 5 × 42. f, g As for d, e, respectively, but for an initial SDS : POM morphogen ratio of 9.0 showing a spatially interpenetrating community. Images were recorded after no further changes in morphology were observed (20 min); displayed grid size, 5 × 42; scale bar 500 µm. h, i Plots showing correlated changes in relative number densities of four different types of differentiated protocells (% population) with spatial position along the direction (x-axis) of opposing morphogen gradients produced at SDS : POM molar ratios of 2.3 (h) and 9.0 (i). j Plot showing a landscape of protocell morphological types produced at different SDS : POM molar ratios under non-diffusive equilibrium conditions. Graphics corresponding to the different forms shown in c except for the SDS/PDDA vesicle (SV; red circle). All the forms develop irreversibly via a MCV intermediate except for PSWV which is derived from PSCV. Dashed line indicates the presence or absence of a coacervate phase (with/without ATP, respectively). kn 2D plots showing the spatial distributions for final populations of PSWV (k), PCV (l), PCB (m) and PSCV (n) morphological types produced in opposing morphogen gradients prepared by injection of different amounts of SDS and POM (% values). Colour scale represents percentage of a given population. Source data are provided as a Source Data file. Error bars represent the standard deviation of the statistics count of the different lines of different protocells (n = 3)
Fig. 4
Fig. 4
Population dynamics under opposing gradients. af 2D colour plots of the spatial and temporal population distributions of differentiated protocell types produced in an opposing morphogen gradient (initial SDS : POM molar ratio = 2.3 (70/30 mM)); a coacervate droplets (C); b multi-compartmentalized coacervate vesicles (MCV); c POM/SDS wrinkled vesicles (PSWV); d POM/SDS coacervate vesicles (PSCV); e balloon-shaped POM/coacervate vesicles (PCB) and f spherical coacervate vesicles (PCV). Colour scale represents number fraction of a given population; n = 1500. gj Plots showing time-dependent changes in normalized populations of native coacervate droplets C (g), and differentiated protocells PSCV (h), PCB (i) and PCV (j) in opposing morphogen gradients prepared under a range of initial SDS : POM molar ratios (9/1, 7/3, 5/5, 3/7). Data obtained from plots shown in a, d, e, f, respectively. k Simulation of opposing morphogen gradients in the central observation window (white square; 5 × 5 mm) of the acoustic trapping device. Changes in the SDS and POM concentrations perpendicular (y-axis) or parallel (x-axis) to the direction of diffusion are indicated (dashed red arrows in the centre square). The concentration gradients across the simulated area along the diffusion direction (x-axis) are defined as: ∆C = Cin – Cout. l, m Simulated time-dependent plots of the SDS concentration gradients (∆CSDS) (l) and POM concentration gradients (∆CPOM) (m) established across the observation window and along the diffusion direction (x-axis) for various opposing SDS/POM morphogen gradients (90/10, 70/30, 50/50, 30/70 and 10/90 µL; 50 mM). The horizontal line shown in l represents the CMC of SDS. n, o Representative simulated 2D plots of the spatial and temporal distributions of SDS (n) and POM (o) concentrations for an opposing SDS/POM morphogen gradient of 2.3 (70/30 µL; 50 mM) along the x-axis in the centre of the acoustic trapping device. Colour scale represents morphogen concentrations in mM. Source data are provided as a Source Data file
Fig. 5
Fig. 5
Functional diversity in differentiated protocell consortia. Representative optical (a) and corresponding fluorescence microscopy (bd) images of 2D arrays of differentiated coacervate droplets comprising a spatially separated tetra-modal distribution of PSWV, PSCV, PCB and PCV (from left to right, see graphics) morphological forms after exposure to aqueous solutions of pyranine (negatively charged, b), Nile Red (neutral, c) or methylene blue (positively charged, d); scale bars, 500 µm. eg Average fluorescence line intensity profiles recorded across the tetra-modal populations (spatial distribution) shown in b, c, d; a.u. arbitrary units. h Fluorescence microscopy image of a 2D array of HRP-containing differentiated protocells comprising a spatially separated tetra-modal distribution of PSWV, PSCV, PCB and PCV (from left to right, see graphics) morphological forms. The image is recorded 300 s after injection of a mixture of Amplex red and H2O2 across the 2D array; scale bar, 500 µm. i Average fluorescence line intensity profiles recorded across the tetra-modal population distribution shown in h at 0 (black line), 120 (blue) and 300 s (red) after addition of Amplex red and H2O2. j Plots of time-dependent changes in resorufin fluorescence mean intensity associated with individual HRP-containing PSWV and PSCV (red), PCB (light blue) and PCV (dark blue) types showing different rates of enzyme activity across the differentiated community. k Plots of the initial rates of HRP-mediated conversion of Amplex red to resorufin for data in j. Data recorded over the first 200 s; rate of conversion displayed as arbitrary units per second. The tetra-modal populations were prepared in opposing morphogen gradients (SDS, left side), POM (right side) at an initial SDS : POM molar ratio of 2.3 (70/30 µL; 50 mM). Source data are provided as a Source Data file. Error bars represent the standard deviation of the substrate conversion (n = 5)

References

    1. Noireaux V, Bar-Ziv R, Godefroy J, Salman H, Libchaber A. Toward an artificial cell based on gene expression in vesicles. Phys. Biol. 2005;2:1–8. doi: 10.1088/1478-3975/2/3/P01. - DOI - PubMed
    1. Tang T-YD, van Swaay D, deMello A, Anderson JLR, Mann S. In vitro gene expression within membrane-free coacervate protocells. Chem. Commun. 2015;51:11429–11432. doi: 10.1039/C5CC04220H. - DOI - PubMed
    1. Hansen MMK, et al. Macromolecular crowding creates heterogeneous environments of gene expression in picolitre droplets. Nat. Nanotech. 2016;11:191–197. doi: 10.1038/nnano.2015.243. - DOI - PMC - PubMed
    1. Weitz M, et al. Diversity in the dynamical behaviour of a compartmentalized programmable biochemical oscillator. Nat. Chem. 2014;6:295–302. doi: 10.1038/nchem.1869. - DOI - PubMed
    1. Crosby J, et al. Stabilization and enhanced reactivity of actinorhodin polyketide synthase minimal complex in polymer-nucleotide coacervate droplets. Chem. Comm. 2012;48:11832–11834. doi: 10.1039/c2cc36533b. - DOI - PubMed

Publication types

MeSH terms

Substances