. 2019 Jul 25;9(1):10807.
doi: 10.1038/s41598-019-46959-2.

Multiphase progenetic development shaped the brain of flying archosaurs

Affiliations

Multiphase progenetic development shaped the brain of flying archosaurs

Vincent Beyrand et al. Sci Rep. .

Abstract

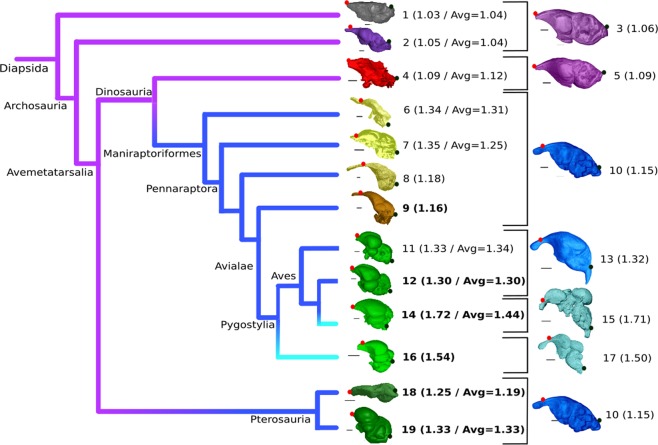
The growing availability of virtual cranial endocasts of extinct and extant vertebrates has fueled the quest for endocranial characters that discriminate between phylogenetic groups and resolve their neural significances. We used geometric morphometrics to compare a phylogenetically and ecologically comprehensive data set of archosaurian endocasts along the deep evolutionary history of modern birds and found that this lineage experienced progressive elevation of encephalisation through several chapters of increased endocranial doming that we demonstrate to result from progenetic developments. Elevated encephalisation associated with progressive size reduction within Maniraptoriformes was secondarily exapted for flight by stem avialans. Within Mesozoic Avialae, endocranial doming increased in at least some Ornithurae, yet remained relatively modest in early Neornithes. During the Paleogene, volant non-neoavian birds retained ancestral levels of endocast doming where a broad neoavian niche diversification experienced heterochronic brain shape radiation, as did non-volant Palaeognathae. We infer comparable developments underlying the establishment of pterosaurian brain shapes.


Conflict of interest statement

The authors declare no competing interests.

Figures

Figure 1
Figure 1
Heterochronic evolution of archosaurian endocranial geometry along the avian stem. Phylogeny of studied archosaurian groups and endocasts of key specimens visualised. Purple lineages exhibit low endocast doming, dark blue lineages exhibit medium endocast doming, light blue lineages exhibit high endocast doming. Volant taxa are indicated in bold, average group doming value (group declared after representative species) and/or measured specific doming value for single-taxon samples provided between brackets. Corresponding crocodilian ontogenetic stage is visualised through the associated endocast most right. Endocasts not to scale, individual scale bar lengths provided in caption. Dots indicate the positions of the anteriormost tip of the cerebrum (red dot) and the opisthion (black dot). Volant taxa are indicated in bold, average group doming value and/or measured specific doming value for single-taxon samples provided between brackets. Taxa presented: Podarcis muralis (1; scale bar 0.65 mm; Lepidosauria); Caiman crocodilus (2; 5 mm; Crocodylia); One-year-old Crocodylus niloticus (3; 2.5 mm); Arcovenator escotae (4; 20 mm; Non-maniraptoriform Dinosauria); C. niloticus hatchling (5; 2.5 mm); Struthiomimus altus (6; 10 mm; Ornithomimosauria); Incisivosaurus gauthieri (7; 10 mm; Non-avian Maniraptoriformes); Halszkaraptor escuillei (8; 3 mm); Archaeopteryx lithographica (9; 2.5 mm); 68-day-old C. niloticus embryo (10; 2.5 mm); Dromaius novaehollandiae (11; 6 mm; Palaeognathae); Phasianus colchicus (12; 3 mm; Galloanserae); 63-day-old C. niloticus embryo (13; 3 mm); Ficedula albicollis (14; 1.5 mm; Neognathae); 24-day-old C. niloticus embryo (15; 1,5 mm); Cerebavis cenomanica (16; 5 mm); 41-day-old C. niloticus embryo (17; 2.5 mm); Rhamphorhynchus muensteri (18; 5 mm; Rhamphorhynchidae); Araripesaurus santanae (19; 4.5 mm; Azhdarchidae).
Figure 2
Figure 2
Endocranial shape changes during ontogeny of crocodilian and avian taxa. (a) 29-day-old embryo of Crocodylus niloticus (scale: 1.5 mm); (b) 41-day-old embryo of C. niloticus (scale: 2.5 mm); (c) 93-day-old embryo of C. niloticus (scale: 3 mm); (d) Hatchling of C. niloticus (scale: 3 mm); (e) One-year-old juvenile of C. niloticus (scale: 4 mm); (f) Adult of C. niloticus (scale: 15 mm); (g) 5.5-day-old embryo of Gallus gallus (scale: 1.5 mm); (h) 12-day-old embryo of G. gallus (scale: 3 mm); (i) 19-day-old embryo of G. gallus (scale: 3.5 mm); (j) Three-week-old juvenile of G. gallus (scale: 2 mm); (k) Six-week-old juvenile of G. gallus (scale: 3 mm); (l) Adult of G. gallus (scale: 3.5 mm); (m) Six-day-old embryo of Ficedula albicollis (scale: 1.5 mm); (n) Hatchling of F. albicollis (scale: 2.5 mm); (o) Juvenile of F. albicollis (scale: 2.5 mm); (p) Adult of F. albicollis (scale: 2 mm). Stages a and g represent the brain shape at the end of the first third of in ovo development, stages b, h and m represent half of the in ovo development, stages c and i represent the final in ovo condition before hatchling.
Figure 3
Figure 3
Wulst expression in a modern avian endocast compared with the condition of Archaeopteryx. (a) Three-dimensional visualisation of the endocast of the snowy owl Bubo scandiacus; (b) Left lateral view of the complete endocast of the London specimen of Archaeopteryx; (c) Reconstructed partial endocast of the Munich specimen of Archaeopteryx superimposed on grey endocast silhouette of the London specimen of Archaeopteryx; (d) Slice view of the braincase of B. scandiacus at position of osseous delimitation of wulst (in red circle); (e) Slice view through the braincase of the London specimen of Archaeopteryx at position of delimitation of potential “wulst” presenting taphonomic fracture (in red circle); (f) Slice view of the braincase of the Munich specimen of Archaeopteryx at position homologous to the delimitation of potential “wulst”; (g) Detailed right lateral view of the endocast of the London specimen of Archaeopteryx; (h) Detailed left lateral view of the endocast of the London specimen of Archaeopteryx; (i) Left lateral left view of the telencephalic region of the Munich specimen of Archaeopteryx endocast; the red arrows indicate the position of the wulst on the surface of the B. scandiacus endocast and proposed wulst locations on the surface of the London and Munich specimens of Archaeopteryx. Abbreviations: Cb-Cerebrum; Cbl-Cerebellum; OT-Optic tectum. Scale bar: a-4 mm; b-c-3.5 mm; d-0.25 mm; e-0.3 mm; f-0.85 mm; g-h-i-1.5 mm.
Figure 4
Figure 4
Bivariate plots of developmental age versus endocranial doming (C/D) for selected archosaurian taxa. Ages presented as log-transformed age in days (a) and as developmental-stage-normalised ages relative to hatchling (1; b). Developmental series are divided in pre-hatchling (dashed line) and post-hatchling (continuous line) stages. Markers most right reflect the condition at sexual maturity.
Figure 5
Figure 5
PCA plots for Type I landmarks and semilandmarks, and associated dominant dorsal endocast shape changes. (a) Principal Component Analysis plot for Type I landmarks; (b) Summary of endocranial shape change along PC1 for Type I landmarks; dorsal endocast contours on deformation grid from average; (c) Principal Component Analysis plot for semilandmarks; (d) Summary of endocranial shape change along PC1 for semilandmarks; dorsal endocast contours on deformation grid from average. Crocodilian specimens are indicated by blue dots, the crocodilian distribution is delimited by a blue hull. Non-maniraptoriform dinosaurs are indicated with orange dots, Maniraptoriformes with yellow dots, Paleognathae with brown dots, and Neognathae with green dots. The avian distribution (Paleognathae + Neognathae) is delimited by a green hull. Endocast shape variations (b,d) include landmark positions as red dots. Coloured hulls (in b) delimit cerebral domains occupied by the telencephalon (orange) and rhombencephalon (yellow).
Figure 6
Figure 6
Bivariate plot of endocranial doming (C/D) versus log-transformed endocast length (Log D). Blue indicates crocodilian pre-hatchling (dashed light blue line) and post-hatchling (continuous dark blue line) ontogenetic trajectories. Coloured hulls delimit diapsid groups: Lepidosauria (grey), non-maniraptoriform Dinosauria (red), non-avian Maniraptoriformes (yellow), Pterosauria (dark green), volant non-neoavian birds (black), and non-volant Paleognathae and Neoaves (light green). The inset reflects the endocranial diversity of extant volant non-neoavian taxa: volant Paleognathae (brown), Anseriformes (dark blue), and Galliformes (dark pink). Dashed brown line visualises the addition of the extinct volant paleognath Lithornis plebius to extant flying Paleognathae. Visualised endocasts mark the positions of individual specimens: 1-Podarcis muralis; 2-Varanus exanthematicus; 3-Caiman crocodylus; 4-Crocodylus niloticus; 5-Alligator mississipiensis; 6-Heterodontosaurus tucki; 7-Psittacosaurus lujiatunensis; 8-Arcovenator escotae; 9-Tyrannosaurus rex; 10-Rhamphorhynchus muensteri; 11-Paraspicephalus purdoni; 12-Araripesaurus santanae; 13-Halszkaraptor escuillei (yellow star); 14-Incisivosaurus gauthieri; 15-Struthiomimus altus; 16-Archaeopteryx lithographica (orange stars); 17-Phasianus colchicus; 18-Leptoptilos crumeniferus; 19-Thalurania furcata; 20-Cerebavis cenomanica; 21-Ficedula albicollis; 22-Strix nebulosa; 23-Struthio camelus.

References

    1. Balanoff AM, Bever GS, Rowe TB, Norell MA. Evolutionary origins of the avian brain. Nature. 2013;501:93–96. doi: 10.1038/nature12424. - DOI - PubMed
    1. Kawabe S, Shimokawa T, Miki H, Matsuda S, Endo H. Variation in avian brain shape: relationship with size and orbital shape. J. Anat. 2013;223:495–508. - PMC - PubMed
    1. Sol D, Duncan RP, Blackburn TM, Cassey P, Lefebvre L. Big brains, enhanced cognition, and response of birds to novel environments. Proc. Natl. Acad. Sci. 2005;102:5460–6465. doi: 10.1073/pnas.0408145102. - DOI - PMC - PubMed
    1. Sol D, Székely T, Liker A, Lefebvre L. Big-brained birds survive better in nature. Proc. R. Soc. Lond. B. 2007;274:763–769. doi: 10.1098/rspb.2006.3765. - DOI - PMC - PubMed
    1. Sol D, et al. Evolutionary divergence in brain size between migratory and resident birds. PLOS ONE. 2010;5(3):e0009617. doi: 10.1371/journal.pone.0009617. - DOI - PMC - PubMed

Publication types

LinkOut - more resources