. 2019 Aug;22(8):1248-1257.
doi: 10.1038/s41593-019-0457-5. Epub 2019 Jul 25.

Spread of α-synuclein pathology through the brain connectome is modulated by selective vulnerability and predicted by network analysis

Affiliations

Spread of α-synuclein pathology through the brain connectome is modulated by selective vulnerability and predicted by network analysis

Michael X Henderson et al. Nat Neurosci. 2019 Aug.

Abstract

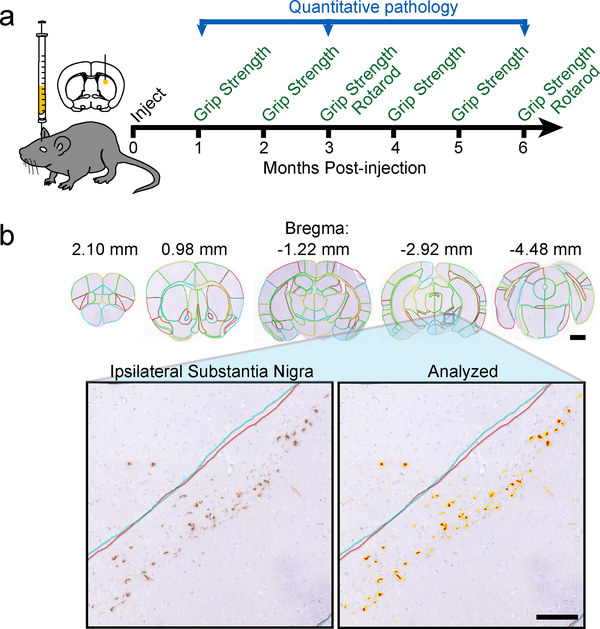
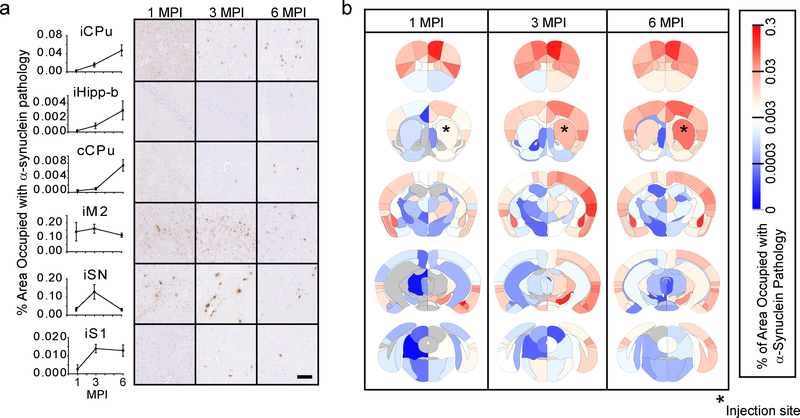
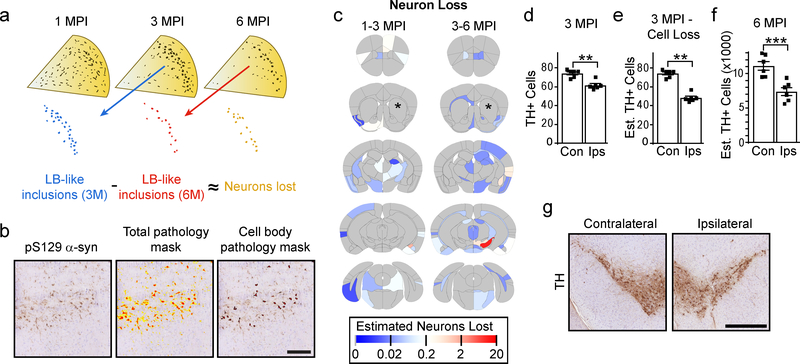
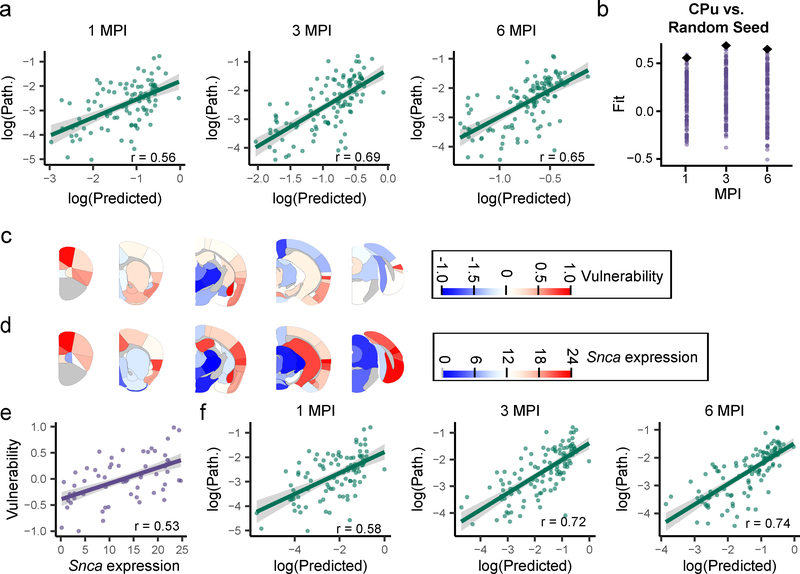
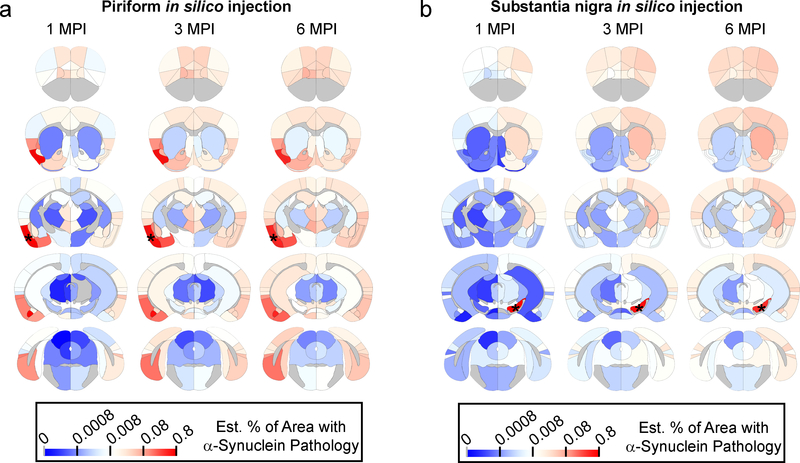
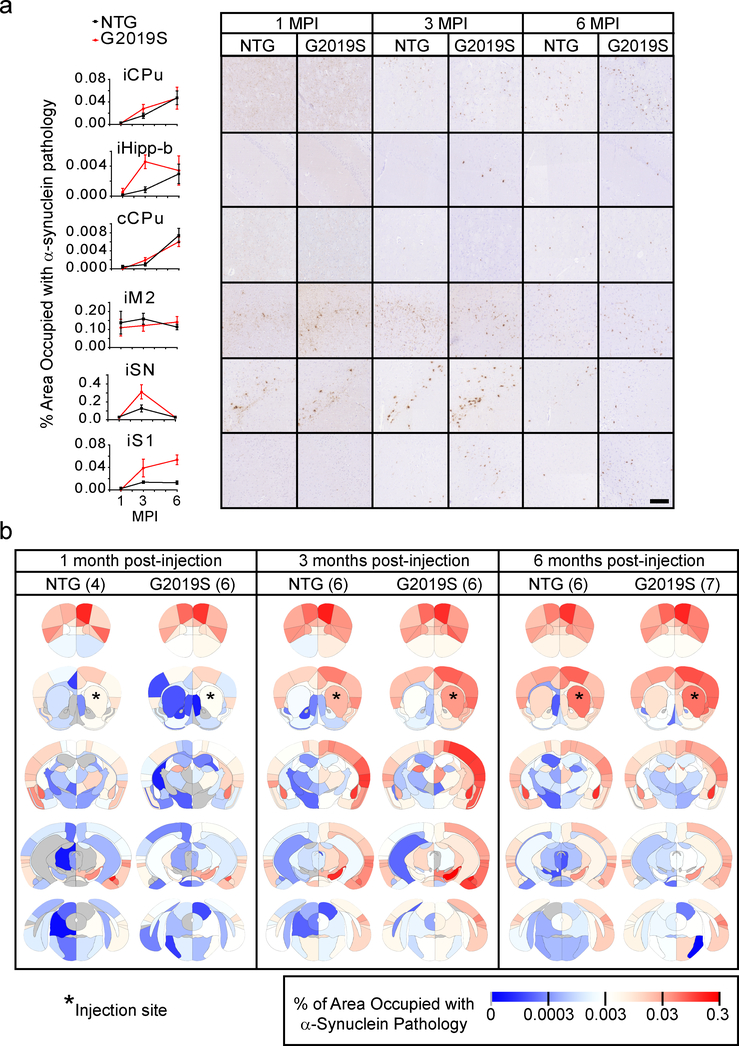
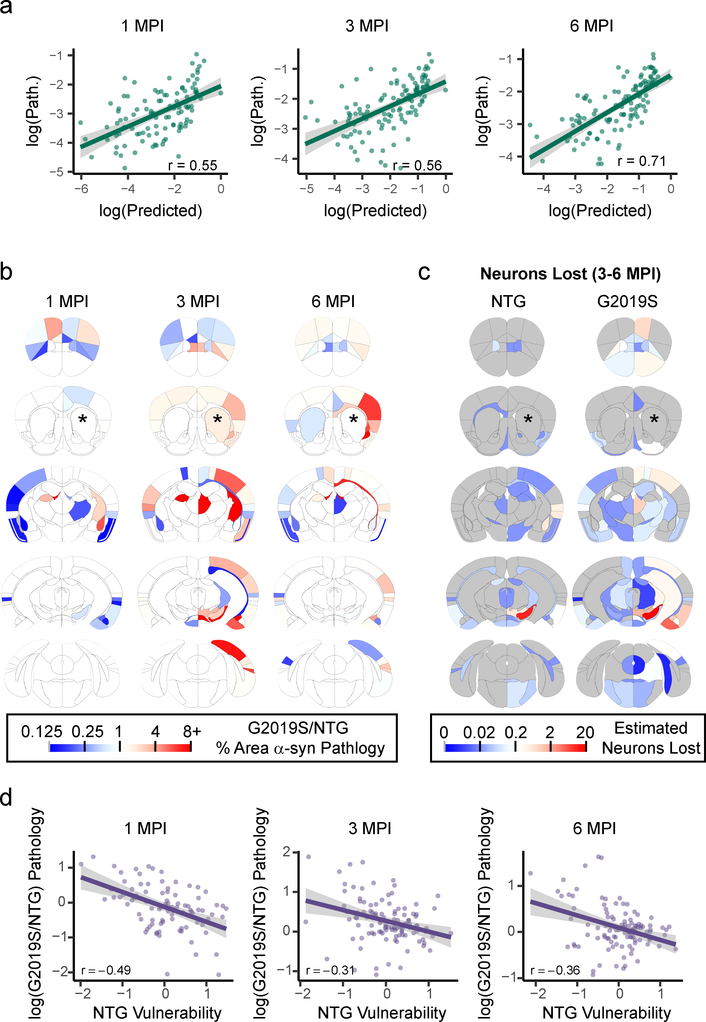
Studies of patients afflicted by neurodegenerative diseases suggest that misfolded proteins spread through the brain along anatomically connected networks, prompting progressive decline. Recently, mouse models have recapitulated the cell-to-cell transmission of pathogenic proteins and neuron death observed in patients. However, the factors regulating the spread of pathogenic proteins remain a matter of debate due to an incomplete understanding of how vulnerability functions in the context of spread. Here we use quantitative pathology mapping in the mouse brain, combined with network modeling to understand the spatiotemporal pattern of spread. Patterns of α-synuclein pathology are well described by a network model that is based on two factors: anatomical connectivity and endogenous α-synuclein expression. The map and model allow the assessment of selective vulnerability to α-synuclein pathology development and neuron death. Finally, we use quantitative pathology to understand how the G2019S LRRK2 genetic risk factor affects the spread and toxicity of α-synuclein pathology.


Conflict of interest statement

COMPETING INTERESTS STATEMENT

The authors declare no competing interests.

Figures

Fig. 1
Fig. 1. Quantitation of α-Synuclein pathology allows for brain-wide analysis of pathology spread.
a, Experiment schematic: mice were injected in the dorsal striatum with α-Synuclein at 3 months of age. The mice were then aged 1, 3 or 6 months post-injection and assessed for motor behaviors during that time period. The brains of mice were used for quantitative pathology analysis. b, Representative images of brain sections (similar for 16 wildtype mice) with manual annotation of 172 regions displayed (scale bar=1mm). The ipsilateral SN of this brain is shown below with and without an analysis mask overlaid (scale bar=100 μm).
Fig. 2
Fig. 2. α-Synuclein spreads in a dynamic spatiotemporal pattern throughout the mouse brain.
a, Representative quantitative pS129 α-Synuclein pathology plots and images are shown for 1-, 3- and 6-month timepoints (scale bar=50 μm). Plots display mean +/− standard error. b, Heat map of regions affected with α-Synuclein pathology. The names of the associated areas are plotted onto identical maps in the supplementary material. The color scale represents log-transformed mean percentage area occupied with α-Synuclein pathology. n (number of mice), 1 MPI=4, 3 MPI=6, 6 MPI=6.
Fig. 3
Fig. 3. Select quantification of cell body pathology allows for assessment of neuron loss.
a, Theoretical framework for assessing neuron loss. Pathology appears at 1 month as primarily neuritic pathology, which consolidates over time into large LB-like inclusions. If these large inclusions can be measured as sequential timepoints, it would allow an approximation of the number of neurons that are lost during that time period. b, An example of a region that has both high neuritic and cell body pathology burden. The total pathology mask identifies both forms of pathology, while the cell body pathology mask excludes neuritic pathology and identifies only cell body pathology (scale bar = 100 μm). c, Heat map of the estimated number of neurons lost in each anatomical region. The color scale represents log- transformed mean number of neurons lost between 1 and 3 (1–3 MPI) and between 3 and 6 (3–6 MPI) months post-injection. d, One section in between the two sections used for pathology quantitation was stained with an anti-TH antibody and used for quantification of substantia nigra neurons in each 3 month post-injection mouse (two-tailed paired t-test, p=0.0026). e, The mean estimated neuron loss between 3 and 6 months from the SN was subtracted from the TH cell counts in 3 MPI mice (two-tailed paired t-test, p=0.0075). f, Every 10th section through the SN was stained with an anti-TH antibody and SN neurons were counted to estimate the total number of neurons present in NTG mice 6 months after injection (two-tailed paired t-test, p=0.0003). g, Representative images of the contralateral and ipsilateral substantia nigra from NTG mice 6 months post-injection (scale bar = 500 μm). (Plots display mean +/− standard error with individual values plotted) n (number of mice), 1 MPI=4, 3 MPI=6, 6 MPI=6.
Fig. 4
Fig. 4. Network diffusion model based on anatomical connectivity explains pathological α-Synuclein spread.
a, Scatterplots and Pearson correlation coefficients (r) of log predicted pathology based on anatomical connectivity versus actual pathology values for each region are shown for 1 (df = 95, pcorr = 9.85×10⁻⁹), 3 (df = 111, pcorr = 1.66×10⁻¹⁶) and 6 (df = 111, pcorr = 2.64×10⁻¹⁴) MPI (two-tailed t-tests). p-values were Bonferroni-corrected over the 3 time points. The green line represents the line of best fit, and the shaded ribbon represents the 95% prediction interval. b, Each different brain region was seeded and pathology propagation was modeled from each site. The fit of each of these sites is plotted for 1, 3, and 6 MPI (purple dots). The CPu seed (black diamond) produced either the best fit (3 and 6 MPI, 100th percentile of fits) or second best fit (1 MPI, 99th percentile of fits). c, Heat map of the residuals between the log(predicted) and log(pathology) are plotted on an anatomical mouse brain as a measure of the relative vulnerability of regions. d, Heat map of the Snca mean expression energy values from the Allen Brain Atlas in situ hybridization data for each of the designated regions. e, Scatterplots and Pearson correlation coefficients (r) of Snca expression energy and vulnerability estimates for each region. The two values show a positive Pearson correlation of r = 0.53 (two-tailed t-test, df = 114, p = 1.08×10⁻⁹). The purple line represents the line of best fit, and the shaded ribbon represents the 95% prediction interval. f, Scatterplots and Pearson correlation coefficients (r) of log predicted pathology based on anatomical connectivity and Snca expression vs. log actual pathology values for each region are shown for 1 (df = 95, Pcorr = 1.85×10⁻⁹), 3 (df = 111, pcorr = 5.84×10⁻¹⁹) and 6 (df = 111, pcorr = 1.34×10⁻²⁰) MPI (two-tailed t-tests). p-values were Bonferroni-corrected over the 3 time points. The green line represents the line of best fit, and the shaded ribbon represents the 95% prediction interval. n (number of mice): 1 MPI=4, 3 MPI=6, 6 MPI=6).
Fig. 5
Fig. 5. In silico seeding of alternate regions in mouse brain.
Heat map of regions affected with α-synuclein pathology with in silico propagation of α-Synuclein pathology after seeding in either a, the piriform cortex or b, the substantia nigra. The color scale represents log-transformed mean percentage area occupied with α-Synuclein pathology.
Fig. 6
Fig. 6. Quantitative α-Synuclein pathology mapping allows a direct comparison between NTG and G2019S LRRK2 mice.
a, Representative quantitative pS129 α-Synuclein pathology plots and images are shown for 1-, 3- and 6-month timepoints for both NTG and G2019S mice (scale bar = 100 μm). Plots display mean +/− standard error. b, Heat map of regions affected with α-Synuclein pathology. The names of the associated areas are plotted onto identical maps in the supplementary material. The color scale represents log-transformed mean percentage area occupied with α-Synuclein pathology. n (number of mice), 1 MPI-NTG=4, 1 MPI-G2019S=6, 3 MPI-NTG=6, 3 MPI-G2019S=6, 6 MPI-NTG=6, 6 MPI-G2019S=7.
Fig. 7
Fig. 7. α-Synuclein pathology shows enhanced spread and toxicity in resilient regions in G2019S LRRK2 mice.
a, Scatterplots and Pearson correlation coefficients (r) of log predicted pathology based on anatomical connectivity and Snca expression versus actual pathology values for each region are shown for 1 (df = 104, pcorr = 2.00×10⁻⁹), 3 (df = 112, pcorr = 2.39×10⁻¹⁰) and 6 (df = 113, pcorr = 9.07×10⁻¹⁹) MPI (two-tailed t-tests). p-values were Bonferroni-corrected over the 3 time points. The green line represents the line of best fit, and the shaded ribbon represents the 95% prediction interval. b, Heat map of regional ratios of pathology in G2019S/NTG mice. Warm colors represent areas with more pathology in G2019S mice, while cooler colors represent regions with less pathology in G2019S mice. c, Heat map of the estimated number of neurons lost in each anatomical region in NTG and G2019S mice. The color scale represents log-transformed mean number of neurons lost between 3 and 6 (3–6 MPI) months post-injection. d, Scatterplots and Pearson correlation coefficients (r) of timepoint-specific NTG regional vulnerability measures versus log G2019S/NTG pathology, showing a negative correlation between the two variables at 1 (df = 89, pcorr = 2.88×10⁻⁶), 3 (df = 109, pcorr = 0.0027) and 6 (df = 110, pcorr = 0.00035) MPI (two-tailed t-tests). p-values were Bonferroni-corrected over the 3 time points. The purple line represents the line of best fit, and the shaded ribbon represents the 95% prediction interval. n (number of mice), 1 MPI=6, 3 MPI=6, 6 MPI=7.

Comment in

References

    1. Spillantini MG et al. Filamentous alpha-Synuclein inclusions link multiple system atrophy with Parkinson’s disease and dementia with Lewy bodies. Neuroscience letters 251, 205–208 (1998). - PubMed
    1. Spillantini MG, Crowther RA, Jakes R, Hasegawa M & Goedert M alpha-Synuclein in filamentous inclusions of Lewy bodies from Parkinson’s disease and dementia with lewy bodies. Proc Natl Acad Sci U S A 95, 6469–6473 (1998). - PMC - PubMed
    1. Baba M et al. Aggregation of alpha-Synuclein in Lewy bodies of sporadic Parkinson’s disease and dementia with Lewy bodies. The American journal of pathology 152, 879–884 (1998). - PMC - PubMed
    1. Rodrigues e Silva AM et al. Who was the man who discovered the “Lewy bodies”? Movement disorders : official journal of the Movement Disorder Society 25, 1765–1773, doi: 10.1002/mds.22956 (2010). - DOI - PubMed
    1. Luna E & Luk KC Bent out of shape: alpha-Synuclein misfolding and the convergence of pathogenic pathways in Parkinson’s disease. FEBS letters 589, 3749–3759, doi: 10.1016/j.febslet.2015.10.023 (2015). - DOI - PMC - PubMed

Publication types

Substances

LinkOut - more resources