. 2019 Aug;22(8):1318-1326.
doi: 10.1038/s41593-019-0443-y. Epub 2019 Jul 25.

Dynamic nonlinearities enable direction opponency in Drosophila elementary motion detectors

Affiliations

Dynamic nonlinearities enable direction opponency in Drosophila elementary motion detectors

Bara A Badwan et al. Nat Neurosci. 2019 Aug.

Abstract

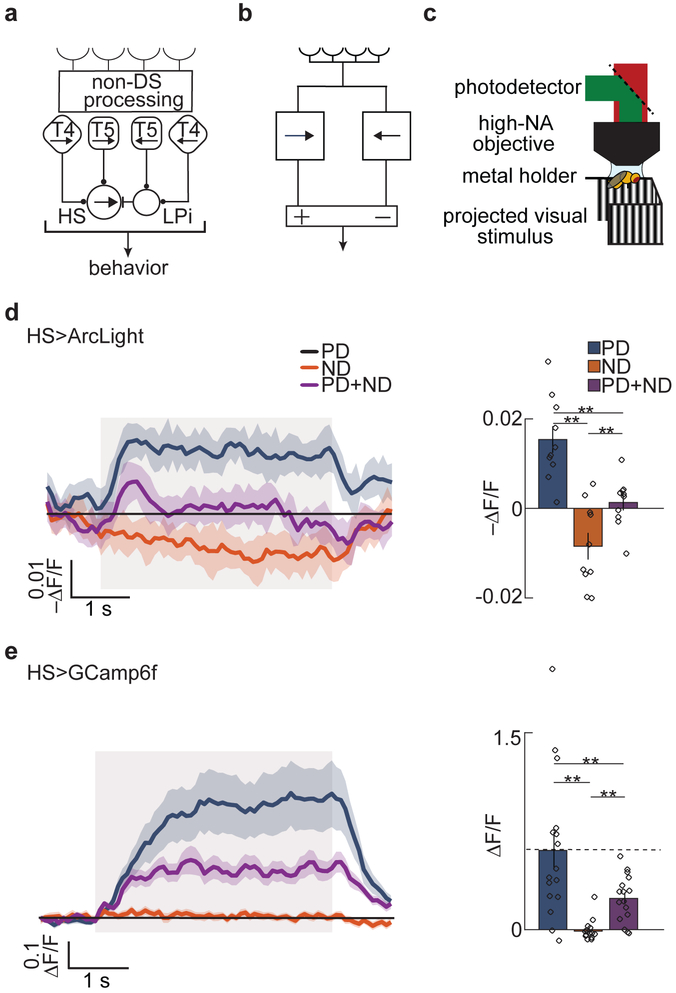
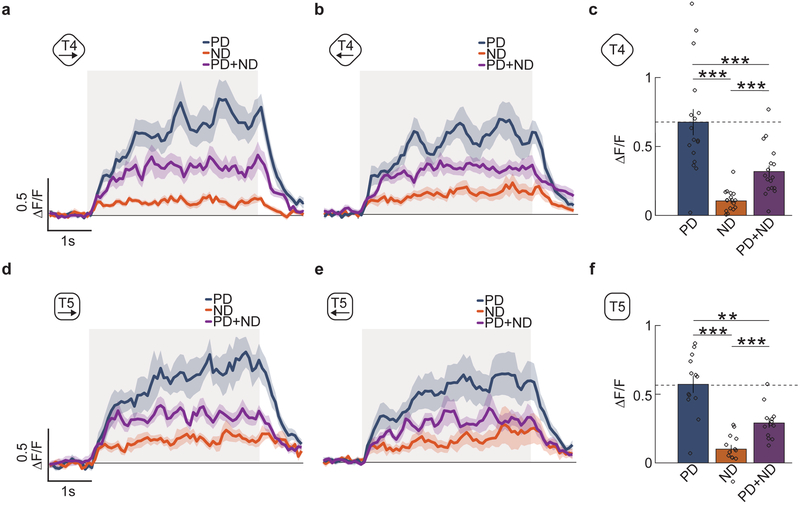
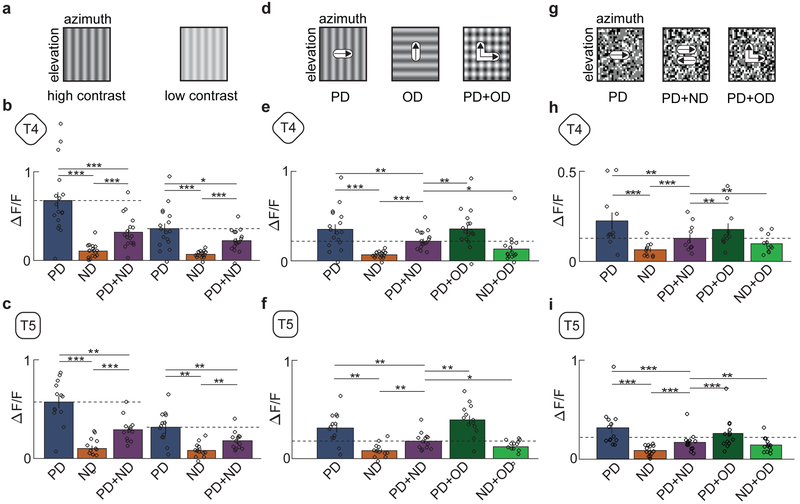
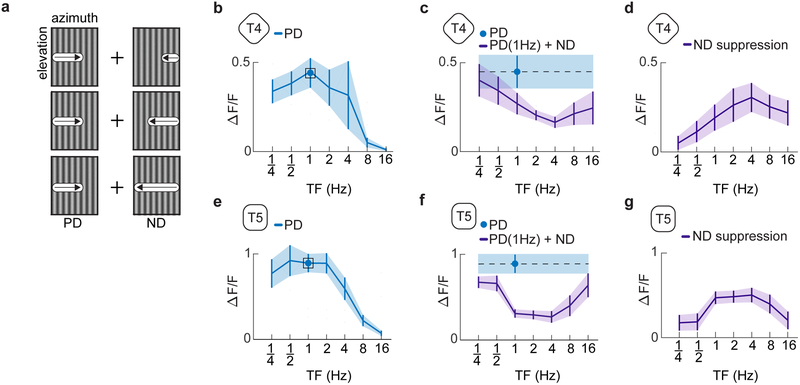
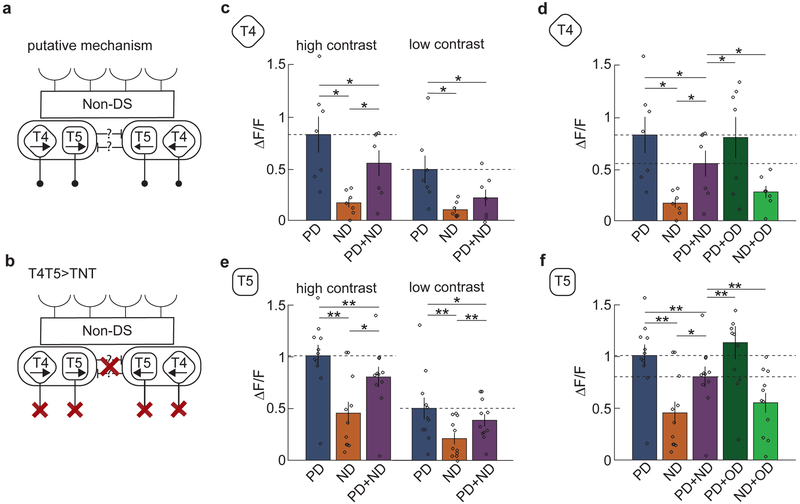
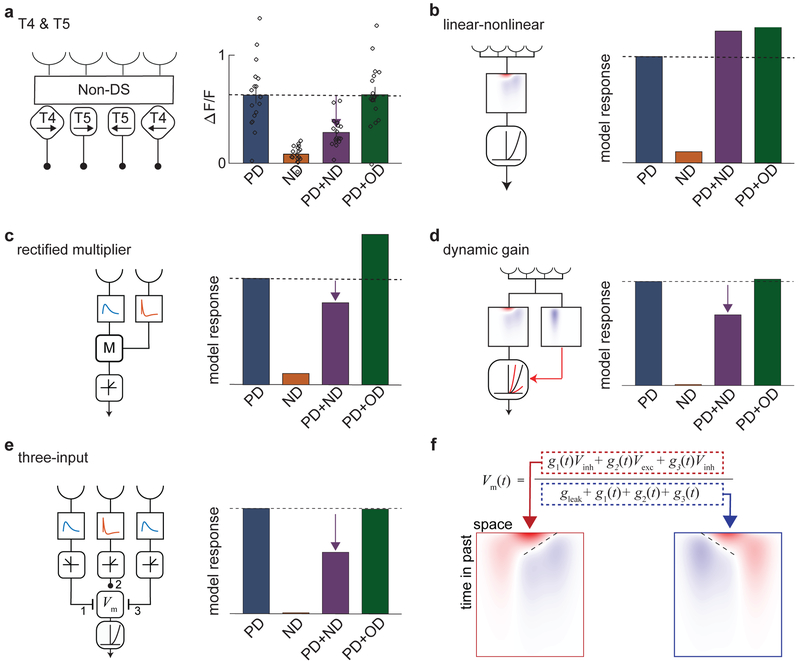
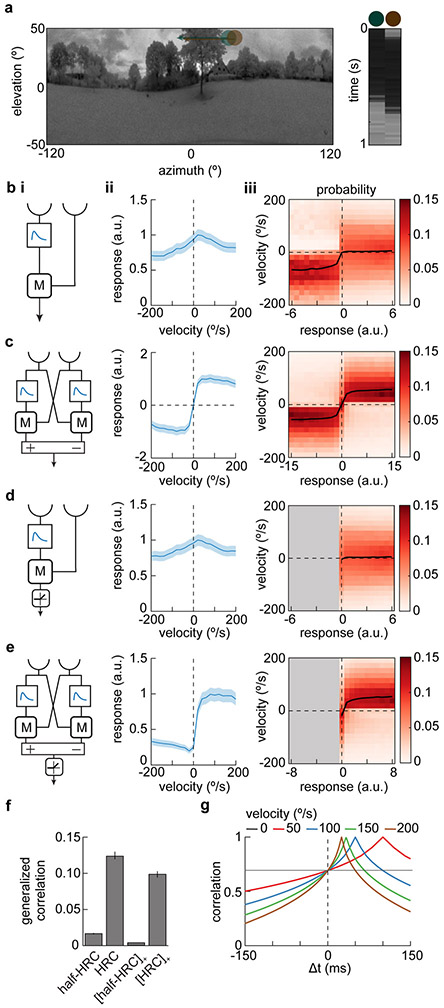
Direction-selective neurons respond to visual motion in a preferred direction. They are direction-opponent if they are also inhibited by motion in the opposite direction. In flies and vertebrates, direction opponency has been observed in second-order direction-selective neurons, which achieve this opponency by subtracting signals from first-order direction-selective cells with opposite directional tunings. Here, we report direction opponency in Drosophila that emerges in first-order direction-selective neurons, the elementary motion detectors T4 and T5. This opponency persists when synaptic output from these cells is blocked, suggesting that it arises from feedforward, not feedback, computations. These observations exclude a broad class of linear-nonlinear models that have been proposed to describe direction-selective computations. However, they are consistent with models that include dynamic nonlinearities. Simulations of opponent models suggest that direction opponency in first-order motion detectors improves motion discriminability by suppressing noise generated by the local structure of natural scenes.


Figures

Fig 1.
Fig 1.. Measurements of opponency and linear-nonlinear models for motion detection.
a) Schematic of first- and second-order DS cells in the fly visual system. HS neurons become opponent by subtracting signals from the first-order DS cells, T4 and T5, with opposite preferred directions. This subtraction is mediated by inhibitory LPi neurons. b) Schematic of a generic DO model. c) Schematic of the two-photon microscope set up and panoramic visual display. d) Fluorescent intensity trace (left) and mean intensity over the stimulus presentation time. (right) of HS neurons expressing the voltage indicator Arclight in response to PD (blue), ND (orange), and PD + ND (purple) sinusoidal gratings. Throughout, bar graphs show mean ± SEM. Shaded region indicates stimulus duration. (** p < 0.01, by a paired two-sided Wilcoxon signed-rank test; pPD,ND = 0.0020, pPD,PD+ND = 0.0039, pND,PD+ND = 0.0098; n = 10 flies) e) Fluorescent intensity trace (left) and mean intensity over the stimulus presentation time (right) of HS neurons expressing the calcium indicator GCaMP6f in response to PD (blue), ND (orange), and PD + ND (purple) sinusoidal gratings. Shaded region indicates stimulus duration. (** p < 0.01, by a paired two-sided Wilcoxon signed-rank test; pPD,ND = 0.0013, pPD,PD+ND = 0.0013, pND,PD+ND = 0.0027; n = 16 flies) (See also Figure S1 for intuition about opponency and for behavioral results.)
Fig 2.
Fig 2.. The first-order direction-selective neurons T4 and T5 exhibit opponent responses.
a) Average time trace of the response of T4 axon terminals in lobula plate layer 1 to PD, ND and PD+ND stimuli. These are front-to-back, (blue line), back-to-front (orange line), and the combined (purple line) sinusoidal gratings with wavelength 45° and temporal frequency of 1 Hz. Shaded region indicates stimulus duration. (n = 17 flies) b) Average time trace of the response of T4 axon terminals in lobula plate layer 2 to PD (blue line), ND (orange line) and PD+ND (purple line) stimuli. Shaded region indicates stimulus duration. (n = 13 flies) c) The responses of T4 in both layers are averaged and their responses are averaged over time to generate a single mean response over flies. (** p < 0.01, *** p < 0.001, by a paired two-sided Wilcoxon signed-rank test; pPD,ND = 0.0003, pPD,PD+ND = 0.0004, pND,PD+ND = 0.0003; n = 17 flies) (d-f) As in (a-c) but for T5 cells. (** p < 0.01, *** p < 0.001, by a paired two-sided Wilcoxon signed-rank test; pPD,ND = 0.0007, pPD,PD+ND = 0.0024, pND,PD+ND = 0.0005; n = 13 flies)
Fig 3.
Fig 3.. Opponency persists under changes of contrast and stimulus type.
a) Intensity plots of a sinusoidal grating at high and low contrast (contrast 0.5 and 0.25). b) Average responses of T4 to high- (left) and low-contrast (right) sinusoidal gratings. (* p < 0.05, ** p < 0.01, *** p < 0.001, by a paired two-sided Wilcoxon signed-rank test; for high-contrast (left) p-values refer to Fig 2. caption; for low-contrast (right) pPD,ND = 0.0003, pPD,PD+ND = 0.0352, pND,PD+ND = 0.0004; n = 17 flies) c) Average responses of T5 to high- (left) and low-contrast (right) sinusoidal gratings. (* p < 0.05, ** p < 0.01, *** p < 0.001, by a paired two-sided Wilcoxon signed-rank test, for high-contrast (left) refer to Fig 2. caption; for low-contrast (right) pPD,ND = 0.0007, pPD,PD+ND = 0.0024, pND,PD+ND = 0.0005; n = 13 flies) d) Intensity plots of rightwards and upwards moving sinusoidal gratings and the two combined. The composite stimulus consists of sinusoidal gratings moving in the PD and in the orthogonal direction (OD). e) Average responses of T4 to stimuli composed of gratings in the PD, ND, PD+ND, PD+OD, and ND+OD. (* p < 0.05, ** p < 0.01, *** p < 0.001, by a paired two-sided Wilcoxon signed-rank test; pOD+PD,PD+ND = 0.0019, pOD+ND,PD+ND = 0.0148; n = 17 flies) f) Average responses of T5 to stimuli composed of gratings in the PD, ND, PD+ND, PD+OD, and ND+OD. (* p < 0.05, ** p < 0.01, *** p < 0.001, by a paired two-sided Wilcoxon signed-rank test; pOD+PD,PD+ND = 0.0012, pOD+ND,PD+ND = 0.0215; n = 13 flies) g) Random dot stimulus made of 5°×5° white and black dots moving in one direction (left panel). The stimulus was combined with one moving in the opposing direction to produce a denser stimulus with containing dots moving in both direction (middle panel). A second composite stimulus was generated by adding a second dot pattern moving in an OD (right panel). h) Average responses of T4 to dots moving in the PD, ND, PD+ND, PD+OD, and ND+OD. (* p < 0.05, ** p < 0.01, *** p < 0.001, by a paired two-sided Wilcoxon signed-rank test; pPD,ND = 0.0019, pPD,PD+ND = 0.0020, pND,PD+ND = 0.0010, pOD+PD,PD+ND = 0.0048, pOD+ND,PD+ND = 0.010; n = 11 flies) i) Average responses of T5 to dots moving in the PD, ND, PD+ND, PD+OD, and ND+OD. (* p < 0.05, ** p < 0.01, *** p < 0.001, by a paired two-sided Wilcoxon signed-rank test; pPD,ND = 0.0007, pPD,PD+ND = 0.0010, pND,PD+ND = 0.0002, pOD+PD,PD+ND = 0.0010, pOD+ND,PD+ND = 0.033; n = 13 flies) (See also Figure S2 for a comparison of the contrast distributions of PD, PD+ND, and PD+OD.)
Fig 4.
Fig 4.. Temporal tuning of opponent suppression.
a) Intensity plots of the two individual sinusoidal components of the composite stimuli tested. Sinusoidal gratings of differing temporal frequencies moving in the ND were added to a base sinusoid moving in the PD with a temporal frequency of 1 Hz. b) The temporal frequency tuning curve of T4 cells in response to PD motion. c) Average response of T4 cells to a 1 Hz sine wave moving in the PD (blue). The response of T4 cells to a stimulus composed of a 1 Hz sinusoid moving in the PD and sinusoid moving in the ND with varying temporal frequency (purple). Plots show mean ± SEM. d) Suppressive effect of the added ND sinusoid equal to the bare PD sinusoidal response minus the response to the summed gratings at each frequency. Plots show mean ± SEM. (n = 12 flies for panels (b-d)) e-g) As in (b-d) but for T5. (n = 6 flies) (See also Figure S3 for null direction suppression with other stimuli.)
Fig 5.
Fig 5.. T4 and T5 cells with silenced synapses continue to show opponency.
a) Suggested putative circuit for T4 and T5 feedback onto T4 and T5, which could generate opponency. b) Schematic of T4 and T5 chemical synaptic output suppressed by expression of tetanus toxin (TNT). c) Average responses of T4 cells expressing TNT to PD (blue), ND (orange), and PD+ND (purple) sinusoidal gratings at high and low contrast. The addition of ND stimuli continued to suppress the response. (* p < 0.05, ** p < 0.01, by a paired two-sided Wilcoxon signed-rank test; at high contrast, pPD,ND = 0.0156, pPD,PD+ND = 0.0313, pND,PD+ND = 0.0156; at low contrast, pPD,ND = 0.0156, pPD,PD+ND = 0.0156, pND,PD+ND = 0.2188; n = 7 flies) d) Average responses of T4 cells expressing TNT to composite stimuli moving in the PD, ND, PD+ND, PD+OD, and ND+OD. (* p < 0.05, ** p < 0.01, by a paired two-sided Wilcoxon signed-rank test; pOD+PD,PD+ND = 0.0313, pOD+ND,PD+ND = 0.0156; n = 7 flies) (e-f) As in (c) and (d) but with T5 cells. (At high contrast, pPD,ND = 0.0010, pPD,PD+ND = 0.0020, pND,PD+ND = 0.0186, pOD+PD,PD+ND = 0.0049, pOD+ND,PD+ND = 0.0020; at low contrast, pPD,ND = 0.001, pPD,PD+ND = 0.042, pND,PD+ND = 0.0068, n = 11 flies in both panels) Note in (f) that a single outlying point of value 2.3 is not shown in the PD+OD condition. (See also Figure S4 for behavioral results validating TNT expression.)
Fig 6.
Fig 6.. Feedforward models can produce direction-opponent responses.
a) Schematic of T4 and T5 (left), and mean responses of T4 and T5 (right) to sinusoidal gratings moving in the PD (blue), ND (orange), PD+ND (purple), and PD+OD (green). (n = 17 flies) b) Schematic of linear-nonlinear (LN) model with specified spatiotemporal filter and an expansive nonlinearity. Regardless of the specific choice of filter or expansive nonlinearity, such LN models cannot generate DO responses to sinusoidal gratings (see Supp. Notes 1 and 2). c) A two-input multiplicative model with rectified output (rectified HRC half-correlator) in which one temporal filter is the derivative of the other. This model is opponent, but shows stronger PD+OD enhancement than T4 and T5. (See Methods for details on this and subsequent models, as well as Supp. Note 3.) d) A dynamic gain model in which a second linear filter controls the gain of a half-quadratic nonlinearity acting on the output of an oriented linear filter. This model shows opponency with only weak PD+OD enhancement. e) Three-input model with a center ON excitatory input and flanking delayed ON and OFF inhibitory inputs. The voltage-to-calcium transformation is modeled as a half-quadratic. This model shows strong opponency and little change with the addition of OD stimuli. f) The equation for membrane potential used in the three-input model shown in (e). The composite linear receptive fields of the numerator (outlined in red) and denominator (outlined in blue) have opposite directional tunings. (See also Figure S5 and S6 for more details on the models.)
Figure 7.
Figure 7.. Opponency improves velocity discriminability in elementary motion detectors.
a) A natural scene from the database (left) with two photodetector inputs to an elementary motion detector shown in green and brown. The scene moves at a constant velocity of 50°/s from left to right which is equivalent to the photodetectors moving from right to left. The response over time of the two detectors is shown (right). Natural scene image is from Meyer HG, Schwegmann A, Lindemann JP, Egelhaaf M. (2014): ‘Panoramic high dynamic range images in diverse environments.’ Bielefeld University. doi:10.4119/unibi/2689637. b) Model responses to natural scenes. (i) Schematic diagram of one half of a Hassenstein-Reichardt Correlator (half-HRC). This model is identical to the multiplicative model shown in Figure 6c, but with filters chosen such that it does not generate DO responses. (ii) Mean response of this model averaged over the database of natural scenes moving at different velocities. Error patches show ±1 SEM. (iii) Distribution of scene velocities given different model responses. c) As in (b), but for a full, opponent HRC model. This model consists of two copies of the model in (b), but subtracted to generate an opponent model. d) As in (b), but for a half-wave rectified half-HRC model. e) As in (b), but for a half-wave rectified full, opponent HRC model. f) Generalized correlation between model response and the velocity of the natural scenes. Error bars show 99% confidence intervals estimated by bootstrapping. g) Time-lag cross-correlation in contrast between two points 5° apart while natural scenes move at different constant velocities. Moving natural scenes are positively correlated at 5° even without a temporal delay. (See also Figure S7 for the full distributions of input velocities and responses for the opponent and non-opponent models.)

References

Citations

    1. Snowden RJ, Treue S, Erickson RG & Andersen RA The response of area MT and V1 neurons to transparent motion. J. Neurosci. 11, 2768–2785 (1991). - PMC - PubMed
    1. Hausen K Motion sensitive interneurons in the optomotor system of the fly. Biol. Cybern. 45, 143–156 (1982).
    1. Heeger DJ, Boynton GM, Demb JB, Seidemann E & Newsome WT Motion opponency in visual cortex. J. Neurosci. 19, 7162–7174 (1999). - PMC - PubMed
    1. Qian N & Andersen RA Transparent motion perception as detection of unbalanced motion signals. II. Physiology. J. Neurosci. 14, 7367–7380 (1994). - PMC - PubMed
    1. Joesch M, Plett J, Borst A & Reiff D Response properties of motion-sensitive visual interneurons in the lobula plate of Drosophila melanogaster. Curr. Biol. 18, 368–374 (2008). - PubMed

Methods Citations

    1. Clark DA et al. Flies and humans share a motion estimation strategy that exploits natural scene statistics. Nat. Neurosci. 17, 296–303 (2014). - PMC - PubMed
    1. Wilson RI, Turner GC & Laurent G Transformation of olfactory representations in the Drosophila antennal lobe. Science’s STKE 303, 366 (2004). - PubMed
    1. Pologruto TA, Sabatini BL & Svoboda K ScanImage: flexible software for operating laser scanning microscopes. Biomed. Eng. Online 2, 13 (2003). - PMC - PubMed
    1. Mukamel EA, Nimmerjahn A & Schnitzer MJ Automated analysis of cellular signals from large-scale calcium imaging data. Neuron 63, 747–760 (2009). - PMC - PubMed
    1. Brainard DH The psychophysics toolbox. Spatial vision 10, 433–436 (1997). - PubMed

Publication types

LinkOut - more resources