. 2019 Jun 26:2019:2818415.
doi: 10.1155/2019/2818415. eCollection 2019.

New Insights into Chronological Mobility of Retrotransposons In Vivo

Affiliations

New Insights into Chronological Mobility of Retrotransposons In Vivo

Amr R Ghanam et al. Oxid Med Cell Longev. .

Abstract

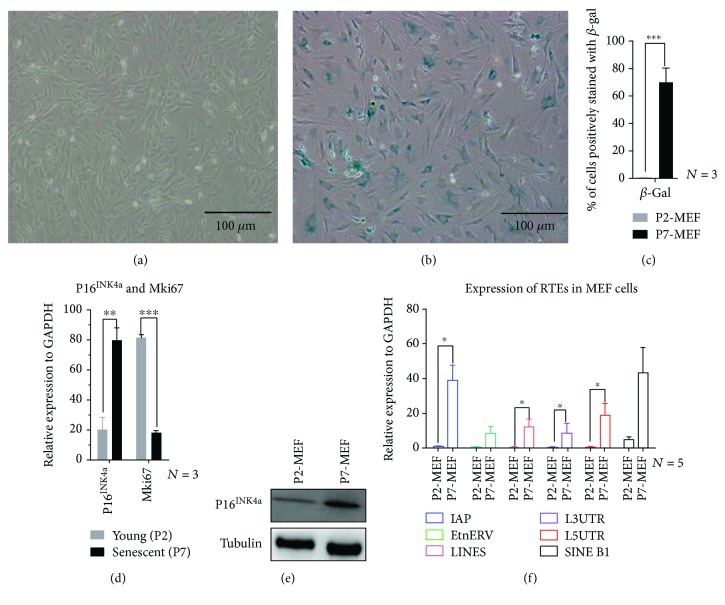
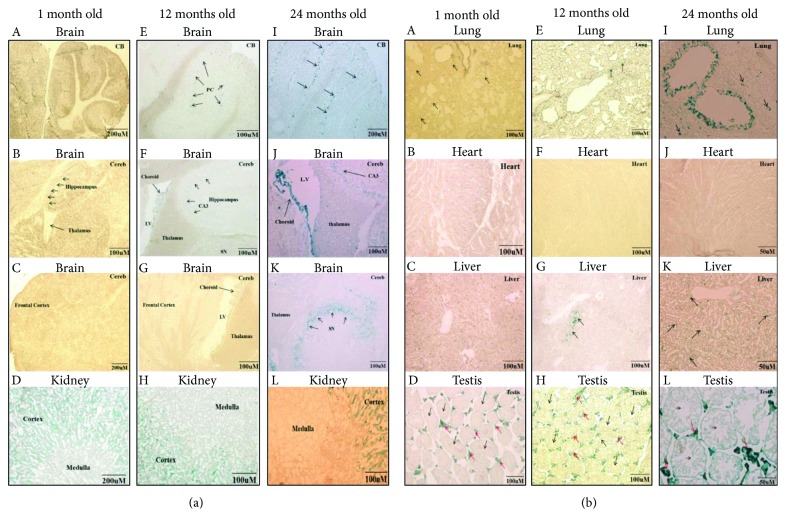
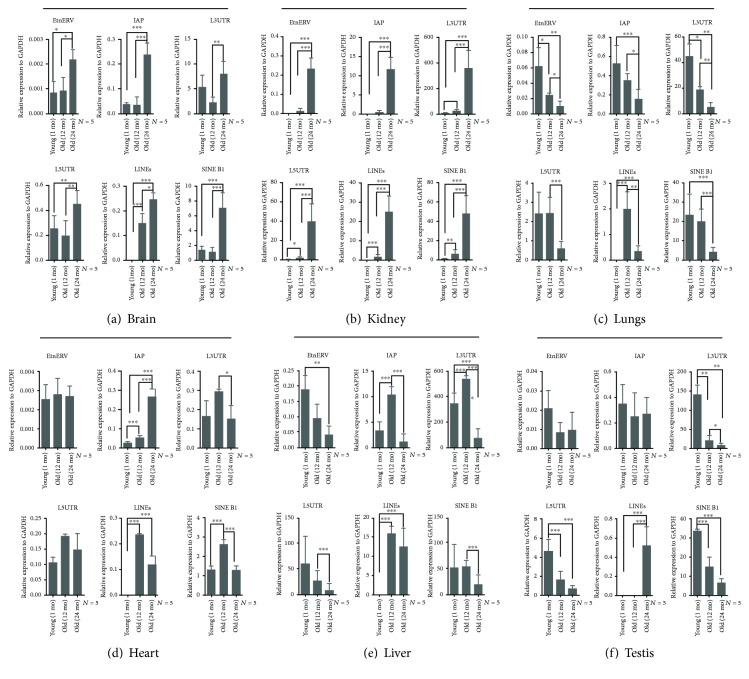
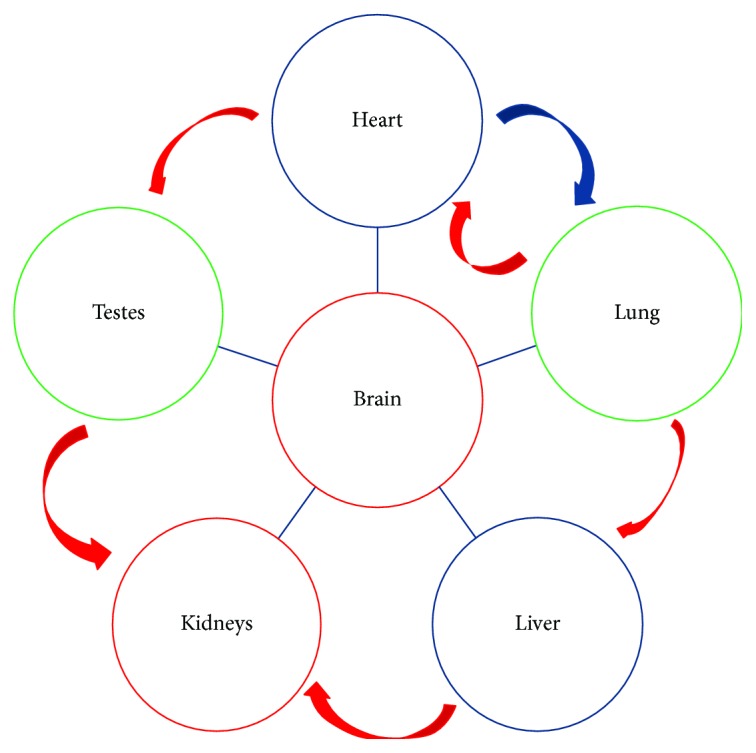
Tissue aging is the gradual decline of physiological homeostasis accompanied with accumulation of senescent cells, decreased clearance of unwanted biological compounds, and depletion of stem cells. Senescent cells were cell cycle arrested in response to various stimuli and identified using distinct phenotypes and changes in gene expression. Senescent cells that accumulate with aging can compromise normal tissue function and inhibit or stop repair and regeneration. Selective removal of senescent cells can slow the aging process and inhibits age-associated diseases leading to extended lifespans in mice and thus provides a possibility for developing antiaging therapy. To monitor the appearance of senescent cells in vivo and target them, a clearer understanding of senescent cell expression markers is needed. We investigated the age-associated expression of three molecular hallmarks of aging: SA-β-gal, P16INK4a, and retrotransposable elements (RTEs), in different mouse tissues during chronological aging. Our data showed that the expression of these markers is variable with aging in the different tissues. P16INK4a showed consistent increases with age in most tissues, while expression of RTEs was variable among different tissues examined. These data suggest that biological changes occurring with physiological aging may be useful in choosing the appropriate timing of therapeutic interventions to slow the aging process or keep more susceptible organs healthier in the aging process.


Figures

Figure 1
Figure 1
Replicative senescence of MEFs. (a, b) SA-β-gal staining of MEFs, comparing young (P2-MEF, in (a)) and senescent (P7-MEF, in (b)). (c) Quantification of β-gal-positive (blue stained) MEFs. (d) mRNA expression level of Mki67 and P16INK4a examined by RT-qPCR. (e) P16INK4a protein level in young and senescent MEFs. β-Tubulin was used as the loading control. (f) RT-qPCR analysis of different classes of RTEs. P ≤ 0.05, ∗∗P ≤ 0.01, and ∗∗∗P ≤ 0.001.
Figure 2
Figure 2
Chronological expression of β-gal in the brain, kidney, lung, liver, heart, and testis. (a) The brain and kidney. A–C: sagittal brain sections at 1 month did not show any positive staining signal. E–G: 12 months showed a few positively stained cells within the cerebellum (CB), where PC indicates Purkinje cells (E), and faintly stained cerebrum (Cereb), CA3 of the hippocampus, and choroid plexus (Choroid) (F). I–K: 24-month-old brain sections showed positive β-gal staining in the cerebellar folia, specifically in Purkinje cells (PC) (I), choroid plexus of the lateral ventricle (LV) (J), and CA3 (J) and substantia nigra (SN) (K). D, H, L: Photomicrographs of kidney cross-sections at different ages (1 month of age in D, 12 months of age in H, and 24 months of age in L) stained with β-gal showed strong signal in the renal cortex at 1 month, 12 months, and 24 months of age, while renal medulla remained unstained. (b) Photomicrographs of lung, liver, heart, and testis sections at different ages (1 month of age in A–D, 12 months of age in E–H, and 24 months of age in I–L) stained with β-gal. A, E, and I showed a few scattered positively stained lung cells that were observed in 1-month-old and 12-month-old lungs (arrows), and a strong signal was detected in old mouse lung bronchi (24 months of age), with a few scattered positive cells located in the alveolar epithelium (arrows). B, E, and J showed that no β-gal-positive staining was observed at any age examined in the heart. C, G, and K showed a few β-gal-positive stained cells in the liver at 12 months and 24 months of age (arrows). D, H, L: Interstitial cells of the testis were strongly positively stained for β-gal (red arrows).
Figure 3
Figure 3
Chronological expression of RTEs (IAP, ERV, L3UTR, L5UTR, LINEs, and SINE B1) in the brain, kidney, lung, liver, heart, and testis. (a) RT-qPCR analysis indicated that all RTEs were significantly upregulated in the aged mouse brain. (b) RT-qPCR analysis of RTEs showing that they were significantly upregulated in aged mouse kidneys. (c) RT-qPCR analysis showed that the RTE expression was significantly downregulated in aged mouse lungs. (d) RT-qPCR analysis of RTEs in the heart showed that only IAP was upregulated, while L3UTR, LINEs, and SINE B1 were downregulated. (e) RT-qPCR analysis of liver RTEs showed that the majority of them were significantly decreased with age. (f) RT-qPCR analysis of RTEs in the testis showed that the majority of them were significantly decreased in aged testes (24 months of age). P ≤ 0.05, ∗∗P ≤ 0.01, and ∗∗∗P ≤ 0.001.
Figure 4
Figure 4
Chronological expression of P16INK4a in different organs. (a) RT-qPCR, of P16INK4a mRNA, in different mouse organs. Significant upregulation was observed in the mouse brain, kidney, and heart. Significant downregulation was observed in testes. No significant changes were observed in the liver or lungs (b–f): P16INK4a protein expression at 1 month (Y), 12 months (M), and 24 months (O) (b) in the brain showed upregulation at M and O compared to Y, (c) in the kidney showed upregulation at M and O compared to Y, (d) in the lungs showed upregulation at M and O compared to Y, (e) in the liver showed downregulation in M and O compared to Y, and (f) in the testis showed upregulation in O compared to Y. The histograms below the panels showed the densitometric mean ± SD normalized to the corresponding level of the loading control protein, β-tubulin (P ≤ 0.05, ∗∗P ≤ 0.01, and ∗∗∗P ≤ 0.001).
Figure 5
Figure 5
Model of organ aging. The model illustrates the center of aging that might be due to changes in the brain and kidney, then followed by the lung and testis. The heart and liver were the least affected organs. Red arrows represent circulating blood, which is filtered by the kidneys. The blue lines represent neurons that connect organs with the brain.

References

    1. Baker D. J., Perez-Terzic C., Jin F., et al. Opposing roles for p16Ink4a and p19Arf in senescence and ageing caused by BubR1 insufficiency. Nature Cell Biology. 2008;10(7):825–836. doi: 10.1038/ncb1744. - DOI - PMC - PubMed
    1. Feser J., Tyler J. Chromatin structure as a mediator of aging. FEBS Letters. 2011;585(13):2041–2048. doi: 10.1016/j.febslet.2010.11.016. - DOI - PMC - PubMed
    1. Brunet A., Berger S. L. Epigenetics of aging and aging-related disease. The Journals of Gerontology Series A: Biological Sciences and Medical Sciences. 2014;69(Supplement 1):S17–S20. doi: 10.1093/gerona/glu042. - DOI - PMC - PubMed
    1. Kennedy B. K., Berger S. L., Brunet A., et al. Geroscience: linking aging to chronic disease. Cell. 2014;159(4):709–713. doi: 10.1016/j.cell.2014.10.039. - DOI - PMC - PubMed
    1. Moskalev A., Aliper A., Smit-McBride Z., Buzdin A., Zhavoronkov A. Genetics and epigenetics of aging and longevity. Cell Cycle. 2014;13(7):1063–1077. doi: 10.4161/cc.28433. - DOI - PMC - PubMed

LinkOut - more resources