. 2019 Nov;46(11):1469-1478.
doi: 10.1007/s10295-019-02192-4. Epub 2019 Jul 25.

Evaluating changes to Ralstonia pickettii in high-purity water to guide selection of potential calibration materials for online water bioburden analyzers

Affiliations

Evaluating changes to Ralstonia pickettii in high-purity water to guide selection of potential calibration materials for online water bioburden analyzers

Kurt D Benkstein et al. J Ind Microbiol Biotechnol. 2019 Nov.

Abstract

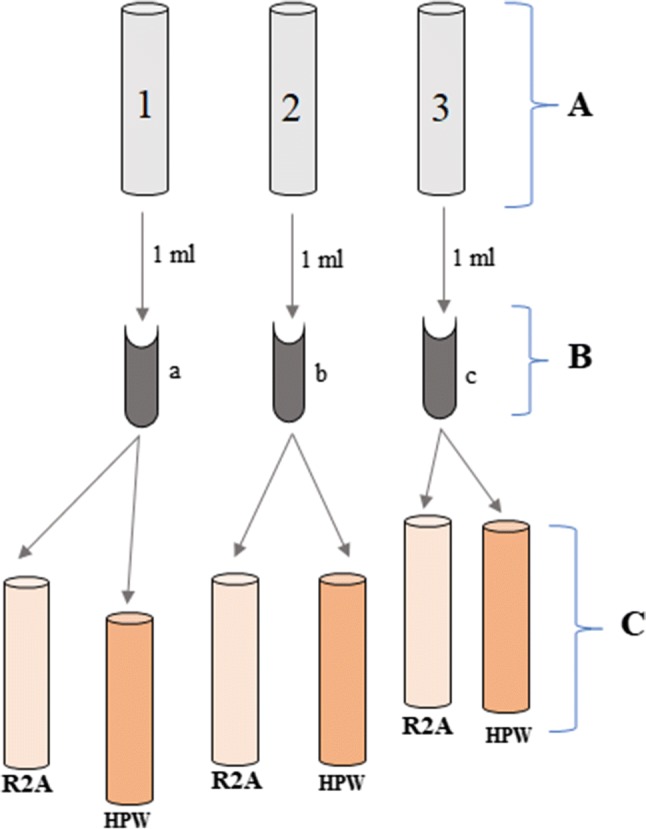
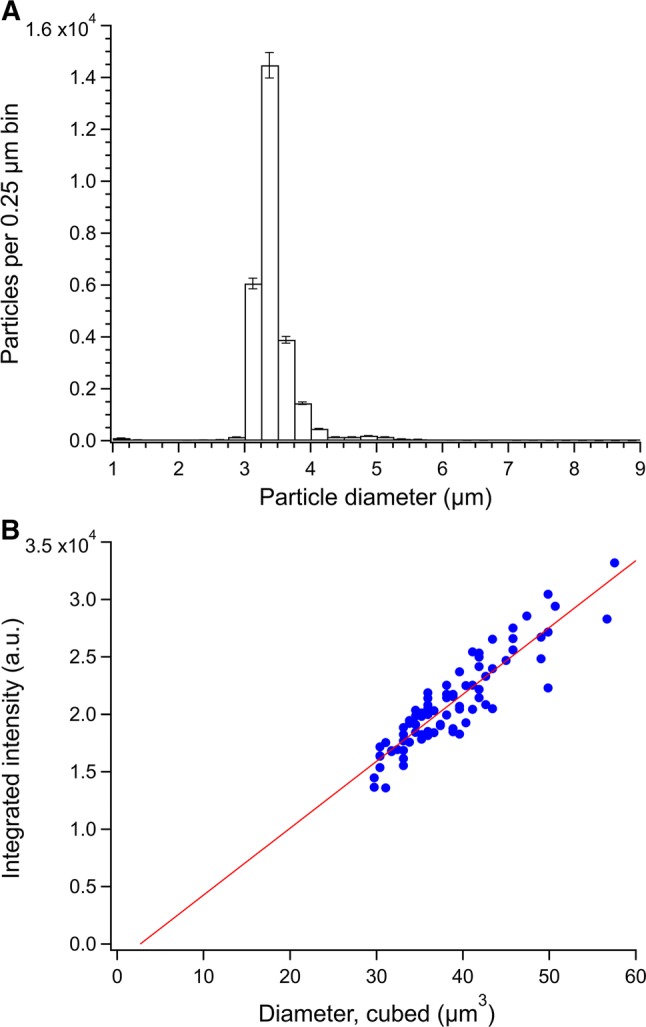
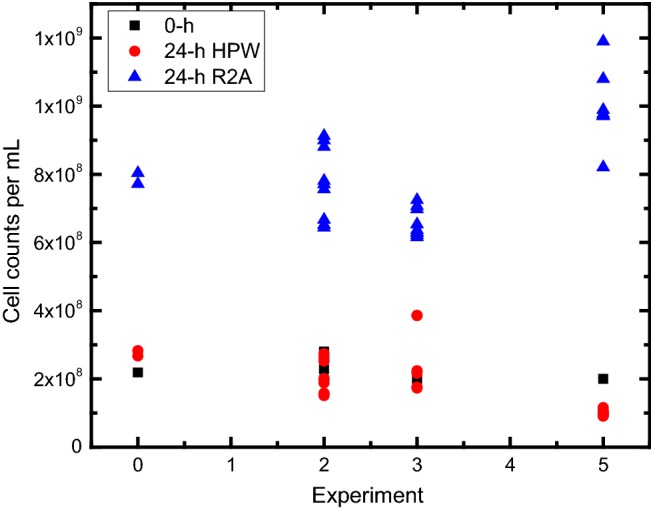
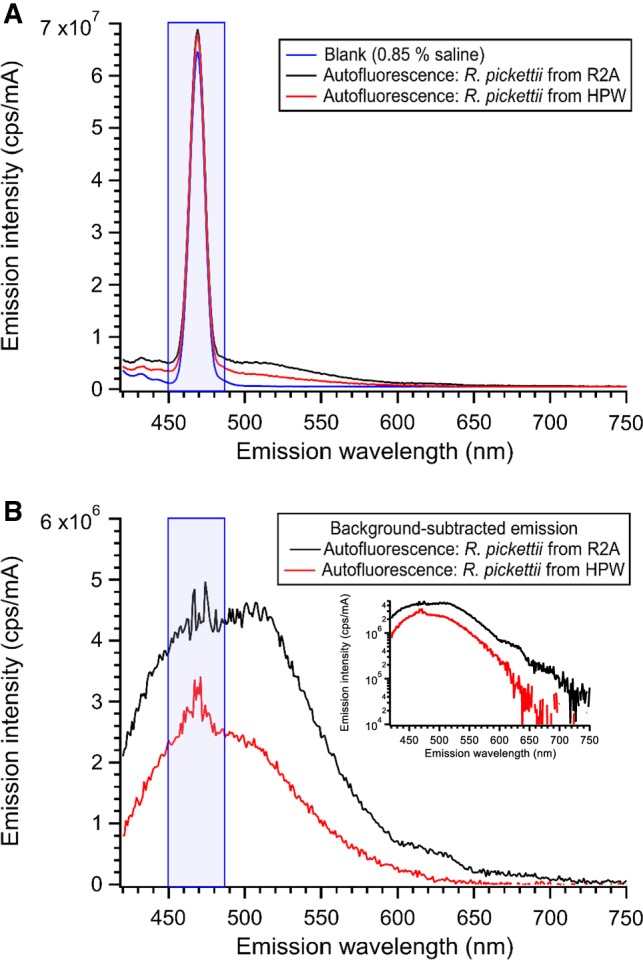
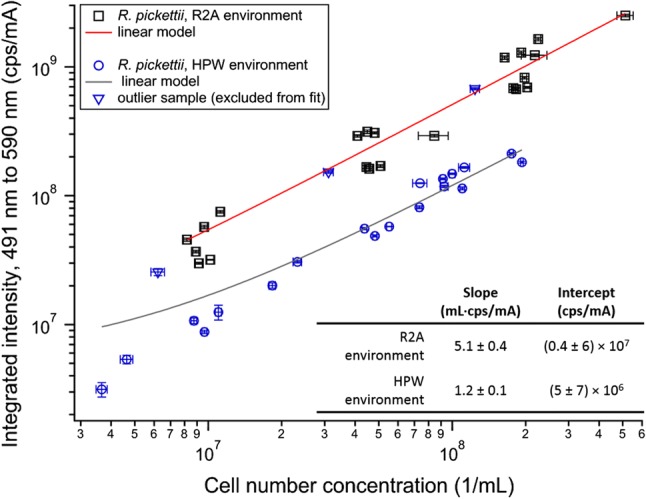
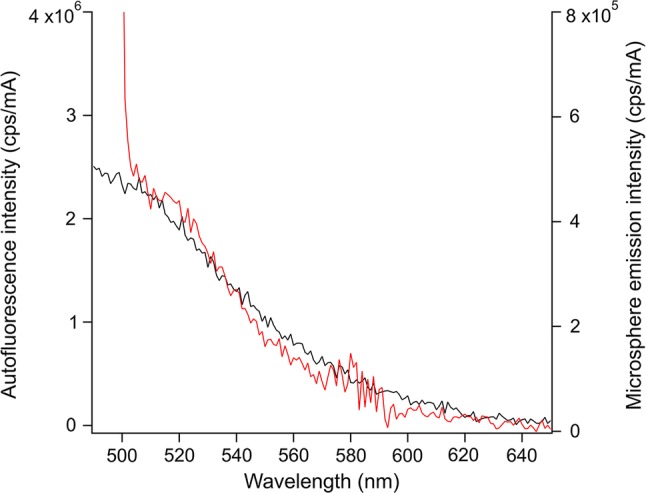
Online water bioburden analyzers (OWBAs) can provide real-time feedback on viable bacteria in high-purity water (HPW) systems for pharmaceutical manufacturers. To calibrate and validate OWBAs, which detect bacteria using scattered light and bacterial autofluorescence, standards are needed that mimic the characteristics of bacteria in HPW. To guide selection of potential standards, e.g., fluorescent microspheres, a relevant bacterial contaminant, Ralstonia pickettii, was characterized for size, count, viability, and autofluorescence after exposure for 24 h to HPW or a nutrient environment. The cells exposed to HPW showed smaller sizes, with lower counts and autofluorescence intensities, but similar spectral features. The cell characteristics are discussed in comparison with a set of fluorescent microspheres, considering factors relevant to OWBAs. These studies suggest that fluorescent microspheres should be relatively small (< 1 µm diameter) and dim, while covering a broad emission range from ≈ (420 to 600) nm to best mimic the representative R. pickettii.

Keywords: Autofluorescence; High-purity water; Online water bioburden analyzers; Ralstonia pickettii; Viability.


Figures

Fig. 1
Fig. 1
Workflow for preparing samples for HPW and R2A. Samples 1, 2 and 3 (biological replicates) were started independently and grown in R2A broth for 24 h (A). One milliliter of each culture was transferred to a new microcentrifuge tube (a–c) and washed twice to remove the broth (rinse step) and determine the initial concentration (B). Samples a–c were then diluted in HPW or R2A to prepare the final test samples (C)
Fig. 2
Fig. 2
Characterization results for fluorescent microspheres. The particle size distribution (a) from flow-imaging microscopy, using 0.25 µm size bins. The error bars represent  × 2 the relative standard uncertainty. The qualitative comparison of fluorescent intensity versus microsphere size (diameter cubed) for n = 83 microspheres (b) as measured by stop-flow microscopy for single, fluorescent particles. The data are well fit by a linear model (red line), which yields a slope of (582.1 ± 30.5) a.u./µm3 and a y-intercept of (–1554 ± 1190) a.u.
Fig. 3
Fig. 3
Cell counts concentration (1/mL) measured by electrical sensing zone analysis to compare cell growth between R2A and HPW after R. pickettii were exposed to these two conditions for 24 h. The graphic also depicts the cell counts concentration at the zero time. Note that both conditions (HPW and R2A had the same initial cell concentration at 0 h)
Fig. 4
Fig. 4
Viability of R. pickettii exposed to HPW at two-time points, zero and 24 h for five separate experiments performed on different days (4 ≤ n ≤ 9). The data suggest that the cells are still viable after 24 h. Pairwise t test indicate that there are statistically significant differences in cell viability only for experiment 1
Fig. 5
Fig. 5
Emission spectra with λex = 405 nm. The water Raman scattering band is highlighted in blue. a Raw emission spectra of a background solution (0.85% saline) and for R. pickettii after exposure to R2A or HPW environments for 24 h. b Background-subtracted emission spectra from 4a for R. pickettii exposed to R2A or HPW. Cell concentration for each is ≈ 9.2 × 107 1/mL. The inset shows the same spectra on a logarithmic y-axis
Fig. 6
Fig. 6
A plot of autofluorescence integrated intensities versus cell concentrations of R. pickettii exposed to R2A or HPW environments. Error bars along the x-axis reflect the standard deviations of the electrical sensing zone measurements (n = 3) and uncertainties associated with the dilutions by pipette. Error bars along the y-axis reflect the standard deviations of the integrated intensities (n = 3 for the primary samples, or 2 for some replicates). Note that error bars may be obscured by the data markers for relatively small error values
Fig. 7
Fig. 7
Emission spectra from R. pickettii exposed to HPW (black, left axis) and from fluorescent microspheres (red, right axis) comparing the spectral profiles and coverage. The spectra have been normalized to cell or microsphere number concentration, as appropriate. The portion of the spectrum for the microspheres for λ < 504 nm is likely an artifact from the relatively wide excitation/emission slits and excitation at λ = 488 nm

References

    1. Adley C, Ryan M, Pembroke J, Saieb FM. Biofilms: persistence and ubiquity. Powys: Biofilm Club; 2005. Ralstoniapickettii: biofilm formation in high-purity water; pp. 261–271.
    1. Alimova A, Katz A, Savage HE, Shah M, Minko G, Will DV, Rosen RB, McCormick SA, Alfano RR. Native fluorescence and excitation spectroscopic changes in Bacillus subtilis and Staphylococcus aureus bacteria subjected to conditions of starvation. Appl Opt. 2003;42:4080–4087. doi: 10.1364/AO.42.004080. - DOI - PubMed
    1. Ammor MS. Recent advances in the use of intrinsic fluorescence for bacterial identification and characterization. J Fluoresc. 2007;17:455–459. doi: 10.1007/s10895-007-0180-6. - DOI - PubMed
    1. Commercial equipment and materials are identified in order to adequately specify certain procedures. In no case does such identification imply recommendation or endorsement by the National Institute of Standards and Technology, nor does it imply that the materials or equipment identified are necessarily the best available for the purpose.
    1. Costerton JW, Stewart PS, Greenberg EP. Bacterial biofilms: a common cause of persistent infections. Science. 1999;284:1318. doi: 10.1126/science.284.5418.1318. - DOI - PubMed

Publication types