

Network analysis of prospective brain development in youth with benign epilepsy with centrotemporal spikes and its relationship to cognition
- PMID: 31347155
- PMCID: PMC7394051
- DOI: 10.1111/epi.16290
Network analysis of prospective brain development in youth with benign epilepsy with centrotemporal spikes and its relationship to cognition
Abstract
Objective: Benign epilepsy with centrotemporal spikes (BECTS) is the most common childhood idiopathic localization-related epilepsy syndrome. BECTS presents normal routine magnetic resonance imaging (MRI); however, quantitative analytic techniques have captured subtle cortical and subcortical magnetic resonance anomalies. Network science, including graph theory (GT) analyses, facilitates understanding of brain covariance patterns, potentially informing in important ways how this common self-limiting epilepsy syndrome may impact normal patterns of brain and cognitive development.
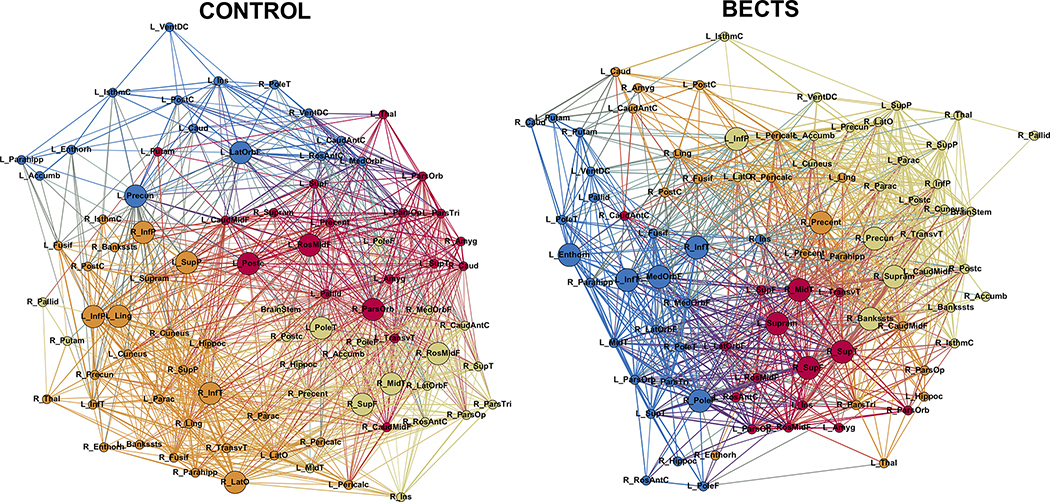
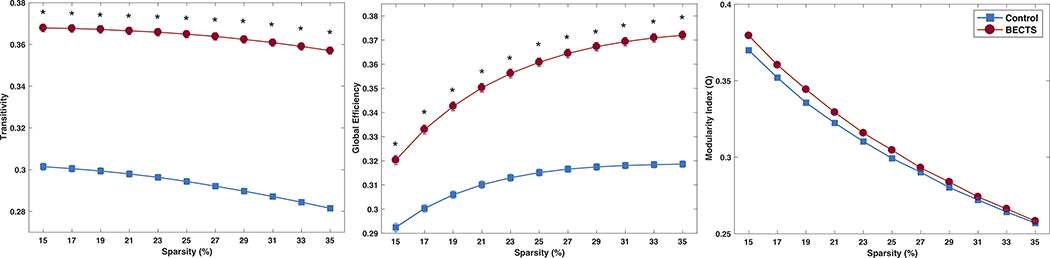
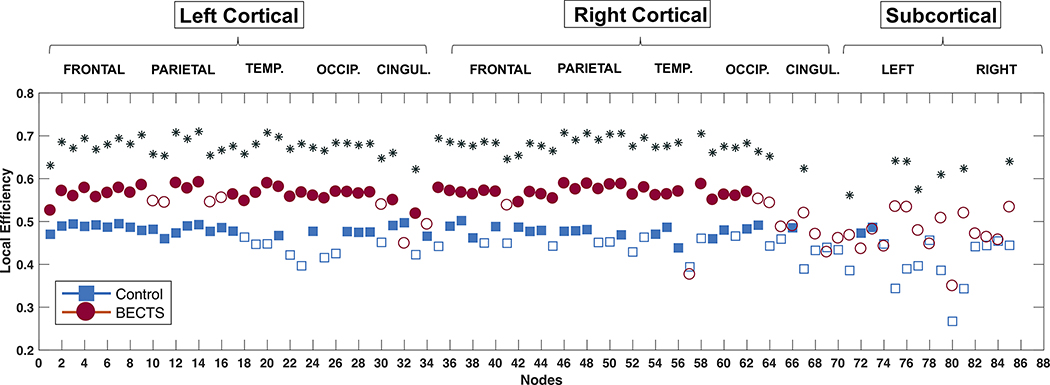
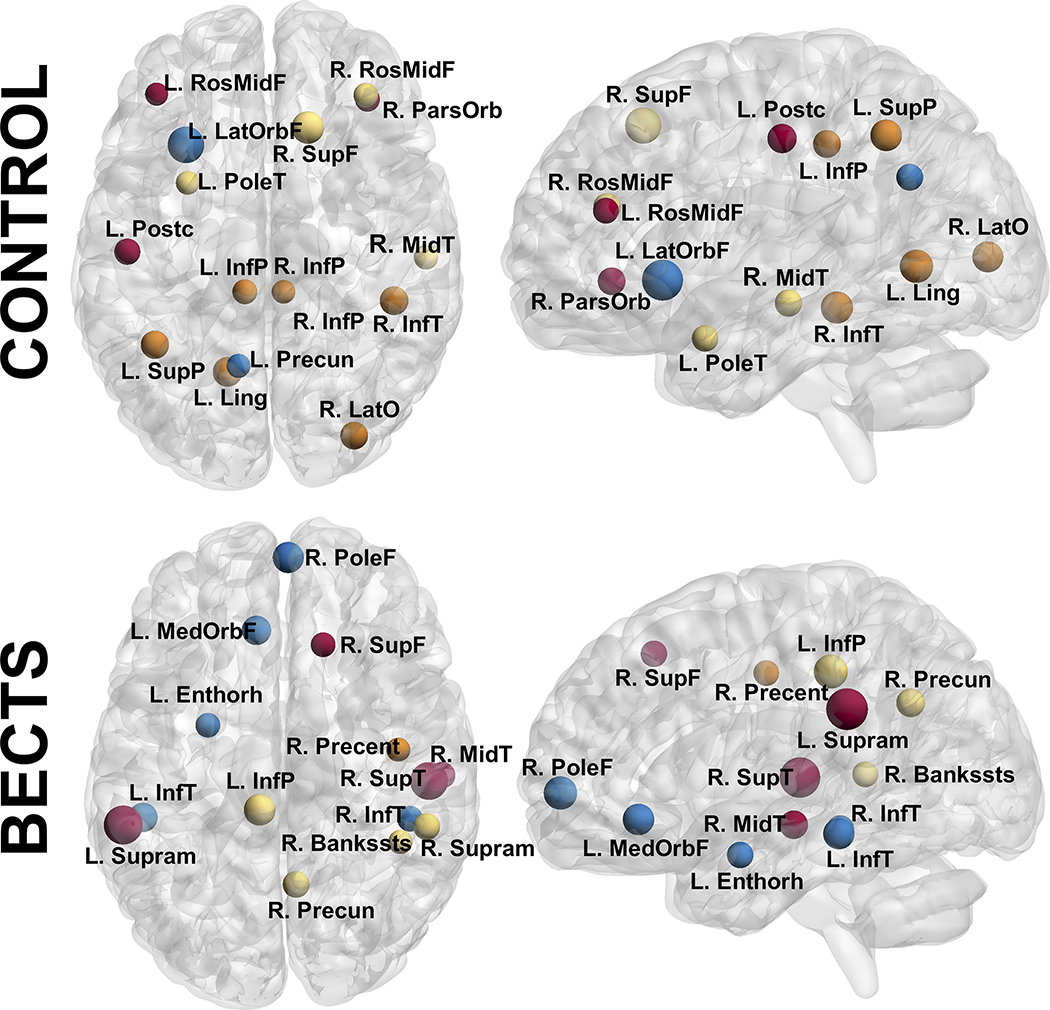
Methods: GT analyses examined the developmental covariance among cortical and subcortical regions in children with new/recent onset BECTS (n = 19) and typically developing healthy controls (n = 22) who underwent high-resolution MRI and cognitive assessment at baseline and 2 years later. Global (transitivity, global efficiency, and modularity index [Q]) and regional measures (local efficiency and hubs) were investigated to characterize network development in each group. Associations between baseline-based GT measures and cognition at both time points addressed the implications of GT analyses for cognition and prospective cognitive development. Furthermore, an individual contribution measure was investigated, reflecting how important for cognition it is for BECTS to resemble the correlation matrices of controls.
Results: Groups exhibited similar Q and overall network configuration, with BECTS presenting significantly higher transitivity and both global and local efficiency. Furthermore, both groups presented a similar number of hubs, with BECTS showing a higher number in temporal lobe regions compared to controls. The investigated measures were negatively associated with 2-year cognitive outcomes in BECTS.
Significance: Children with BECTS present a higher-than-normal global developmental configuration compared to controls, along with divergence from normality in terms of regional configuration. Baseline GT measures demonstrate potential as a cognitive biomarker to predict cognitive outcome in BECTS 2 years after diagnosis. Similarities and differences in developmental network configurations and their implications for cognition and behavior across common epilepsy syndromes are of theoretical interest and clinical relevance.
Keywords: Rolandic epilepsy; benign epilepsy with centrotemporal spikes; brain volume development; cognition; graph theory.
Wiley Periodicals, Inc. © 2019 International League Against Epilepsy.
Conflict of interest statement
Disclosure
“Neither of the authors has any conflict of interest to disclose.”
Figures
Similar articles
-
Cognition and brain development in children with benign epilepsy with centrotemporal spikes.Epilepsia. 2015 Oct;56(10):1615-22. doi: 10.1111/epi.13125. Epub 2015 Sep 4. Epilepsia. 2015. PMID: 26337046 Free PMC article.
-
Systematically altered connectome gradient in benign childhood epilepsy with centrotemporal spikes: Potential effect on cognitive function.Neuroimage Clin. 2024;43:103628. doi: 10.1016/j.nicl.2024.103628. Epub 2024 Jun 2. Neuroimage Clin. 2024. PMID: 38850833 Free PMC article.
-
Sub-cortical brain morphometry and its relationship with cognition in rolandic epilepsy.Epilepsy Res. 2017 Dec;138:39-45. doi: 10.1016/j.eplepsyres.2017.09.007. Epub 2017 Oct 7. Epilepsy Res. 2017. PMID: 29055263
-
ADHD and ADHD-related neural networks in benign epilepsy with centrotemporal spikes: A systematic review.Epilepsy Behav. 2020 Nov;112:107448. doi: 10.1016/j.yebeh.2020.107448. Epub 2020 Sep 21. Epilepsy Behav. 2020. PMID: 32916583
-
"Atypical forms" of benign epilepsy with centrotemporal spikes (BECTS): How to diagnose and guide these children. A practical/scientific approach.Epilepsy Behav. 2017 Oct;75:165-169. doi: 10.1016/j.yebeh.2017.08.001. Epub 2017 Sep 1. Epilepsy Behav. 2017. PMID: 28866336 Review.
Cited by
-
Connectivity increases during spikes and spike-free periods in self-limited epilepsy with centrotemporal spikes.Clin Neurophysiol. 2022 Dec;144:123-134. doi: 10.1016/j.clinph.2022.09.015. Epub 2022 Oct 7. Clin Neurophysiol. 2022. PMID: 36307364 Free PMC article.
-
The relationship between neuromagnetic networks and cognitive impairment in self-limited epilepsy with centrotemporal spikes.Epilepsia Open. 2025 Jun;10(3):842-854. doi: 10.1002/epi4.70044. Epub 2025 Apr 15. Epilepsia Open. 2025. PMID: 40231835 Free PMC article.
-
Network phenotypes and their clinical significance in temporal lobe epilepsy using machine learning applications to morphological and functional graph theory metrics.Sci Rep. 2022 Aug 24;12(1):14407. doi: 10.1038/s41598-022-18495-z. Sci Rep. 2022. PMID: 36002603 Free PMC article.
-
The relationship between epilepsy and cognitive function in benign childhood epilepsy with centrotemporal spikes.Brain Behav. 2020 Dec;10(12):e01854. doi: 10.1002/brb3.1854. Epub 2020 Sep 22. Brain Behav. 2020. PMID: 32959999 Free PMC article.
-
The relevance of Spearman's g for epilepsy.Brain Commun. 2024 Jun 12;6(3):fcae176. doi: 10.1093/braincomms/fcae176. eCollection 2024. Brain Commun. 2024. PMID: 38883806 Free PMC article.
References
-
- Panayiotopoulos CP. A Clinical Guide to Epileptic Syndromes and their Treatment: Based on the New ILAE Diagnostic Scheme. Bladon Medical Pub., Oxfordshire, UK; 2002.
-
- Larsson K, Eeg-Olofsson O. A population based study of epilepsy in children from a Swedish county. Eur J Paediatr Neurol. 2006;10:107–13. - PubMed
-
- Astradsson A, Olafsson E, Ludvigsson P, et al. Rolandic epilepsy: An incidence study in Iceland. Epilepsia. 1998;39:884–86. - PubMed
-
- Sidenvall R, Forsgren L, Heijbel J. Prevalence and characteristics of epilepsy in children in northern Sweden. Seizure. 1996;5:139–46. - PubMed
-
- Wickens S, Bowden SC, D’Souza W. Cognitive functioning in children with self-limited epilepsy with centrotemporal spikes: A systematic review and meta-analysis. Epilepsia. 2017;58:1673–1685. - PubMed
Publication types
MeSH terms
Grants and funding
LinkOut - more resources
Full Text Sources
Miscellaneous
