

TAK1 converts Sequestosome 1/p62 from an autophagy receptor to a signaling platform
- PMID: 31347268
- PMCID: PMC6726904
- DOI: 10.15252/embr.201846238
TAK1 converts Sequestosome 1/p62 from an autophagy receptor to a signaling platform
Abstract
The protein p62/Sequestosome 1 (p62) has been described as a selective autophagy receptor and independently as a platform for pro-inflammatory and other intracellular signaling. How these seemingly disparate functional roles of p62 are coordinated has not been resolved. Here, we show that TAK1, a kinase involved in immune signaling, negatively regulates p62 action in autophagy. TAK1 reduces p62 localization to autophagosomes, dampening the autophagic degradation of both p62 and p62-directed autophagy substrates. TAK1 also relocalizes p62 into dynamic cytoplasmic bodies, a phenomenon that accompanies the stabilization of TAK1 complex components. On the other hand, p62 facilitates the assembly and activation of TAK1 complexes, suggesting a connection between p62's signaling functions and p62 body formation. Thus, TAK1 governs p62 action, switching it from an autophagy receptor to a signaling platform. This ability of TAK1 to disable p62 as an autophagy receptor may allow certain autophagic substrates to accumulate when needed for cellular functions.
Keywords: HIV-1; TLR3; TRIM5α; anti-inflammatory; tripartite motif.
© 2019 The Authors.
Conflict of interest statement
The authors declare that they have no conflict of interest.
Figures

High content imaging of the effects of pp242 treatment on the number of p62 bodies per cell under basal and pp242‐induced conditions. HeLa cells were treated with pp242 for 1 h prior to fixation and staining with anti‐p62. White mask, cell boundary. Yellow mask, automatically identified p62 bodies. Scale bar, 10 μm. Plots show two readouts of the abundance of p62 bodies per cell: the number of p62 bodies and the total cross‐sectional area of coalesced p62 (body area).
High content imaging of the effects of pp242 treatment on the area of ubiquitin puncta per cell. HeLa cells were treated or not for 1 h with pp242 and stained with anti‐multi‐ubiquitin (red) and anti‐p62 (green). White mask, cell boundary. Red mask, automatically identified ubiquitin puncta; green mask, p62 bodies; scale bar, 10 μm. Plots, quantitation of images for the number of ubiquitin (left) or p62 (right) puncta per cell.
The effect of TBK1 inhibitor BX795 (BX) on pp242‐induced p62 bodies as determined by high content imaging.
The effect of ULK1 knockdown on the ability of pp242 to induce p62 bodies. Immunoblot shows ULK1 knockdown efficiency.
Top, immunoblot showing TAK1 knockdown efficiency in HeLa cells corresponding to Fig 1A. Bottom, plot showing the effect of TAK1 knockdown on p62 protein levels in HeLa cells under basal (full media) conditions. Data points represent independent biological replicates.
The effect of TAK1 knockdown on p62 bodies formed in HeLa cells in response to a 4 h treatment with calcium phosphate precipitates (CPP) or puromycin (Puro.). White mask, cell boundary. Yellow mask, automatically identified p62 bodies. Scale bar, 10 μm.
Analysis of images as in (F).
Immunoblot showing ATG7, UBC13, and TRAF6 knockdown efficiency in HeLa cells corresponding to Fig 1E.
The effect of knocking down the indicated proteins on p62 body formation. HeLa cells were subjected to the indicated siRNA and treated with pp242 for 1 h prior to fixation and anti‐p62 staining. p62 body formation was observed via high content imaging and the average area of p62 bodies per cell shown in the graph.

- A
High content imaging of p62 in HeLa cells subjected to control or TAK1 siRNA and stimulated or not with pp242 for 1 h. White mask, cell boundary. Yellow mask, automatically identified p62 bodies. Scale bar, 10 μm. Immunoblots showing knockdown efficiency are shown in Fig EV1E.
- B–D
High content microscopic analysis of the effect of TAK1 or p62 knockdown on the formation of ubiquitin puncta in response to puromycin treatment. HeLa cells were subjected to control or TAK1 knockdown prior to being treated for 2 h with puromycin. Cells were then stained with anti‐multi‐ubiquitin (green) and anti‐p62 (red), and imaged with the abundance of ubiquitin puncta and p62 bodies per cell determined by automated image analysis. Scale bar, 10 μm. The number of ubiquitin puncta (C) and p62 bodies (D) per cell was determined by image analysis.
- E
The effect of knocking down TAK1 upstream factors UBC13 and TRAF6 on p62 body formation in HeLa cells under basal conditions. Cells were subjected to the indicated knockdowns, stained with anti‐p62, and images acquired by high content microscopy. Scale bar, 10 μm. Quantitation of analyzed images is shown in the plot to the right. Immunoblots showing knockdown efficiency are shown in Fig EV1H.
- F
The effect of selective TAK1 inhibitor (5Z)‐7‐oxozeaenol (5Z) on the abundance of p62 bodies in HeLa cells treated or not with pp242 for 1 h as determined by high content imaging and analysis.
- G
The effect of GFP‐TAK1 expression on the abundance of p62 bodies in HeLa cells. Cells were transfected with GFP‐TAK1 or GFP alone, stained with anti‐p62, and the abundance of p62 bodies was determined by high content imaging. Scale bar, 10 μm.
- H
Immunoblot analysis of the effect of TAK1 knockdown on the abundance of p62 phosphorylated at serine 403. Numbers indicate the relative abundance of phospho‐p62 normalized to actin loading control.
- I, J
Phospho‐proteomic analysis of immunoprecipitated FLAG‐p62 from lysates of HEK293T cells expressing GFP‐TAK1 or GFP alone. Data shown indicate the intensity of phospho‐peptide peaks at p62 Ser24 (I) or Ser226 (J). The total abundance of p62 in the samples was determined to be equivalent (see Materials and Methods); thus, no further normalization was needed.

- A
High content image analysis of colocalization between GFP‐TAK1 and endogenous p62 in HeLa cells. White mask, cell boundary. Yellow mask, automatically identified regions showing overlap between GFP‐TAK1 and p62 puncta. Scale bar, 10 μm.
- B
Confocal microscopic analysis of colocalization between GFP‐TAK1 and endogenous p62 in HeLa cells. A zoomed‐in view of the contents of the boxed region is shown in the inset. Scale bar, 5 μm.
- C–E
High content imaging‐based analysis of the abundance of p62 bodies (D) and their colocalization with GFP‐positive profiles (E) in HeLa cells transfected as indicated and showing positivity for GFP signal. Representative images (C) show automatically identified cells showing GFP positivity (white mask). Left panels show p62 localization, right panels show p62 (red), GFP (green), and DNA (blue). Scale bar, 10 μm.
- F
The effect of GFP‐TAK1 expression on the abundance of phospho‐p62. Lysates from HEK293T cells expressing FLAG‐p62 and GFP‐TAK1 or GFP alone were subjected to immunoblotting with the indicated antibodies. Plot shows the fold increase in phospho‐p62 levels relative to what is seen in cells expressing GFP alone.
- G
The effect of WT or kinase‐dead (K63W) GFP‐TAK1 expression on the abundance of phospho‐p62 (pThr269/pSer272) in transfected HEK293T cells. Plot shows the abundance of phospho‐p62 relative to actin loading control.
- H
Representative peptide spectrum from mass spectroscopy showing double phosphorylation of p62 between amino acids 266 and 277.
- I
The effect of TAK1 knockdown on the ability of FLAG‐p62 to immunoprecipitate mCherry‐p62 in HEK293T cells.
- J
The effect of TAK1 knockdown on the ability of HA‐ubiquitin (UBQ) to immunoprecipitate mCherry‐p62 in transfected HEK293T cells.

- A, B
The effect of TAK1 knockdown on the abundance of autophagy substrates p62 and NBR1 under induced autophagy conditions. HeLa cells were subjected to control or TAK1 knockdown and subjected to amino acid starvation for 4 h in the presence or absence of autophagy inhibitor bafilomycin A1 (BafA1) prior to lysis and immunoblotting with the indicated antibodies. The relative abundance of p62 or NBR1 following normalization to an actin loading control is shown in (B), and points show data from independent biological replicates.
- C, D
The effect of WT or kinase‐dead TAK1 expression on the autophagic degradation of p62. HEK293T cells were transfected with the indicated plasmids and then treated or not with bafilomycin A1 (BafA1) for 3 h under amino acid starvation conditions. Relative p62 levels were normalized to actin loading control and plotted in (D). Data points show results from independent biological replicates.
- E
Co‐immunoprecipitation analysis of interactions between FLAG‐p62 and LC3B from lysates of transfected HEK293T cells.
- F
High content imaging‐based analysis of LC3B positivity of cytoplasmic structures identified as p62+GFP‐TAK1+ or p62+GFP‐TAK1negative in transfected HeLa cells. See also Fig EV3D and E.

- A
The effect of TAK1 over‐expression on p62 protein levels in HEK293T cells. Cells were transfected with GFP‐p62 and either FLAG‐TAK1 or empty vector prior to lysis and immunoblotting with anti‐GFP and anti‐FLAG. Plot, quantitation of the abundance of GFP‐p62 relative to actin as determined by densitometry.
- B
qPCR analysis of the effect of TAK1 expression on the abundance of p62 mRNA. Total RNA was harvested from HEK293T cells transfected with GFP‐TAK1 or GFP alone and subjected to amino acid starvation for 3 h.
- C
Co‐IP analysis of the effect of WT or kinase‐dead (K63W) TAK1 expression on p62‐LC3B complex formation in HEK293T cells.
- D, E
Confocal microscopic analysis GFP‐TAK1, p62, and LC3B in HeLa cells. Panel (E) shows the fluorescence intensity profile along the transect (red arrow) of the cell shown in (D). Notably, extensive colocalization is seen between red (p62) and green (GFP‐TAK1) profiles and between red and blue (LC3B) profiles, but not between green and red profiles. Scale bar in panel (D), 5 μm.
- F, G
Time course of the effects of pp242 treatment on the abundance of LC3B puncta (F) and either punctate or total p62 (G) showing the fold increase in signal relative to what was seen in unstimulated control cells. HeLa cells were treated with pp242 or DMSO vehicle for the indicated times prior to fixation, staining, and high content imaging. Total p62 was determined by measuring the total fluorescent anti‐p62 signal per cell.

- A
Co‐immunoprecipitation analysis of interactions between mCherry‐p62 and GFP‐TAB2 from lysates of transfected HEK293T cells treated or not with pp242 for 1 h.
- B
Co‐immunoprecipitation analysis of interactions between mCherry‐p62 and GFP‐TAB2 from lysates of transfected HEK293T cells subjected to either control or UBC13 siRNA and treated with pp242 for 1 h.
- C, D
Co‐immunoprecipitation analysis of the p62 domains required for binding to TAK1. HEK293T cells were transfected with GFP alone, GFP‐p62 WT, or domain deletions (C, left) and FLAG‐TAK1 and treated with pp242 for 1 h prior to cell lysis and immunoprecipitation with anti‐GFP (D). GFP‐p62 constructs showing robust binding to TAK1 or TAB2 are indicated with a “+”, marginal binding is indicated with “+/−”, and no binding indicated with “−” (C, right).
- E
Confocal microscopic analysis of colocalization between GFP‐TAK1, mCherry‐TAB2, and endogenous p62 in HeLa cells. Inset shows a zoomed‐in image of the region inside the dash‐lined box. Scale bar, 5 μm.

HeLa cells were transfected with GFP‐tagged TAB2 and treated with pp242 for 40 min prior to fixation and immunostaining with anti‐p62 and confocal microscopy. Inset shows magnified images of the boxed region. Scale bar, 5 μm.
Effect of UBC13 knockdown on the interaction between endogenous p62 and TAB2 from HeLa cell lysates.
Effect of UBC13 knockdown on the interaction between GFP‐TAK1 and mCherry‐p62 as determined by co‐immunoprecipitation using anti‐GFP from transfected HEK293T cell lysates treated with pp242 for 40 min.
Co‐immunoprecipitation analysis of interactions between FLAG‐tagged TAK1 and GFP‐tagged p62, p62 PB1 domain, or GFP alone from lysates of transfected HEK293T cells treated with pp242 for 40 min.
Co‐immunoprecipitation analysis of p62 domains involved in binding to TAB2 from cell lysates of transiently transfected HEK293T cells treated with pp242 for 1 h.
FRAP analysis of GFP‐TAK1 puncta in HeLa cells. Micrographs show two representative regions of interest containing GFP‐TAK1 puncta prior to photobleaching and during the recovery period. Plot shows the relative fluorescence intensity of GFP‐TAK1 puncta (N = 134) at different time points before and after bleaching. Scale bar, 5 μm. Data, mean ± SEM.

Confocal microscopic analysis of colocalization between GFP‐TAK1, p62, and LC3B in HeLa cells. Inset shows an enlarged image of the region bounded by the dashed lines. Arrow, punctum showing positivity for GFP‐TAK1, p62, and LC3B signals. Scale bar, 5 μm.
Tandem fluorescence analysis of TAK1 localization to acidified compartments in cells. mCherry‐eGFP‐TAK1 was expressed in HeLa cells and analyzed by confocal microscopy. Intensity profile shows the “red” and “green” intensity of each pixel in the image. Lassoed area shows pixels with high red but low green pixel intensities, suggesting lysosomal localization. Scale bar, 5 μm.
The effect of the indicated knockdowns on TAK1 and TAB2 abundance in HeLa cells. Following knockdown, cells were cultured under amino acid starvation conditions in the presence or absence of bafilomycin A1 (BafA1) for 3 h. Plots indicate the abundance of TAK1 and TAB2 relative to actin with data points representing independent biological replicates.
HeLa cells were transfected with GFP‐p62 or GFP alone, fixed, and stained with anti‐p62. Left, representative image of cells expressing GFP or GFP‐p62. Blue mask, cell outline. Yellow mask, p62 bodies. Scale bar, 10 μm. Plot, high content imaging and analysis were used to determine the fluorescence intensity specifically from coalesced p62 (bodies) or the total anti‐p62 fluorescence intensity, which is the sum of anti‐p62 intensity from diffuse and coalesced p62. Whereas coalesced p62 contributes ˜50% of the anti‐p62 intensity in GFP expressing cells, coalesced p62 contributes ˜80% of the anti‐p62 signal in GFP‐p62 expressing cells.
Effect of p62 over‐expression on the abundance of FLAG‐tagged TAK1 in HEK293T cells.
Representative confocal microscopic images of the localization pattern of WT GFP‐p62 and of ΔPB1 GFP‐p62. Scale bar, 5 μm.
Co‐immunoprecipitation analysis of the effect of p62 knockdown on the interaction between TAK1 or TAB2 and ubiquitin in HEK293T cell lysates.
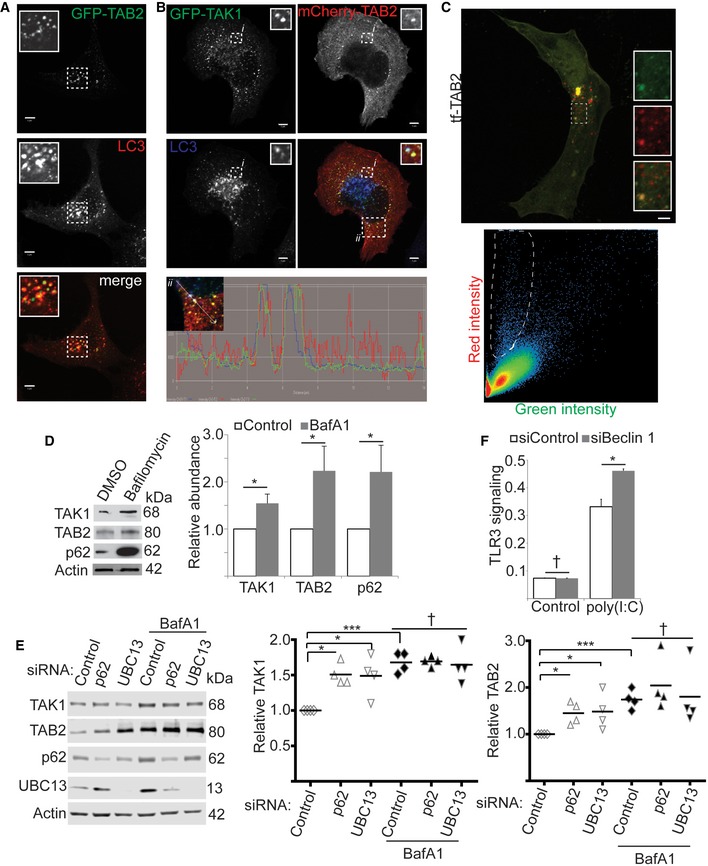
Confocal microscopic analysis of colocalization between GFP‐TAB2 and autophagosome marker LC3B in HeLa cells treated with pp242 for 1 h. Inset shows a zoomed‐in image of the region inside the dash‐lined box. Scale bar, 5 μm.
Triple colocalization analysis of GFP‐TAK1, mCherry‐TAB2, and LC3B in HeLa cells treated with pp242 for 1 h. Boxed region ii is shown in intensity profile below. A zoomed‐in view of the contents of boxed region i is shown in the inset. Scale bar, 5 μm.
Tandem fluorescence analysis of TAB2 localization to acidified compartments in cells under basal autophagy conditions. mCherry‐eGFP‐TAB2 was expressed in HeLa cells and analyzed by confocal microscopy (top). Bottom, the “red” and “green” intensity of each pixel in the image are plotted. Lassoed area shows pixels with high red but low green pixel intensities, suggesting lysosomal localization. Scale bar, 5 μm.
Effect of bafilomycin A1 (BafA1) treatment on the levels of the indicated proteins. HeLa cells were treated with Baf A1 or DMSO vehicle for 4 h under amino acid starvation conditions prior to cell lysis and immunoblotting. Graph indicates the relative abundance of each protein as determined by densitometry using actin as a loading control and normalizing to DMSO.
The effect of p62 or UBC13 knockdown on the abundance of TAK1 and TAB2 in HeLa cells subjected to amino acid starvation and treated or not with bafilomycin A1 (BafA1) for 4 h. Graphs indicate the relative abundance of TAK1 or TAB2 as determined by densitometry with data points representing independent biological replicates.
The effect of autophagy inhibition by Beclin 1 knockdown on signaling through the TLR3/TAK1 axis. TLR3 reporter cells were transfected with control siRNA or siRNA targeting Beclin 1 and treated or not with 1 μg ml−1 poly(I:C) overnight prior to determining the abundance of a chromogenic substrate. Shown, one representative experiment out of five.

- A
The effect of p62 over‐expression on endogenous TAK1 protein levels in HEK293T cells. Cells were transfected with either mCherry‐p62 or mCherry alone prior to lysis and immunoblotting with the indicated antibodies. Graph shows the relative abundance of TAK1 relative to actin loading control.
- B
The effect of p62 body‐deficient mutant ΔPB1 on the abundance of TAK1 in transiently transfected HEK293T cells. Plot, quantitation of the abundance of FLAG‐TAK1 as determined by densitometry relative to actin, data points each represent independent biological replicates.
- C
siRNA screen of TRIM E3 ligases for roles in pp242‐induced p62 body formation in HeLa cells. Numbers indicate TRIM knockdowns that changed the abundance of p62 bodies by > 3 SD (black lines) from cells transfected with control siRNA (black diamonds, left) in two out of two experiments. LC3B, knockdown of LC3B. Shown, one representative experiment out of two. All “hits” shown were also “hits” in the other experiment.
- D
High content imaging and analysis of p62 bodies in HeLa cells subjected to control or TRIM5α knockdown under pp242‐induced (1 h) conditions. White mask, cell outline; yellow mask, p62 bodies. Scale bar, 10 μm.
- E
The effect of TRIM5α knockdown on the abundance of the indicated proteins. Following control or TRIM5α knockdown, cells were starved and treated or not with bafilomycin A1 (BafA1) for 4 h prior to lysis and immunoblotting. Plot shows the abundance of the indicated proteins relative to actin.
- F, G
The effect of HIV‐1 capsid on p62 coalescence and the abundance of TAK1, TAB2, and p62 in HeLa cells stably expressing RhTRIM5α‐HA. Cells were exposed to VSV‐G‐pseudotyped HIV‐1 (NL43 strain) for 1 h at 4°C and then 3 h at 37°C prior to being fixed and prepared for high content imaging of p62 bodies (F) or lysis and immunoblotting with the indicated antibodies (G).
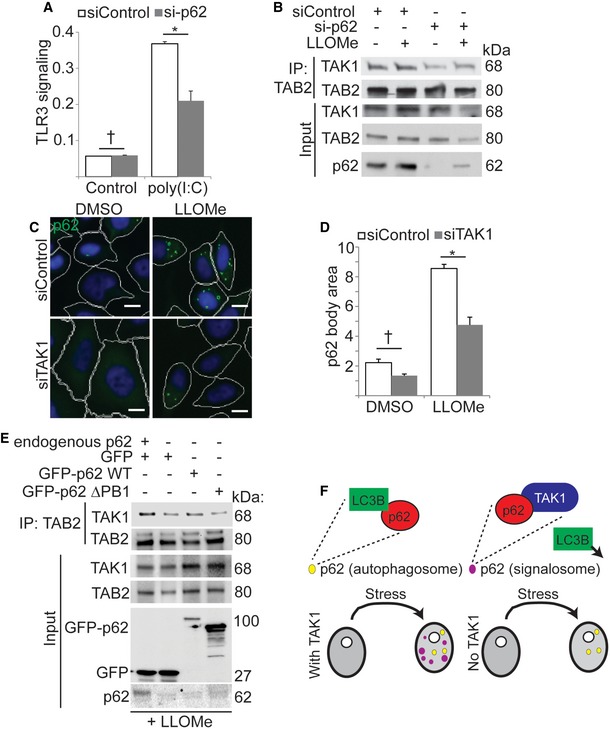
- A
The effect of p62 knockdown on signaling through the TLR3/TAK1 axis. TLR3 reporter cells were transfected with p62 or non‐targeting control siRNA and treated or not with 1 μg ml−1 poly(I:C) overnight prior to determining the abundance of a chromogenic substrate. Shown, one representative experiment out of four.
- B
Co‐immunoprecipitation analysis of the effect of p62 knockdown on the formation of active TAK1 complexes in control HEK293T cells and in cells treated with LLOMe for 1 h.
- C, D
High content imaging‐based analysis of the effect of TAK1 knockdown on LLOMe‐induced p62 bodies. HeLa cells were transfected with control or TAK1 siRNA prior to 1 h treatment with LLOMe. White mask, cell outline; green mask, p62 body; scale bar, 10 μm.
- E
Co‐immunoprecipitation analysis of the effect of wild type or ΔPB1 p62 expression on the interaction between TAK1 and TAB2. Control or p62 knockout HEK293T was transfected with GFP or GFP‐tagged p62 as indicated and treated with LLOMe for 1 h prior to lysis and immunoprecipitation with anti‐TAB2.
- F
Model of p62 and TAK1 coregulation. Top: p62 puncta in cells include autophagosomes (LC3B‐positive) and signalosomes (TAK1‐positive). TAK1 interferes with p62‐LC3B interactions. Bottom: under stress conditions, p62 signalosomes form in a TAK1‐dependent manner.
Similar articles
-
NIMA-related kinase 9-mediated phosphorylation of the microtubule-associated LC3B protein at Thr-50 suppresses selective autophagy of p62/sequestosome 1.J Biol Chem. 2020 Jan 31;295(5):1240-1260. doi: 10.1074/jbc.RA119.010068. Epub 2019 Dec 19. J Biol Chem. 2020. PMID: 31857374 Free PMC article.
-
p62/SQSTM1/Sequestosome-1 is an N-recognin of the N-end rule pathway which modulates autophagosome biogenesis.Nat Commun. 2017 Jul 24;8(1):102. doi: 10.1038/s41467-017-00085-7. Nat Commun. 2017. PMID: 28740232 Free PMC article.
-
TRIM32, but not its muscular dystrophy-associated mutant, positively regulates and is targeted to autophagic degradation by p62/SQSTM1.J Cell Sci. 2019 Dec 2;132(23):jcs236596. doi: 10.1242/jcs.236596. J Cell Sci. 2019. PMID: 31685529 Free PMC article.
-
Regulation of selective autophagy: the p62/SQSTM1 paradigm.Essays Biochem. 2017 Dec 12;61(6):609-624. doi: 10.1042/EBC20170035. Print 2017 Dec 12. Essays Biochem. 2017. PMID: 29233872 Review.
-
p62/SQSTM1 and Selective Autophagy in Cardiometabolic Diseases.Antioxid Redox Signal. 2019 Aug 20;31(6):458-471. doi: 10.1089/ars.2018.7649. Epub 2019 Feb 11. Antioxid Redox Signal. 2019. PMID: 30588824 Free PMC article. Review.
Cited by
-
Membrane and synaptic defects leading to neurodegeneration in Adar mutant Drosophila are rescued by increased autophagy.BMC Biol. 2020 Feb 14;18(1):15. doi: 10.1186/s12915-020-0747-0. BMC Biol. 2020. PMID: 32059717 Free PMC article.
-
TRIM proteins in autophagy: selective sensors in cell damage and innate immune responses.Cell Death Differ. 2020 Mar;27(3):887-902. doi: 10.1038/s41418-020-0495-2. Epub 2020 Jan 22. Cell Death Differ. 2020. PMID: 31969691 Free PMC article. Review.
-
MOAP-1-mediated dissociation of p62/SQSTM1 bodies releases Keap1 and suppresses Nrf2 signaling.EMBO Rep. 2021 Jan 7;22(1):e50854. doi: 10.15252/embr.202050854. Epub 2021 Jan 4. EMBO Rep. 2021. PMID: 33393215 Free PMC article.
-
Unveiling the physiological impact of ESCRT-dependent autophagosome closure by targeting the VPS37A ubiquitin E2 variant-like domain.Cell Rep. 2024 Dec 24;43(12):115016. doi: 10.1016/j.celrep.2024.115016. Epub 2024 Nov 27. Cell Rep. 2024. PMID: 39607828 Free PMC article.
-
Autophagic sequestration of SQSTM1 disrupts the aggresome formation of ubiquitinated proteins during proteasome inhibition.Cell Death Dis. 2022 Jul 15;13(7):615. doi: 10.1038/s41419-022-05061-8. Cell Death Dis. 2022. PMID: 35840557 Free PMC article.
References
-
- Ravikumar B, Vacher C, Berger Z, Davies JE, Luo S, Oroz LG, Scaravilli F, Easton DF, Duden R, O'Kane CJ, et al (2004) Inhibition of mTOR induces autophagy and reduces toxicity of polyglutamine expansions in fly and mouse models of Huntington disease. Nat Genet 36: 585–595 - PubMed
Publication types
MeSH terms
Substances
Grants and funding
LinkOut - more resources
Full Text Sources
Miscellaneous
