

CDK12 controls G1/S progression by regulating RNAPII processivity at core DNA replication genes
- PMID: 31347271
- PMCID: PMC6727028
- DOI: 10.15252/embr.201847592
CDK12 controls G1/S progression by regulating RNAPII processivity at core DNA replication genes
Abstract
CDK12 is a kinase associated with elongating RNA polymerase II (RNAPII) and is frequently mutated in cancer. CDK12 depletion reduces the expression of homologous recombination (HR) DNA repair genes, but comprehensive insight into its target genes and cellular processes is lacking. We use a chemical genetic approach to inhibit analog-sensitive CDK12, and find that CDK12 kinase activity is required for transcription of core DNA replication genes and thus for G1/S progression. RNA-seq and ChIP-seq reveal that CDK12 inhibition triggers an RNAPII processivity defect characterized by a loss of mapped reads from 3'ends of predominantly long, poly(A)-signal-rich genes. CDK12 inhibition does not globally reduce levels of RNAPII-Ser2 phosphorylation. However, individual CDK12-dependent genes show a shift of P-Ser2 peaks into the gene body approximately to the positions where RNAPII occupancy and transcription were lost. Thus, CDK12 catalytic activity represents a novel link between regulation of transcription and cell cycle progression. We propose that DNA replication and HR DNA repair defects as a consequence of CDK12 inactivation underlie the genome instability phenotype observed in many cancers.
Keywords: CDK12; CTD Ser2 phosphorylation; G1/S; premature termination and polyadenylation; tandem duplications.
© 2019 The Authors. Published under the terms of the CC BY 4.0 license.
Conflict of interest statement
The authors declare that they have no conflict of interest.
Figures
- A
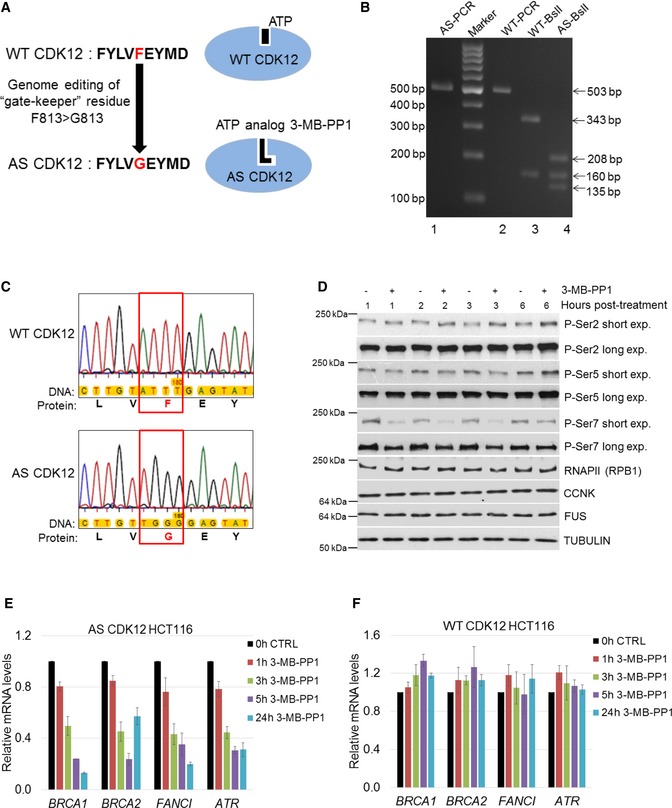
Scheme depicting preparation of AS CDK12 HCT116 cell line. Gate keeper phenylalanine (F) and glycine (G) are indicated in red, and adjacent amino acids in CDK12 active site are shown in black letters (left). ATP and ATP analog 3‐MB‐PP1 are shown as black objects in wild‐type (WT) and AS CDK12 (blue ovals), respectively (right).
- B
Genotyping of AS and WT CDK12 clones. Ethidium bromide‐stained agarose gel visualizing PCR products from genomic DNA of AS (AS‐PCR) and WT (WT‐PCR) CDK12 HCT116 cells and their digest with BslI enzyme (indicated as AS‐ BslI and WT‐ BslI). Primer positions and BslI restriction sites are depicted at Fig EV1A. Numbers on the left and right indicate DNA marker and DNA fragment sizes, respectively.
- C
Detailed insight into sequencing of genomic DNA from WT and AS CDK12 HCT116 cell lines. The genomic region in WT and AS CDK12 subjected to genome editing is shown in red rectangle; gate keeper amino acids F and G are in red. The full ˜ 500 kb sequence surrounding the edited genomic region is in the Appendix Fig S1A and B.
- D
Effect of CDK12 inhibition on phosphorylation of the CTD of RNAPII. Western blot analyses of protein levels by the indicated antibodies in AS CDK12 HCT116 cells treated with 5 μM 3‐MB‐PP1 for indicated times. Long and short exp. = long (4–14 min) and short (10–60 s) exposures, respectively. FUS and tubulin are loading controls. A representative image from three replicates is shown.
- E, F
Inhibition of CDK12 in AS CDK12 HCT116 cells results in down‐regulation of CDK12‐dependent HR genes. Graph shows RT–qPCR analysis of relative levels of mRNAs of described genes in AS CDK12 HCT116 (E) and WT CDK12 HCT116 (F) cells treated for indicated times with 3‐MB‐PP1. mRNA levels were normalized to HPRT1 mRNA expression and the mRNA levels of untreated control (CTRL) cells were set to 1. n = 3 replicates, error bars indicate standard error of the mean (SEM).
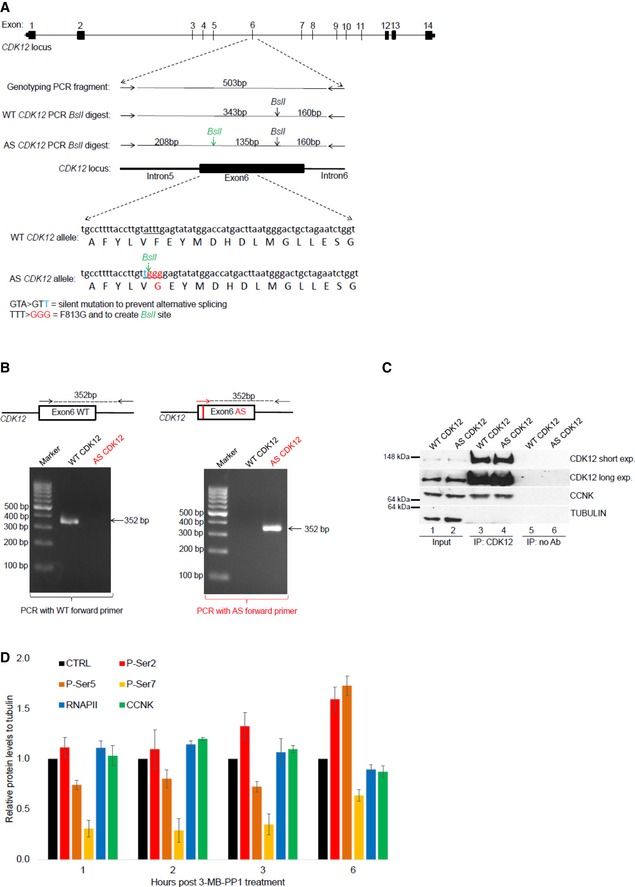
Depiction of CDK12 locus, genome editing, and genotyping strategy. Schema of CDK12 locus, with exon numbers shown above the CDK12 gene depiction (top). Primers used for genotyping PCR surrounding exon 6 of CDK12 gene are shown as horizontal arrows, PCR product is depicted as full horizontal line, and BslI restriction sites are indicated by vertical arrows. BslI restriction site created by genome editing is shown in green. Size (bp) of genotyping PCR product and BslI restriction fragments are indicated (middle). DNA subjected to genome editing and corresponding protein sequences in exon 6 of CDK12 genes are shown; the underlined DNA sequence in WT CDK12 allele underwent genome editing to create silent mutation preventing alternative splicing (nucleotide in blue), BslI restriction site, and to convert F813 to G813 (nucleotides in red) in AS CDK12. Engineered G813 in AS CDK12 is indicated in red (bottom).
Characterization of AS CDK12 clone by a AS primer‐specific PCR. Exon 6 in CDK12 gene is shown as a black box. Edited DNA in the AS CDK12 is marked by a red vertical line in the exon 6. Genotyping primers specific for WT (black arrows) and AS CDK12 (red arrow) are shown, and genotyping PCR product is depicted by a dashed line with size (in bp) indicated above (top). Ethidium bromide‐stained agarose gel visualizing 352 bp PCR product from PCR mixture using either WT‐ (left) or AS‐specific (right) forward primer (bottom).
CCNK/CDK12 complex shows comparable properties in the AS and WT CDK12 HCT116 cell lines. Western blot analysis of protein levels (input) and association [determined by immunoprecipitation (IP)] of CCNK and CDK12 in the indicated cell lines. No Ab corresponds to a control immunoprecipitation without antibody. A representative image of three replicates is shown.
Quantification of individual P‐Ser modifications in the CTD of RNAPII after CDK12 inhibition. Amounts of individual proteins and CTD modifications presented in Fig 1D and in another two biological replicates from short film exposures were quantified by ImageJ software. All protein levels were normalized to a corresponding tubulin loading control, and samples without treatment in each time point (CTRL) were considered as 1; n = 3 biological replicates and error bars are standard error of the mean (SEM).

- A
Experimental outline. AS CDK12 HCT116 cells were arrested by serum starvation for 72 h and released into the serum‐containing medium with or without 3‐MB‐PP1. DNA content was analyzed by flow cytometry at indicated time points after the release.
- B
CDK12 kinase activity is needed for G1/S progression in cells arrested by serum starvation. Flow cytometry profiles of control (−3‐MB‐PP1) or inhibitor (+3‐MB‐PP1) treated cells from the experiment depicted in Fig 2A. The red arrow points to the onset of the G1/S progression defect in 3‐MB‐PP1‐treated cells. To better visualize the G1/S delay in the presence of the inhibitor, the 24‐h time point is also shown. n = 3 replicates; representative result is shown.
- C
Quantification of cells (%) in individual cell cycle phases based on flow cytometry profiles of the representative replicate in Fig 2B.
- D
CDK12 protein levels peak in the G0/G1 phase of the cell cycle. Western blots show levels of proteins at indicated time points after the release of serum‐starved AS CDK12 HCT116 cells. Corresponding cell cycle phases are depicted above time points. A representative Western blot from three replicates is shown.
- E
Experimental outline. AS CDK12 HCT116 cells were arrested by serum starvation for 72 h and released into the serum‐containing medium. 3‐MB‐PP1 was either added or not at indicated time points after the release. Propidium iodide‐ or BrdU‐stained DNA content was measured by flow cytometry at 16 h after the release. Note, that for the BrdU staining the 3‐MB‐PP1 was added only at the time of the release (0 h) and 3, 4, 5, and 6 h after the release.
- F, G
Inhibition of CDK12 in early G1 perturbs normal cell cycle progression. Quantification of cells (%) in cell cycle phases from flow cytometry profiles of propidium iodide (F)‐ and BrdU (G)‐labeled cells upon addition of 3‐MB‐PP1 at indicated time points after serum addition in the experiment depicted in Fig 2E. CTRL in Fig 2G = control sample without 3‐MB‐PP1. n = 3 replicates, representative result is shown.
- H
Short‐term CDK12 inhibition does not activate DNA damage checkpoints. Western blot analyses of phosphorylation of depicted DNA damage response markers upon inhibition of CDK12 for indicated times. CPT corresponds to 5 μM camptothecin. A representative Western blot from three replicates is shown. FUS is a loading control.

3‐MB‐PP1 does not affect cell cycle progression in WT HCT116 cells. The experiment was performed as shown in Fig 2A. n = 3; representative result is shown.
THZ531 causes G1/S progression defect in WT HCT116 cells arrested by serum starvation. Flow cytometry profiles of control (−THZ531) or 350 nM THZ531(+THZ531)‐treated cells from the experiment outlined in Fig 2A. Red arrow points to the onset of the G1/S progression defect in THZ531‐treated cells. n = 3 replicates; representative result is shown.
CDK12 inhibition delays G1/S progression in thymidine/nocodazole‐arrested AS CDK12 HeLa cells. Flow cytometry profiles of control (−3‐MB‐PP1) or 3‐MB‐PP1 (+3‐MB‐PP1) treated cells from the experiment shown in Fig 2A. Red arrow points to the onset of the G1/S progression defect in 3‐MB‐PP1‐treated cells. n = 3 replicates; representative result is shown.
Experimental outline. AS CDK12 HCT116 cells were arrested by serum starvation for 72 h and released into the serum‐containing medium with (+) or without (−) 3‐MB‐PP1. 3‐MB‐PP1 was washed away and replaced with fresh medium at indicated times after the release, and all samples were subjected to flow cytometry analyses at 15 h after the release.
G1/S progression delay can be rescued by removal of CDK12 inhibitor at early G1 phase. Flow cytometry profiles of propidium iodide‐labeled cells from the experiment depicted in Fig EV2D. CTRL = control samples without the 3‐MB‐PP1. n = 3 replicates; representative result is shown.
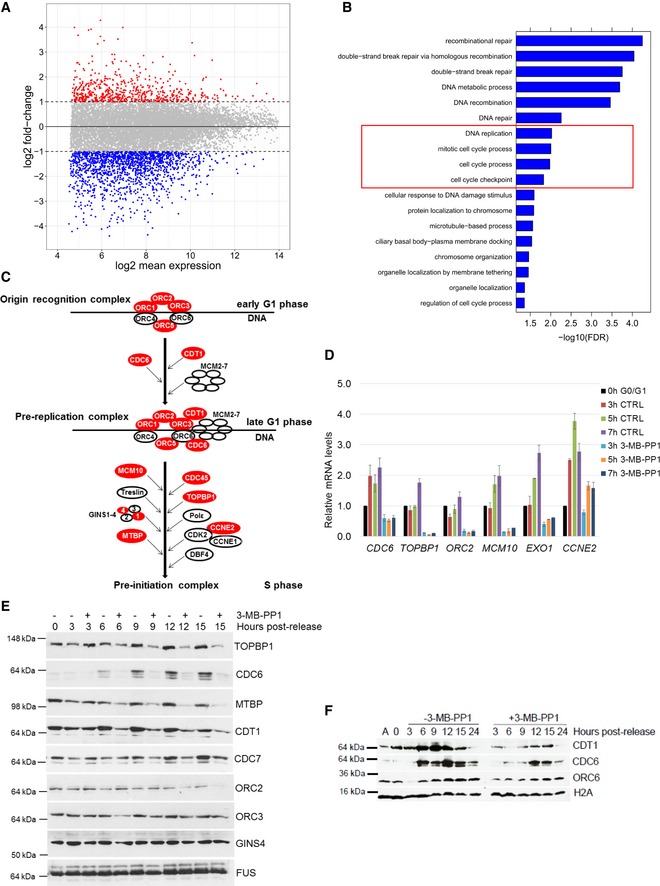
CDK12 inhibition results in differential expression of a subset of genes. Comparison of log2 fold‐changes versus log2 mean expression in 3′end RNA‐seq data shows differentially regulated genes after inhibition of CDK12. Down‐ (log2 fold‐change < −1) and up‐regulated (log2 fold‐change > 1) genes are shown in blue and red, respectively.
CDK12 inhibition down‐regulates DNA damage‐ and cell cycle‐related genes. GO analysis using the Gorilla webserver of enriched cellular functions in 1,491 genes down‐regulated (log2 fold‐change < −1.0; P < 0.01) in 3′end RNA‐seq data upon CDK12 inhibition. Functions related to DNA replication and cell cycle are marked by the red rectangle.
Outline of formation and activation of DNA replication complexes in G1/S phase. Origin recognition, pre‐replication, and pre‐initiation complexes are depicted; genes dependent on CDK12 kinase activity (log2 fold‐change < −0.85; P < 0.01) are shown in red.
Validation of RNA‐seq for select DNA replication genes by RT–qPCR. Graph shows relative levels of mRNAs of described genes in serum arrested and released (0 h G0/G1) AS CDK12 HCT116 cells either treated (3‐MB‐PP1) or not (CTRL) with the inhibitor for indicated times after the release. mRNA levels were normalized to B2M mRNA expression, and mRNA levels for each gene at the time of release (0 h) were set as 1. n = 3 replicates, error bars indicate SEM.
Protein levels of core DNA replication factors are dependent on the CDK12 kinase activity. Western blot analyses of protein expression by the depicted antibodies in serum synchronized and released (0 h) cells either treated or not with 3‐MB‐PP1 for the indicated times after the release. FUS is a loading control. A representative Western blot of three replicates is shown.
CDK12 inhibition affects loading of CDC6 and CDT1 DNA replication factors to chromatin. Western blotting analyses of chromatin association of the indicated DNA replication factors in serum synchronized and released AS CDK12 HCT116 cells treated or not with 3‐MB‐PP1 for the indicated times. Histone H2A serves as a loading control of chromatin fractions. A = asynchronous cells, 0 h = time of release. A representative Western blot of three replicates is shown.
- A
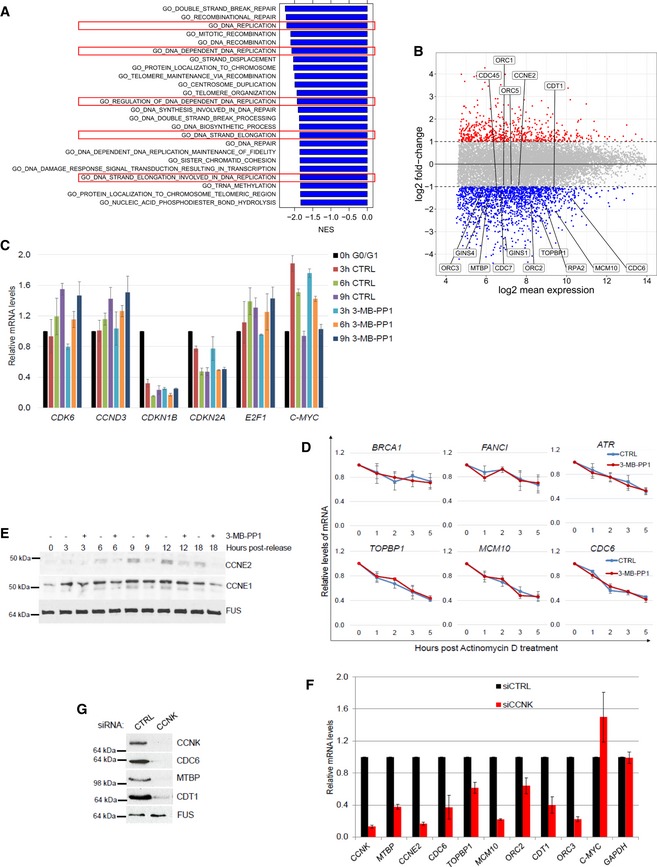
CDK12 inhibition down‐regulates DNA replication‐related genes. GSEA analysis based on log2 fold‐changes in 3′end RNA‐seq data upon CDK12 inhibition. Normalized enrichment scores (NES) are shown for significant GO terms (FDR q‐val < 0.05) with negative NES, i.e., associated with down‐regulation. Functions related to DNA replication are marked by the red rectangles.
- B
Expression of crucial DNA replication genes is dependent on the CDK12 kinase activity. Comparison of log2 fold‐changes versus log2 mean expression in 3′end RNA‐seq data and depicts down‐regulated DNA replication genes (−0.85 > log2 fold‐change, P < 0.01) after 5‐h CDK12 inhibition.
- C
Validation of 3′end RNA‐seq for select non‐regulated genes by RT–qPCR. See Fig 3D for legend. n = 3 replicates, error bars represent SEM.
- D
Inhibition of CDK12 kinase does not affect mRNA degradation of select DNA repair and replication transcripts. AS CDK12 HCT116 cells were treated with ActD (1 μg/ml) either in the presence (red line) or absence (CTRL) (blue line) of 3‐MB‐PP1. Total mRNA was isolated at indicated time points, and levels of indicated mRNAs normalized to HPRT1 were measured by RT–qPCR. Graphs present mRNA levels relative to untreated cells (time 0 h set to 1). n = 3 independent experiments, error bars are SEM.
- E
Expression of core DNA replication proteins is dependent on the CDK12 kinase activity. See legend in Fig 3E.
- F, G
CCNK depletion diminishes mRNA and protein expression of DNA replication genes. RT–qPCR of mRNA levels (F) and Western blot of protein levels (G) in AS CDK12 HCT116 cells treated with control (CTRL) or CCNK siRNAs for 36 h. mRNA levels were normalized to GAPDH mRNA expression. n = 3 replicates for RT–qPCR (F), error bars indicate SEM. In (G), a representative experiment from three replicates is shown.
- A
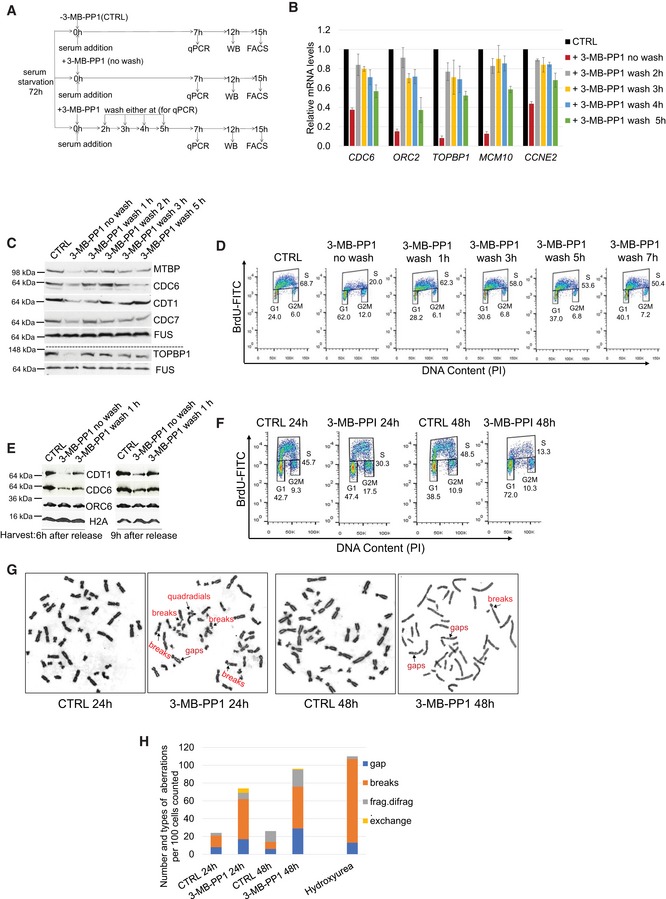
Experimental outline. AS CDK12 HCT116 cells were arrested by serum starvation for 72 h and released into the serum‐containing medium with (+) or without (−) 3‐MB‐PP1. 3‐MB‐PP1 was washed away and replaced with fresh medium at indicated times after the release and samples were subject to RT–qPCR, Western blotting, and flow cytometry analyses at 7, 12, and 15 h after the release, respectively. Note that shown wash away time points (2, 3, 4, 5 h) are valid for RT–qPCR only, for Western blotting and flow cytometry 1, 2, 3, 5 h and 1, 3, 5, 7 h wash away time points were applied, respectively. All experiments were performed in at least three replicates.
- B–D
Removal of CDK12 inhibitor in early G1/S rescues replication gene expression and cell cycle progression. RT–qPCR (B), Western blotting (C), and flow cytometry analyses (D) of replication gene mRNA, protein levels, and cell cycle progression, respectively. RT–qPCR, Western blotting, and flow cytometry analyses were performed 7, 12, and 15 h post‐release, respectively. CTRL = control samples without the 3‐MB‐PP1. In B, n = 3 and error bars indicate SEM. In (C, D) representative images from three biological replicates are shown.
- E
Rescued loading of CDC6 and CDT1 on chromatin after removal of CDK12 inhibitor. Western blot analyses of chromatin fractions of serum‐starved AS CDK12 HCT116 cells treated with 3‐MB‐PP1 for 6 or 9 h or with the inhibitor washed off after 1 h of treatment. CTRL corresponds to cells not treated with the inhibitor at the time of the serum addition. All cells were harvested either 6 or 9 h after the serum addition. Histone H2A serves as a loading control of chromatin fractions, and studied DNA replication factors are indicated. A representative image of three replicates is shown.
- F
Inhibition of CDK12 kinase activity in cycling cells leads to decreased numbers of actively replicating cells. Asynchronous AS CDK12 HCT116 cells were grown for 24 and 48 h in the presence or absence of 3‐MB‐PP1, and replicating BrdU‐stained cells were quantified by FACS analyses. CTRL = control samples without the 3‐MB‐PP1. A representative image of three replicates is shown.
- G, H
Prolonged CDK12 inhibition causes chromosomal aberrations in cells. Specific chromosomal aberrations in cells treated with 3‐MB‐PP1 (24 or 48 h), 4 mM hydroxyurea (5 h), or control solvent (CTRL) were identified by microscopy. A representative image from three biological replicates is shown (G). Total numbers of chromosomal aberrations per hundred cells of the representative replicate in (G) are quantified (H).
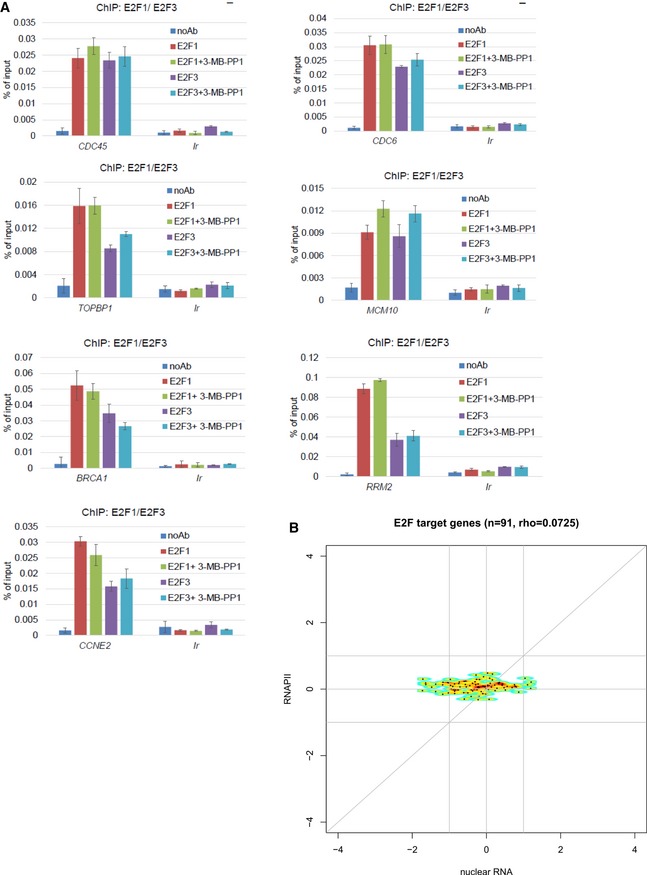
CDK12 directs expression of DNA replication genes downstream of the E2F/RB pathway. Graphs present ChIP‐qPCR data for E2F1 and E2F3 in AS CDK12 HCT116 cells either treated or not with 3‐MB‐PP1 for 4 h. qPCR primers were designed at promoters of indicated genes. n = 3 replicates; error bars represent SEM. Ir is intergenic region; noAb corresponds to no antibody immunoprecipitation control.
CDK12 inhibition does not lead to differential recruitment of RNAPII to E2F target genes. The plots show log2 fold‐changes of RNAPII occupancy on promoters of E2F target genes (y‐axis) plotted against corresponding log2 fold‐changes in mRNA expression from nuclear RNA‐seq (x‐axis). Promoter occupancy was quantified as read counts in the ±3 kb regions around the transcription start site (TSS). For each gene, we selected the transcript with the most read counts in the RNAPII ChIP‐seq samples (normalized to library size) in the ±3 kb regions around the TSS and transcription termination site (TTS). Corresponding RNAPII ChIP‐seq and nuclear RNA‐seq experiments are presented in Fig 5A and B. E2F target genes were obtained from Bracken et al 40; rho = Spearman rank correlation coefficient.
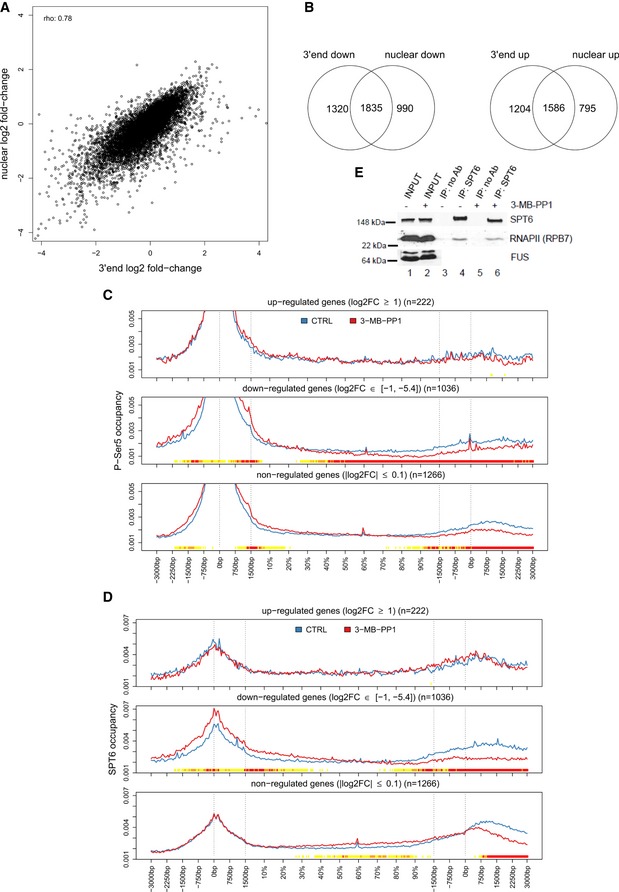
High correlation between gene expression changes in nuclear and 3′end RNA‐seq data. Graph compares log2 fold‐changes in nuclear and 3′end RNA‐seq data determined with DESeq2. rho = Spearman rank correlation coefficient.
Inhibition of CDK12 affects the expression of similar subsets of genes in nuclear and 3′end RNA‐seq data. See Fig 5A for legend. Venn diagrams are shown for significantly down‐regulated (log2 fold‐change < 0, P ≤ 0.01) and up‐regulated (log2 fold‐change > 0, P ≤ 0.01) genes.
P‐Ser5 occupancy shows shifts after CDK12 inhibition. Metagene analysis of P‐Ser5 ChIP‐seq data as described in Fig 5B and C.
SPT6 shows diminished relative occupancy at 3′ends of down‐regulated genes upon CDK12 inhibition. Metagene analysis of SPT6 ChIP‐seq data as described in Fig 5B and C.
CDK12 inhibition does not affect SPT6/RNAPII association in cells. Western blot analyses of SPT6 and RNAPII interaction after 4‐h treatment with the 3‐MB‐PP1 in AS CDK12 HCT116 cells. Representative image from three replicates is shown.

- A
Inhibition of CDK12 affects the expression of similar subsets of genes in nuclear and 3′end RNA‐seq data. The Venn diagrams represent the overlap between genes significantly (P < 0.01) up‐ (log2 fold‐change > 1) or down‐regulated (log2 fold‐change < −1) in nuclear and 3′end RNA‐seq data.
- B, C
Genes down‐regulated in nuclear RNA‐seq after CDK12 inhibition have diminished relative occupancy of RNAPII at their 3′ends and higher relative occupancy of P‐Ser2 in their gene bodies. Metagene analyses of RNAPII (B) and P‐Ser2 (C) ChIP‐seq data (see Materials and Methods). Each transcript was divided into two parts with fixed length (transcription start site (TSS) −3 kb to +1.5 kb and transcription termination site (TTS) −1.5 kb to +3 kb) and a central part with variable length corresponding to the rest of gene body (shown in %). Each part was binned into a fixed number of bins (90/180/90), and average coverage for each bin was calculated for each transcript in each sample. The curve for each transcript was normalized to a sum of one and then averaged first across genes and second across samples. Dotted lines indicate TSS, 1,500 nucleotides downstream of TSS, and 1,500 nucleotides upstream of TTS and TTS. The color track at the bottom of each subfigure indicates the significance of paired Wilcoxon tests comparing the normalized transcript coverages for each bin between untreated (CTRL) cells and cells treated with 3‐MB‐PP1. P‐values are adjusted for multiple testing with the Bonferroni method within each subfigure; color code: red = adjusted P‐value ≤ 10−15, orange = adjusted P‐value ≤ 10−10, yellow = adjusted P‐value ≤ 10−3.
- D, E
Examples of genes whose transcription processivity and expression is dependent on the CDK12 kinase activity. Nuclear RNA‐seq data on the respective strand and RNAPII, P‐Ser2, P‐Ser5, and SPT6 ChIP‐seq data for MED13 (D), UBE3C (E) genes from cells either treated (red) or not (blue, CTRL) with 3‐MB‐PP1 were visualized with Gviz. Read counts were normalized to the total number of mapped reads per sample and averaged between replicates. Blue and red boxes below the RNA‐seq data indicate the 90% distance (see Fig 7D and E and corresponding text) in control and CDK12‐inhibited samples, respectively.
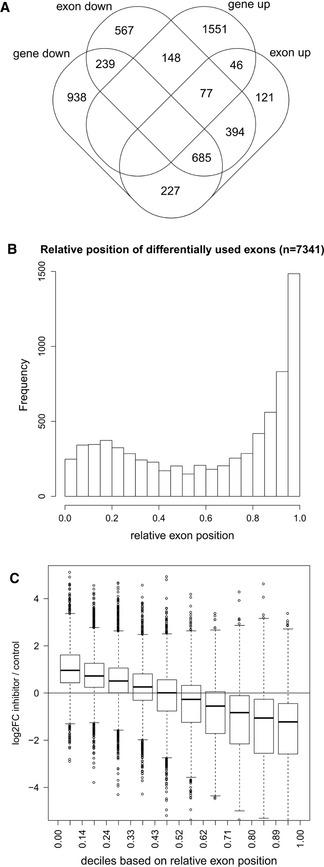
Overlap between down‐regulated genes and genes with differential exon usage upon CDK12 inhibition. Venn diagram shows the overlap between significantly differentially expressed genes (identified by DESeq2) and genes with differential exon usage (identified by DEXSeq) in nuclear RNA‐seq data (0 > log2 fold‐change > 0, P < 0.01, restricted to genes included in the DEXSeq analysis).
Differentially used exons are enriched at gene 3′ends. Graph shows the distribution of the relative genomic position of the exon on the gene (relative exon position: 0 = at gene 5′end, 1 = at gene 3′end) of differentially used exons (0 > log2 fold‐change > 0, P < 0.01).
For down‐regulated genes with differentially used exons, exons close to the 5′end and 3′end tend to be up‐ and down‐regulated, respectively. Box plots show the log2 fold‐change in exon usage after CDK12 inhibition determined by DEXSeq. Exons were grouped into deciles according to their relative exon position. n = 3 replicates. The boxes indicate the range between the 25th and 75th percentile (=interquartile range (IQR)) around the median (thick horizontal line) of the distribution. The whiskers (=short horizontal lines at ends of dashed vertical line) extend to the data points at most 1.5 × IQR from the box. Data points outside this range are shown as circles.
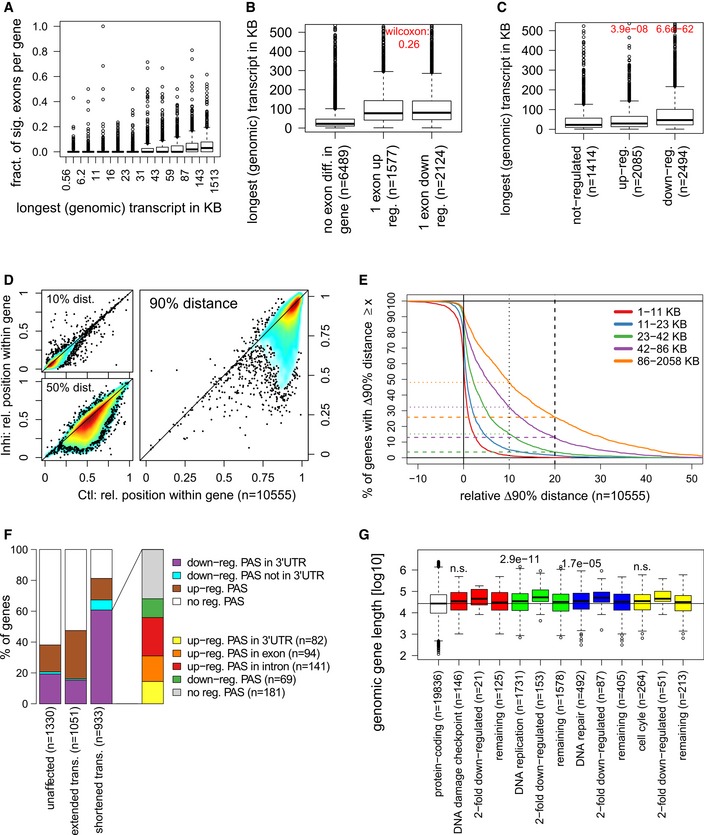
Longer genes tend to have a larger fraction of differentially used exons. Box plot shows the fraction of exons significantly differentially used for 9,026 expressed genes grouped into deciles based on the genomic length (including exons and introns) of their longest transcripts. n = 3 replicates. See legend in Fig 6C for the boxplot description.
Genes with differentially used exons tend to be longer. Box plots show length of genes with no differentially used exons, or at least one exon differentially up‐regulated (DEXSeq log2 fold‐change ≥ 0, P < 0.01) or down‐regulated (log2 fold‐change ≤ 0, P < 0.01). P‐value from a two‐sided Wilcoxon rank sum test comparing median lengths between genes with either up‐ or down‐regulated exons is indicated on top. n = 3 replicates. See legend in Fig 6C for the boxplot description.
Down‐regulated genes tend to be longer than not‐regulated genes, while up‐regulated genes show little difference. Box plots show length of genes with no differential expression (−0.1 < log2 fold‐change < 0.1, P > 0.01), up‐regulated (log2 fold‐change ≥ 0, P < 0.01), or down‐regulated (log2 fold‐change ≤ 0, P < 0.01) as determined by DESeq2. P‐values from two‐sided Wilcoxon rank sum tests comparing median lengths for up‐ and down‐regulated genes, respectively, to non‐regulated genes are indicated on top. n = 3 replicates. See legend in Fig 6C for the boxplot description.
RNAPII processivity is affected not close to but at some distance from the TSS after CDK12 inhibition. The graphs compare the relative distance from the TSS where 10, 50 and 90% of read coverage is identified (=x% distance) in control (x‐axis) against CDK12‐inhibited (y‐axis) cells.
Transcripts of longer genes are more often impacted by shortening and lose a larger proportion of their length in comparison with shorter genes. The plot shows on the x‐axis the relative change in the 90% distance (relative Δ90% distance = (90% distance in control − 90% distance in CDK12 inhibited cells)/gene length) and on the y‐axis the percentage of genes showing a Δ90% distance equal or greater than the value on the x‐axis. Positive and negative relative Δ90% distances on the x‐axis indicate a shortening or extension of transcripts, respectively, after CDK12 inhibition. Genes were divided into quintiles according to gene length, and curves for quintiles are shown separately. Dotted and dashed horizontal lines indicate the percentage of genes in each quintile with a transcript shortening of at least 10 and 20%, respectively.
Shortening of transcripts is evidenced by down‐regulated poly(A) sites (PAS) in the 3′end RNA‐seq data and accompanied by up‐regulated upstream PAS for the majority of genes. The plot shows the fraction of genes with shortened (relative Δ90% distance ≥ 0.2), extended (absolute Δ90% distance < −50 bp), or unaffected transcripts (|absolute Δ90% distance| ≤ 25 bp) with down‐, up‐, and non‐regulated PAS according to the 3′end RNA‐seq data. For genes with shortened transcripts and down‐regulated PAS in a 3′ UTR, the percentage of genes with upstream up‐regulated PAS is indicated on the right. In case of multiple identified PAS, the order of preference was as indicated in the legend from top to bottom.
DNA replication and repair genes are longer than other protein‐coding genes. Box plots show the length for the indicated groups of genes (according to GO annotations). Median gene lengths for each GO category were compared against all other protein‐coding genes using a one‐sided Wilcoxon rank sum test (P‐values provided in figure, n.s.: P > 0.001). See legend in Fig 6C for the boxplot description.
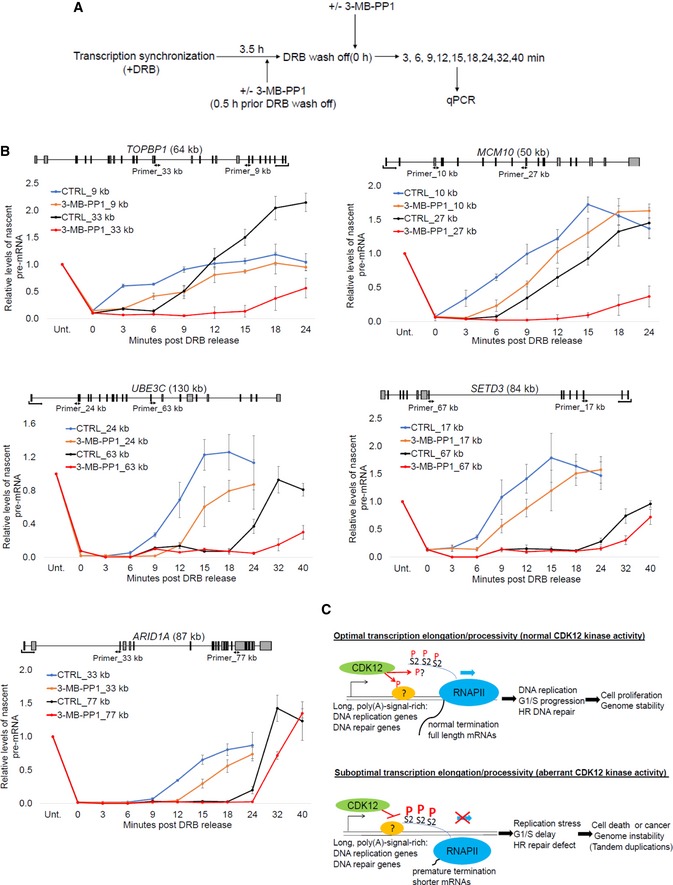
Experimental outline for measurement of transcription elongation rates. AS CDK12 HCT116 cells were treated with DRB for 3.5 h to synchronize RNAPII at gene promoters. The cells were either pretreated (+) or not (−) with 3‐MB‐PP1 0.5 h prior DRB wash off. After DRB wash off (0 h), fresh medium either supplemented (+) or not (−) with 3‐MB‐PP1 was added and samples were taken at indicated time points for analyses of pre‐mRNA expression by RT–qPCR.
Transcription elongation rate decreases in bodies of CDK12‐dependent but not CDK12‐independent genes after CDK12 inhibition. Graphs show relative levels of pre‐mRNAs of described genes in AS CDK12 HCT116 cells either treated with 3‐MB‐PP1 or not (CTRL) for indicated times after DRB wash off. Pre‐mRNA levels were normalized to the samples not treated with DRB (Unt) for which the value was set as 1. n = 3 independent experiments, error bars correspond to SEM. Positions of primers (designed to span exon–intron junctions) and their distance from the transcription start site in kb are indicated in the gene structures shown above the graphs.
Proposed model. Schema shows groups of genes whose RNAPII processivity is particularly sensitive to CDK12 catalytic activity and cellular functions that are especially dependent on optimal expression of these genes. The situation in cells with normal and aberrant CDK12 kinase activity is depicted. CDK12 (green oval) phosphorylates (P) unknown substrate(s) (orange oval), possibly including the CTD (blue line), which results in optimal elongation and processivity (blue arrow) of RNAPII (blue oval) for CDK12‐sensitive genes. Full length, functional mRNAs are synthesized (upper panel). Inhibition of CDK12 leads to hyperphosphorylation (capital P) of Ser2 (S2) in bodies of CDK12‐sensitive genes, which is associated with slower elongation and premature termination. Shorter, aberrant mRNAs are made (lower panel). mRNAs are depicted as black lines.
References
-
- Harlen KM, Churchman LS (2017) The code and beyond: transcription regulation by the RNA polymerase II carboxy‐terminal domain. Nat Rev Mol Cell Biol 18: 263–273 - PubMed
-
- Buratowski S (2003) The CTD code. Nat Struct Biol 10: 679–680 - PubMed
-
- Egloff S, Murphy S (2008) Cracking the RNA polymerase II CTD code. Trends Genet 24: 280–288 - PubMed
Publication types
MeSH terms
Substances
Associated data
- Actions
Grants and funding
- CRC 1123 (Z2)/Deutsche Forschungsgemeinschaft/International
- LM2015063/National Infrastructure for Chemical Biology/International
- 17-13692S/Czech Science Foundation/International
- CZ.02.2.69/0.0/0.0/17_050/0008496/MSCAfellow@MUNI/International
- 17-17720S/Czech Science Foundation/International
- FR2938/7-1/Deutsche Forschungsgemeinschaft/International
- WT_/Wellcome Trust/United Kingdom
- CZ.1.05/1.1.00/02.0068/CEITEC/International
- 206292/E/17/Z/Wellcome Trust Collaborative Grant/International
- LQ1605/MEYS CR/International
- MUNI/E/0514/2019/The Grant Agency of Masaryk University/International
- CESNET LM2015042/Projects of Large Research, Development, and Innovations Infrastructures/International
LinkOut - more resources
Full Text Sources
Other Literature Sources
Molecular Biology Databases
