. 2019 Jul;24(7):1-12.
doi: 10.1117/1.JBO.24.7.075002.

Method for coregistration of optical measurements of breast tissue with histopathology: the importance of accounting for tissue deformations

Affiliations

Method for coregistration of optical measurements of breast tissue with histopathology: the importance of accounting for tissue deformations

Lisanne de Boer et al. J Biomed Opt. 2019 Jul.

Abstract

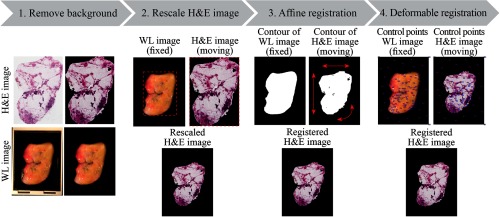
For the validation of optical diagnostic technologies, experimental results need to be benchmarked against the gold standard. Currently, the gold standard for tissue characterization is assessment of hematoxylin and eosin (H&E)-stained sections by a pathologist. When processing tissue into H&E sections, the shape of the tissue deforms with respect to the initial shape when it was optically measured. We demonstrate the importance of accounting for these tissue deformations when correlating optical measurement with routinely acquired histopathology. We propose a method to register the tissue in the H&E sections to the optical measurements, which corrects for these tissue deformations. We compare the registered H&E sections to H&E sections that were registered with an algorithm that does not account for tissue deformations by evaluating both the shape and the composition of the tissue and using microcomputer tomography data as an independent measure. The proposed method, which did account for tissue deformations, was more accurate than the method that did not account for tissue deformations. These results emphasize the need for a registration method that accounts for tissue deformations, such as the method presented in this study, which can aid in validating optical techniques for clinical use.

Keywords: diffuse reflectance; gold standard; histopathology; optical techniques; registration algorithm; validation.


Figures

Fig. 1
Fig. 1
Histopathological processing of the tissue. After arrival at the pathology department, the margins of the specimen are colored and the tissue is dissected into tissue slices (3  mm thick). (a) The white light image of the tissue slice that is selected for optical measurements. After these measurements, the slice is fixed in formalin and embedded in paraffin. (b) The white light image of the paraffin-embedded tissue slice. From this paraffin-embedded tissue slice, 3-μm thin sections are cut, which are stained with H&E stain. (c) The H&E section of the tissue slice, which is available a few days after surgery. Due to the histopathological processing of the tissue, (c) is deformed in comparison to (a).
Fig. 2
Fig. 2
Optical measurement setups. The tissue was measured with (a) the hyperspectral camera to (b) obtain a 3-D hypercube, in which each pixel contains a diffuse reflectance spectrum. Next, (c) the tissue was measured with the fiber-optic probe to obtain (d) a diffuse reflectance spectrum.
Fig. 3
Fig. 3
The steps required to register the H&E image to the white light (WL) image.
Fig. 4
Fig. 4
Representative example of control points (green and blue dots) selected by observer 1 in (a) the H&E image and (b) the white light image. The yellow squares in (a) and (b) correspond to the magnified squares, (c) and (d).
Fig. 5
Fig. 5
Measurement locations of the fiber-optic probe measurements. (a) A schematic image of the under grid (I) was registered to a white light image of the tissue with the grid on top (II) using a projective registration. (b) Subsequently, the white light image with the grid (II) was registered to the overview white light image (III) with a nonrigid (deformable) registration. The result after both registrations is the overview white light image with a projection of the measurement locations (IV).
Fig. 6
Fig. 6
Determination of the average fat percentage within 1 mm of the surface of the tissue. (a) The side view of a μCT image with two red lines that indicate the superficial cross-section, located 0.15 mm underneath the tissue height, and the deeper cross-section, located 1 mm underneath the superficial cross-section. (b) The side view corresponds to the dotted line in the 2-D image that represents the average gray value of the tissue within the two cross-sections.
Fig. 7
Fig. 7
Example of one of the tissue slices after (a) affine registration and (b) affine + deformable registration. (c) The second column shows the shape of the original H&E section with a striped pattern, and (d), (e) its transformation after both registrations. (f) The third column shows the white light image, (g), (h) which was used to calculate the Dice coefficient. (i) The fourth column shows the average μCT intensity between the cross sections and (j), (k) the rpb coefficient with the H&E sections after both registrations. The arrow indicates a structure that is easy to distinguish on both the μCT and the H&E image that, respectively, did and did not match after affine and affine + deformable registration. The values between brackets in (g), (h), (j), and (k) correspond to the Dice and rpb coefficient, respectively.
Fig. 8
Fig. 8
Comparison of registered H&E sections with optical results in one representative specimen. The H&E section after (a) affine registration and (b) after affine + deformable registration is displayed. In (c), the fitted fat percentage derived from the HSI (whole image) and the probe measurements (colored circles) is shown. The color of the circles in (a) and (b) indicates that the ratio of fat and nonfat tissue between the two registration methods differed less than 20% (black) or more than 20% (cyan). The fat percentage obtained with the optical measurements [as demonstrated in (c)] of the cyan-colored locations is plotted against the fat percentage obtained after (d) affine registration and (e) affine + deformable registration. The error bars represent the standard deviation of the fitted fat percentages. The dotted lines represent the linear fitted line through the measurements.

Similar articles

Cited by

References

    1. Wells W. A., et al. , “Validation of novel optical imaging technologies: the pathologists’ view,” J. Biomed. Opt. 12(5), 051801 (2007).JBOPFO10.1117/1.2795569 - DOI - PubMed
    1. Pritt B., et al. , “The effect of tissue fixation and processing on breast cancer size,” Hum. Pathol. 36, 756–760 (2005).HPCQA410.1016/j.humpath.2005.04.018 - DOI - PubMed
    1. Unger J., et al. , “Method for accurate registration of tissue autofluorescence imaging data with corresponding histology: a means for enhanced tumor margin assessment,” J. Biomed. Opt. 23(1), 015001 (2018).JBOPFO10.1117/1.JBO.23.1.015001 - DOI - PMC - PubMed
    1. McInnes E., “Artefacts in histopathology,” Comp. Clin. Path. 13, 100–108 (2005).10.1007/s00580-004-0532-4 - DOI
    1. Jerjes W. K., et al. , “The future of medical diagnostics: review paper,” Head Neck Oncol. 3, 38 (2011).10.1186/1758-3284-3-38 - DOI - PMC - PubMed

Publication types