. 2019 Nov 21;101(5):961-974.
doi: 10.1093/biolre/ioz134.

COX2 is induced in the ovarian epithelium during ovulatory wound repair and promotes cell survival†

Affiliations

COX2 is induced in the ovarian epithelium during ovulatory wound repair and promotes cell survival†

Lauren E Carter et al. Biol Reprod. .

Abstract

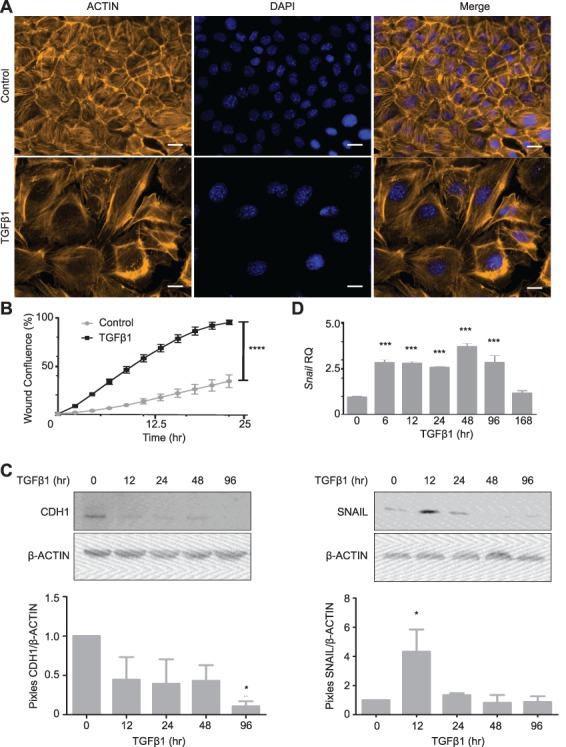
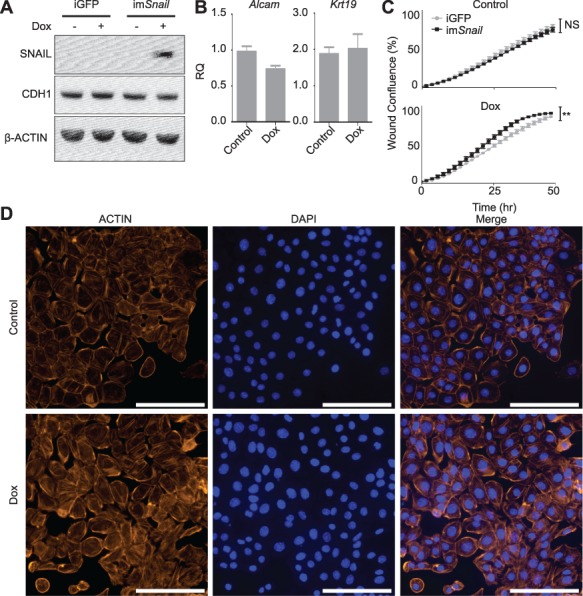
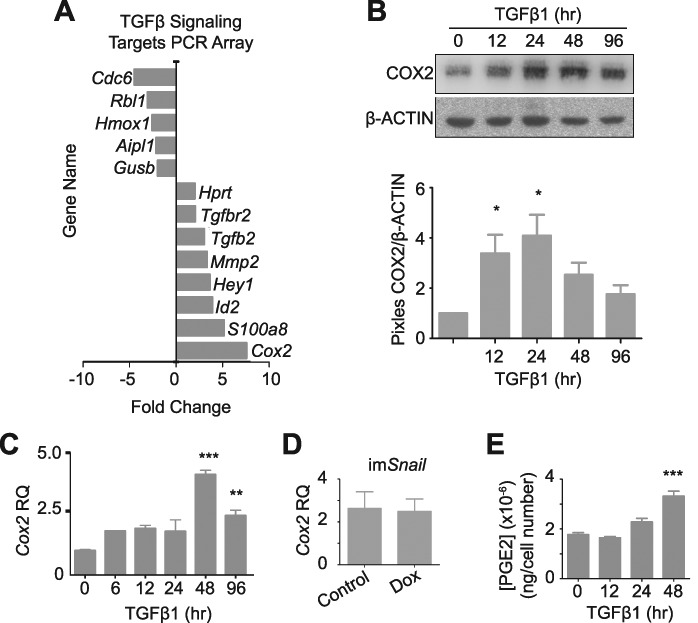
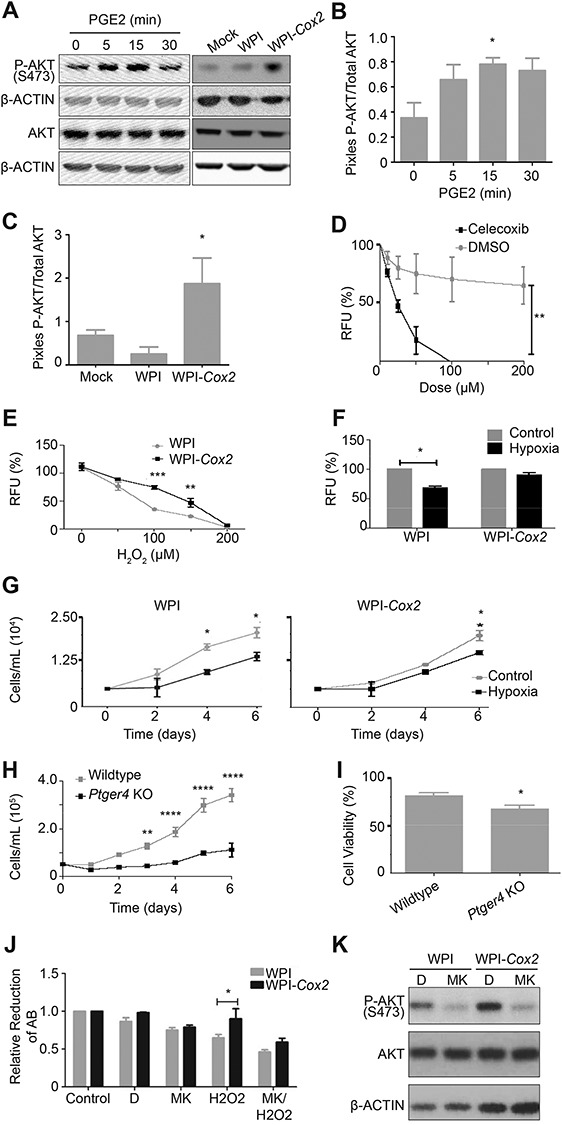
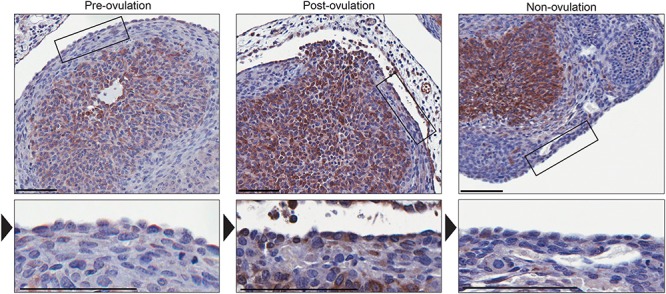
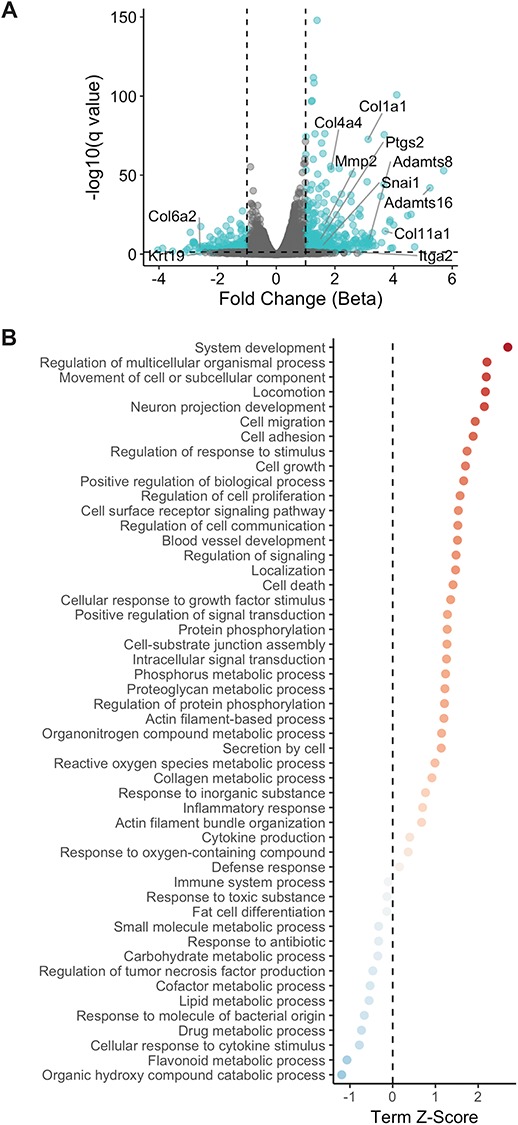
The ovarian surface epithelium (OSE) is a monolayer of cells surrounding the ovary that is ruptured during ovulation. After ovulation, the wound is repaired, however, this process is poorly understood. In epithelial tissues, wound repair is mediated by an epithelial-to-mesenchymal transition (EMT). Transforming Growth Factor Beta-1 (TGFβ1) is a cytokine commonly known to induce an EMT and is present throughout the ovarian microenvironment. We, therefore, hypothesized that TGFβ1 induces an EMT in OSE cells and activates signaling pathways important for wound repair. Treating primary cultures of mouse OSE cells with TGFβ1 induced an EMT mediated by TGFβRI signaling. The transcription factor Snail was the only EMT-associated transcription factor increased by TGFβ1 and, when overexpressed, was shown to increase OSE cell migration. A polymerase chain reaction array of TGFβ signaling targets determined Cyclooxygenase-2 (Cox2) to be most highly induced by TGFβ1. Constitutive Cox2 expression modestly increased migration and robustly enhanced cell survival, under stress conditions similar to those observed during wound repair. The increase in Snail and Cox2 expression with TGFβ1 was reproduced in human OSE cultures, suggesting these responses are conserved between mouse and human. Finally, the induction of Cox2 expression in OSE cells during ovulatory wound repair was shown in vivo, suggesting TGFβ1 increases Cox2 to promote wound repair by enhancing cell survival. These data support that TGFβ1 promotes ovulatory wound repair by induction of an EMT and activation of a COX2-mediated pro-survival pathway. Understanding ovulatory wound repair may give insight into why ovulation is the primary non-hereditary risk factor for ovarian cancer.

Keywords: Cyclooxygenase 2; epithelial-to-mesenchymal transition; ovarian surface epithelium; transforming growth factor beta 1; wound repair.


Figures

Figure 1
Figure 1
Epithelial-to-mesenchymal transition in mOSE cells treated with TGFβ1 (10 ng/mL). A: mOSE cells display actin cytoskeletal rearrangement upon TGFβ1 treatment (4 d), as determined by ACTIN immunofluorescence (representative image, N = 6). B: TGFβ1 enhances mOSE cell migration for 24 h of treatment compared to untreated controls (N = 3, ANCOVA, R2 = 0.82 and 0.97 for control and TGFβ1 treatment respectively). C: TGFβ1 treatment of mOSE cells decreases CDH1 (91% at 96 h of treatment) compared to untreated controls, as determined by western blot. β-ACTIN was used as a loading control (representative western blot, N = 3, One-way ANOVA with Dunnett’s post-test). D: mOSE cells treated with TGFβ1 have increased Snail expression compared to untreated controls, as determined by Q-PCR (top) and western blot (bottom). β-ACTIN was used as a loading control. mOSE cells were treated with TGFβ1 for up to 168 h for Q-PCR and up to 96 h for western blot (N = 3, One-way ANOVA with Dunnett’s post-test). *** and **** indicate a significant difference from the untreated control group, P < 0.001 and P < 0.0001 respectively. Scale bar = 15 μm. RQ = relative quantity. Experiments were performed using cells under passage number 25.
Figure 2
Figure 2
Forced Snail expression induces a partial EMT in vitro. A: Inducible Snail (imSnail) in mOSE cells show increased SNAIL in the presence of doxycycline (200 ng/mL, 48 h) compared to the control mOSE cells bearing inducible GFP (iGFP), as determined by western blot. CDH1 levels remain unaffected by doxycycline treatment. β-ACTIN was used as a loading control (representative western blot, N = 3). B: imSnail mOSE cells do not show altered expression of EMT markers (Alcam, Krt19) in the presence of doxycycline for 48 h (N = 3, Student t-test). C: imSnail cells have a modestly increased migration in response to doxycycline treatment for up to 48 h (100 ng/mL), compared to iGFP cells, whereas their migration is not significantly different in the absence of doxycycline (control), as determined using a migration assay (N = 3, ANCOVA, R2 = 0.93 and 0.99 for untreated iGFP and imSnail cells respectively and 0.98 and 0.95 for Dox treated iGFP and imSnail cells respectively-). ** indicates a significant difference between treatment groups, P < 0.005. D: imSnail mOSE cells do not alter actin cytoskeletal organization in the presence of doxycycline, as determined by ACTIN immunofluorescence (representative image, N = 3). Scale bar = 100 μm. RQ = relative quantity. Experiments were performed using cells under passage number 25 and Snail expression was induced by treating cells with dox for 48 h prior to an experimental readout.
Figure 3
Figure 3
mOSE cells treated with TGFβ1 (10 ng/mL) increase Cox2 expression and PGE2 secretion. A–C: mOSE cells treated with TGFβ1 (4 days) have increased Cox2 expression as determined by a TGFβ1 Signaling Targets PCR array (A, N = 3, Student t-test), and validated by western blot (B, representative western blot, N = 3, One-way ANOVA with Dunnett’s post-test) and Q-PCR (C, N = 3, One-way ANOVA with Dunnett’s post-test). β-ACTIN was used as a loading control for the western blot. mOSE cells were treated with TGFβ1 up to 96 h. D: Cox2 expression is unaffected in imSnail mOSE cells treated with doxycycline (200 ng/mL, 48 h) as determined by Q-PCR (N = 3, Student t-test). E: mOSE cells treated with TGFβ1 have increased PGE2 production at 48 h after treatment, compared to untreated mOSE cells, determined by a PGE2-ELISA (N = 3, One-way ANOVA with Dunnett’s post-test). ** and *** indicate significant differences from the untreated control, P < 0.01 and P < 0.001 respectively. RQ = relative quantity. Experiments were performed using cells under passage number 25.
Figure 4
Figure 4
Constitutive Cox2 overexpression and PGE2 treatment promote cell survival through the PTGER4 receptor and activation of AKT signaling. A–C: mOSE cells either treated with PGE2 (8 μg/mL, up to 30 min), or overexpressing Cox2 (WPI-Cox2) have increased levels of P-AKT compared to control cells or mOSE cells infected with the vector control (WPI) as determined by western blot. β-ACTIN was used as a loading control (representative western blot, N = 3, One-way ANOVA with Dunnett’s post-test). D: mOSE cells treated with celecoxib (2 days) have reduced viability compared to control-treated mOSE cells (DMSO), as determined by an Alamar Blue assay (N = 3, Two-way ANOVA with Bonferroni’s post-test). E: WPI-Cox2 mOSE cells are more resistant to H2O2 treatment than WPI mOSE cells, as determined using an Alamar Blue assay after 2 days of treatment (N = 3, Two-way ANOVA with Bonferroni’s post-test). F: WPI mOSE cells cultured in low oxygen (5% O2, 6 days) have reduced viability compared to WPI-Cox2 mOSE cells which maintain their viability, as determined using an Alamar Blue assay (N = 3, Student t-test). G: WPI mOSE cells cultured under low oxygen have decreased proliferation at 4 days in culture whereas WPI-Cox2 mOSE cells maintain their proliferation rate at least until 6 days in culture (N = 3, Two-way ANOVA with Bonferroni’s post-test). H-I: Ptger4 knockout mOSE cells (Ptger4 KO) have reduced proliferation and viability compared to Ptger4 wildtype mOSE cells (wildtype), as determined using a growth curve (H, N = 3, Two-way ANOVA with Bonferroni’s post-test) and trypan blue exclusion (I, N = 3, Student t-test). J-K: The enhanced viability of WPI-Cox2 mOSE cells treated with H2O2 (100 μM, 48 h) compared to WPI mOSE cells is no longer present when pre-treated for 30 min with the P-AKT inhibitor MK-2206 (MK, 2 μM), as determined by an Alamar Blue assay (J, N = 3, Two-way ANOVA with Bonferroni’s post-test, AB = Alamar Blue). Western blot (K) was used to show the efficiency of P-AKT inhibition of the vehicle-treated (DMSO, D) and MK-treated (2 μM, 5 h) mOSE cells. β-ACTIN was used as a loading control for the western blot (representative western blot, N = 3). *, **, ***, **** indicate a significant difference from the untreated control or wildtype group, P < 0.05, 0.01, 0.001, and 0.0001, respectively. RFU = relative fluorescence units. Experiments were performed using cells under passage number 25.
Figure 5
Figure 5
Immunohistochemistry detecting COX2 during post-ovulatory wound repair. The granulosa cells in ovary sections collected prior to ovulation (6 h post-hCG) express COX2 whereas the OSE layer surrounding the antral follicles (indicated by the box and arrowhead) is negative for Cox2 expression. After ovulation (14–16 h post-hCG), the OSE layer surrounding the ovulatory wound site (indicated by the box and arrowhead) expresses COX2 whereas OSE surrounding non-ovulating sites remain negative for COX2 expression. Representative sections, N = 5. Scale bar = 100 μm.
Figure 6
Figure 6
RNA sequencing results of TGFβ1-treated mOSE cells (10 ng/mL, 96 h) shows increased ECM deposition with treatment. A: Volcano plot demonstrating increased expression of ECM deposition and remodeling genes observed with TGFβ1 treatment. Ptgs2 (Cox2) and Snail are also increased with TGFβ1 treatment whereas Krt19 is decreased with treatment. Fold change was determined by assessing the beta coefficient of the general linear models used for differential expression analysis B: Plot of significantly enriched terms upregulated and downregulated by TGFβ1 treatment. Experiments were performed using cells under passage number 25.

References

    1. Robker RL, Russell DL, Espey LL, Lydon JP, O’Malley BW, Richards JS. Progesterone-regulated genes in the ovulation process: ADAMTS-1 and cathepsin L proteases. PNAS 2000; 97:4689–4694. - PMC - PubMed
    1. Lim H, Paria BC, Das SK, Dinchuk JE, Langenbach R, Trzaskos JM, Dey SK. Multiple female reproductive failures in cyclooxygenase 2–deficient mice. Cell 1997; 91:197–208. - PubMed
    1. Richards JS. Ovulation: New factors that prepare the oocyte for fertilization. Mol Cell Endocrinol 2005; 234:75–79. - PubMed
    1. Singavarapu R, Buchinsky N, Cheon D-J, Orsulic S. Whole ovary immunohistochemistry for monitoring cell proliferation and ovulatory wound repair in the mouse. Reprod Biol Endocrinol 2010; 8:98. - PMC - PubMed
    1. Murdoch WJ. Ovarian surface epithelium during ovulatory and anovulatory ovine estrous cycles. Anat Rec 1994; 240:322–326. - PubMed

Publication types

Grants and funding