

Bayesian inference of distributed time delay in transcriptional and translational regulation
- PMID: 31347688
- PMCID: PMC7868000
- DOI: 10.1093/bioinformatics/btz574
Bayesian inference of distributed time delay in transcriptional and translational regulation
Abstract
Motivation: Advances in experimental and imaging techniques have allowed for unprecedented insights into the dynamical processes within individual cells. However, many facets of intracellular dynamics remain hidden, or can be measured only indirectly. This makes it challenging to reconstruct the regulatory networks that govern the biochemical processes underlying various cell functions. Current estimation techniques for inferring reaction rates frequently rely on marginalization over unobserved processes and states. Even in simple systems this approach can be computationally challenging, and can lead to large uncertainties and lack of robustness in parameter estimates. Therefore we will require alternative approaches to efficiently uncover the interactions in complex biochemical networks.
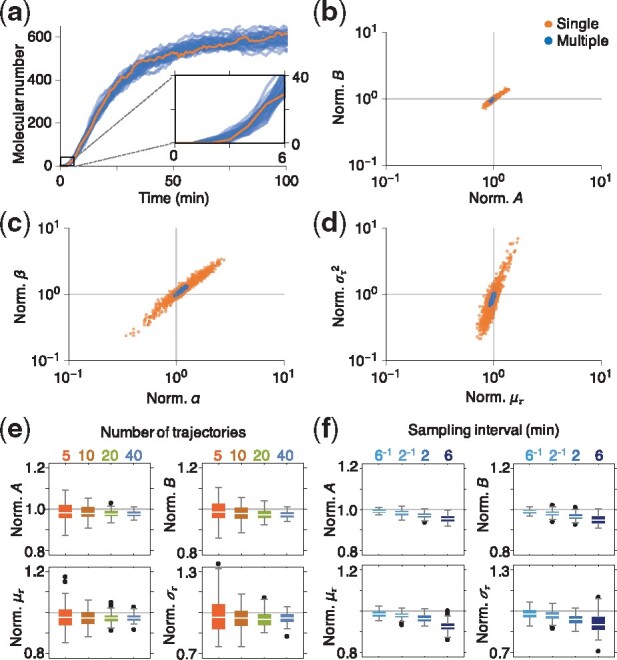
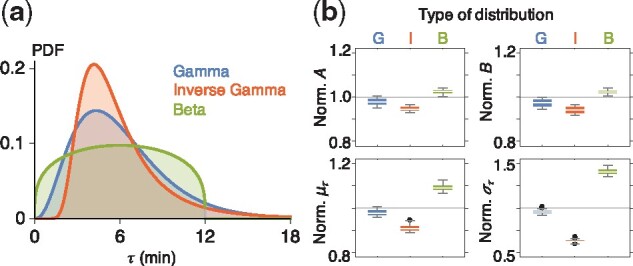
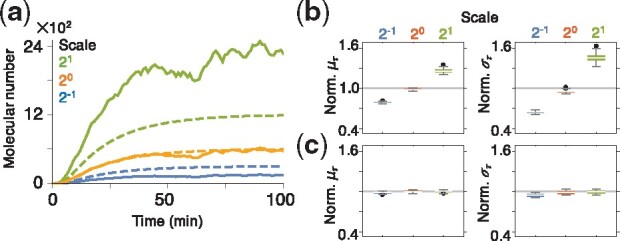
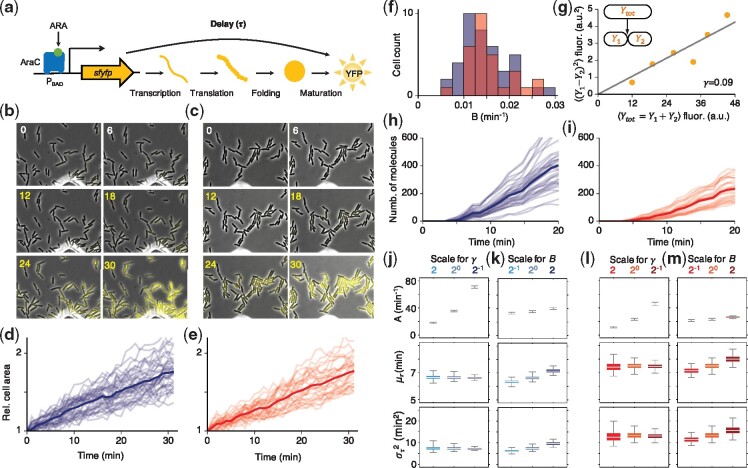
Results: We propose a Bayesian inference framework based on replacing uninteresting or unobserved reactions with time delays. Although the resulting models are non-Markovian, recent results on stochastic systems with random delays allow us to rigorously obtain expressions for the likelihoods of model parameters. In turn, this allows us to extend MCMC methods to efficiently estimate reaction rates, and delay distribution parameters, from single-cell assays. We illustrate the advantages, and potential pitfalls, of the approach using a birth-death model with both synthetic and experimental data, and show that we can robustly infer model parameters using a relatively small number of measurements. We demonstrate how to do so even when only the relative molecule count within the cell is measured, as in the case of fluorescence microscopy.
Availability and implementation: Accompanying code in R is available at https://github.com/cbskust/DDE_BD.
Supplementary information: Supplementary data are available at Bioinformatics online.
© The Author(s) 2019. Published by Oxford University Press. All rights reserved. For permissions, please e-mail: journals.permissions@oup.com.
Figures
Similar articles
-
Inferring delays in partially observed gene regulation processes.Bioinformatics. 2023 Nov 1;39(11):btad670. doi: 10.1093/bioinformatics/btad670. Bioinformatics. 2023. PMID: 37935426 Free PMC article.
-
Hierarchical Bayesian models of transcriptional and translational regulation processes with delays.Bioinformatics. 2021 Dec 22;38(1):187-195. doi: 10.1093/bioinformatics/btab618. Bioinformatics. 2021. PMID: 34450624 Free PMC article.
-
Exact Bayesian inference for phylogenetic birth-death models.Bioinformatics. 2018 Nov 1;34(21):3638-3645. doi: 10.1093/bioinformatics/bty337. Bioinformatics. 2018. PMID: 29718104
-
Filtering and inference for stochastic oscillators with distributed delays.Bioinformatics. 2019 Apr 15;35(8):1380-1387. doi: 10.1093/bioinformatics/bty782. Bioinformatics. 2019. PMID: 30202930 Free PMC article.
-
Bayesian inference of reaction kinetics from single-cell recordings across a heterogeneous cell population.Methods. 2015 Sep 1;85:22-35. doi: 10.1016/j.ymeth.2015.05.012. Epub 2015 May 15. Methods. 2015. PMID: 25986935 Review.
Cited by
-
Consistency across multi-omics layers in a drug-perturbed gut microbial community.Mol Syst Biol. 2023 Sep 12;19(9):e11525. doi: 10.15252/msb.202311525. Epub 2023 Jul 24. Mol Syst Biol. 2023. PMID: 37485738 Free PMC article.
-
Inferring delays in partially observed gene regulation processes.Bioinformatics. 2023 Nov 1;39(11):btad670. doi: 10.1093/bioinformatics/btad670. Bioinformatics. 2023. PMID: 37935426 Free PMC article.
-
Systematic inference identifies a major source of heterogeneity in cell signaling dynamics: The rate-limiting step number.Sci Adv. 2022 Mar 18;8(11):eabl4598. doi: 10.1126/sciadv.abl4598. Epub 2022 Mar 18. Sci Adv. 2022. PMID: 35302852 Free PMC article.
-
Incorporating age and delay into models for biophysical systems.Phys Biol. 2021 Feb 13;18(1):015002. doi: 10.1088/1478-3975/abc2ab. Phys Biol. 2021. PMID: 33075757 Free PMC article.
-
A general model-based causal inference method overcomes the curse of synchrony and indirect effect.Nat Commun. 2023 Jul 24;14(1):4287. doi: 10.1038/s41467-023-39983-4. Nat Commun. 2023. PMID: 37488136 Free PMC article.
References
-
- Anderson D.F. (2008) A modified next reaction method for simulating chemical systems with time dependent propensities and delays (vol 127, art no 214107, 2007). J. Chem. Phys., 128, 109903–109903-1. doi: 10.1063/1.2899331. - PubMed
-
- Austin D.W. et al. (2006) Gene network shaping of inherent noise spectra. Nature, 439, 608.. - PubMed
-
- Barrio M. et al. (2013) Reduction of chemical reaction networks through delay distributions. J. Chem. Phys., 138, 104114.. - PubMed
