. 2019 Nov;235(5):962-976.
doi: 10.1111/joa.13058. Epub 2019 Jul 26.

Myoarchitectural disarray of hypertrophic cardiomyopathy begins pre-birth

Affiliations

Myoarchitectural disarray of hypertrophic cardiomyopathy begins pre-birth

Patricia Garcia-Canadilla et al. J Anat. 2019 Nov.

Abstract

Myoarchitectural disarray - the multiscalar disorganisation of myocytes, is a recognised histopathological hallmark of adult human hypertrophic cardiomyopathy (HCM). It occurs before the establishment of left ventricular hypertrophy (LVH) but its early origins and evolution around the time of birth are unknown. Our aim is to investigate whether myoarchitectural abnormalities in HCM are present in the fetal heart. We used wild-type, heterozygous and homozygous hearts (n = 56) from a Mybpc3-targeted knock-out HCM mouse model and imaged the 3D micro-structure by high-resolution episcopic microscopy. We developed a novel structure tensor approach to extract, display and quantify myocyte orientation and its local angular uniformity by helical angle, angle of intrusion and myoarchitectural disarray index, respectively, immediately before and after birth. In wild-type, we demonstrate uniformity of orientation of cardiomyocytes with smooth transitions of helical angle transmurally both before and after birth but with traces of disarray at the septal insertion points of the right ventricle. In comparison, heterozygous mice free of LVH, and homozygous mice showed not only loss of the normal linear helical angulation transmural profiles observed in wild-type but also fewer circumferentially arranged myocytes at birth. Heterozygous and homozygous showed more disarray with a wider distribution than in wild-type before birth. In heterozygous mice, disarray was seen in the anterior, septal and inferior walls irrespective of stage, whereas in homozygous mice it extended to the whole LV circumference including the lateral wall. In conclusion, myoarchitectural disarray is detectable in the fetal heart of an HCM mouse model before the development of LVH.

Keywords: cardiac embryology; developmental biology; hypertrophic cardiomyopathy; myocardial disarray.


Conflict of interest statement

The authors declare no conflict of interest.

Figures

Figure 1
Figure 1
Normal myoarchitectural organisation and definition of local coordinates system and eigenvectors. In health, human cardiomyocytes are aggregated in bundles. Their helical orientation changes with progression through the thickness of the left ventricular (LV) wall with: left‐handed (negative angulation) longitudinally arranged cardiomyocytes in the epicardium; circumferentially arranged (0° angulation) cardiomyocytes in the mid‐wall; and right‐handed (positive angulation) longitudinally arranged cardiomyocytes in the endocardium (MacIver et al. 2018; Stephenson et al. 2018). We have recently reported how this gradual change in helical angulation (HA) is established early in fetal life (Garcia‐Canadilla et al. 2018). Cardiomyocytes also show a transmural orientation which is quantified by the transverse (TA) or intrusion angle. (a) Schematic representation of the region of interest (ROI) defined to calculate the structure tensor in a given voxel, formed by the voxel itself (in the centre of the cube – red square in left panel) and their eight nearest voxels. In this drawing, each cylinder represents a single cardiomyocyte. The middle panel illustrates the eigenvector system (v i, i = 1…3) and their ellipsoids obtained with structure tensor analysis in healthy (normal) vs. hypertrophic cardiomyopathy (disarray) showing high anisotropy represented by a flat ellipsoid (organised myocardium) vs. low anisotropy represented by a more spherical ellipsoid (disorganised myocardium). The right panel illustrates the calculation of the myoarchitectural disarray index (MDI) in the same ROI used to calculate the structure tensor. In this drawing, we have plotted the tertiary eigenvectors in the 2D plane indicated in grey in the right panel. MDI in a given voxel quantifies the collinearity or angular uniformity between the tertiary eigenvectors of the voxel itself (red square) and the tertiary eigenvectors of their nearest neighbours. In a normal/healthy cardiac tissue, all the eigenvectors have similar orientations, which means that they are highly collinear and therefore MDI is close to 1. However, when disarray is present, all the eigenvectors within the ROI have very different orientations, which means that the collinearity between all eigenvectors is very low and therefore MDI is close to 0. (b) Scheme defining local prolate spheroidal coordinates of the LV, with transmural (λ), longitudinal (μ) and circumferential (θ) axis and the helical (HA) and intrusion (IA) angles used to describe myocyte orientation. HA, denoted αH, is defined as the angle between the local short‐axis or circumferential plane and the tertiary eigenvector v 3. IA, denoted αI, is the angle between the local epicardial tangential plane and the tertiary eigenvector v 3. The vectors g 1, g 2 and g 3 form the prolate spheroidal coordinates basis and are calculated as: g1=fχλ, g2=fχμ and g3=fχθ, where χ = (x, y, z) are the Cartesian coordinates, and f is the semi‐foci distance.
Figure 2
Figure 2
Transmural LV change in helical (HA) and intrusion (IA) angle. Left ventricular (LV) transmural profiles of helical angle (HA) across septal (segments 2, 3 for the base; 8, 9 for middle; segment 14 for the apex) and lateral walls (segments 5, 6 for the base; 11, 12 for middle; segment 16 for the apex) for wild‐type (WT), heterozygous (HET) and homozygous (HO) knock‐out mice at (a) embryonic day (E) 18.5 and (c) post‐natal day (P) 0. LV transmural profile of intrusion angle (IA) across septal and lateral walls (same segments than HA) for WT, HET and HO knock‐out mice at (b) E18.5 and (d) P0. Solid lines: group means; Ribbons: ± standard deviation.
Figure 3
Figure 3
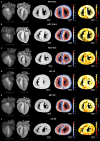
Volumetric representation of the developing murine heart and matching fibre tracking and myoarchitectural disarray index (MDI) colour maps for the mid LV. Whole‐heart volume‐rendered three‐dimensional (3D) high‐resolution episcopic microscopy reconstruction in (a,d) WT, (b,e) HET and (c,f) HO knock‐out mice at two stages: E18.5 (a–c) and P0 (d–f). LV hypertrophy is apparent in both HO and HET. Black/white inverted original episcopic microscopy images, myocyte tracking and MDI colour maps for a single representative mid LV slice are shown on the right. Other abbreviations as in Fig. 2.
Figure 4
Figure 4
Quantification of myocyte orientation (via helical and intrusion angles) and myoarchitectural disarray (via MDI). Left panel: local HA at three levels from LV base to apex at (a) E18.5 and (b) P0 in WT (top), HET (middle) and HO (bottom). Middle panel: local IA at three levels from LV base to apex at (c) E18.5 and (d) P0 in WT (top), HET (middle) and HO (bottom). Right panel: MDI at three levels from LV base to apex at (e) E18.5 and (f) P0 in WT (top), HET (middle) and HO (bottom). High MDI (near 1, yellow/white spectrum extreme) implies insignificant disarray, whereas low MDI (burgundy/black spectrum extreme) denotes disarray. Other abbreviations as in Fig. 2.
Figure 5
Figure 5
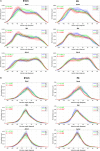
Averaged distribution of helical and intrusion angles in the LV. Histograms of (a) HA and (b) IA showing mean values across the basal, midventricular and apical LV slices of WT, HET and HO knock‐out mouse hearts at E18.5 (left) and P0 (right). Solid lines: group means. Ribbons: ± standard deviation. *Significantly different from wild‐type (WT) mice at same stage, < 0.05; **Significantly different from WT same stage, < 0.01; ***Significantly different from WT same stage, < 0.001. Other abbreviations as in Fig. 2.
Figure 6
Figure 6
Myocyte tracking in fetal murine hearts. 3D representation of the principal vector (tertiary eigenvector v 3) pointing in the long axis of cardiomyocytes for a single representative midventricular LV slice (top) in (a) WT, (b) HET and (c) HO knock‐out mice together with a zoom in the inferior septum (dashed yellow rectangle) in yx or parallel (middle) and zx or perpendicular (bottom) views, which illustrates local myoarchitectural disarray in HET and HO compared with WT mice. Other abbreviations as in Figs 2 and 3.
Figure 7
Figure 7
Bull's eye plots quantifying myoarchitectural disarray in developing murine HCM hearts. The 45‐segment bullseye plots of MDI at five levels from LV base to apex (nine segments per level) for WT, HET and HO mice at E18.5 and P0. Small MDI values (deep burgundy) denote a greater degree of myoarchitectural disarray. Other abbreviations as in Figs 2 and 3.
Figure 8
Figure 8
Averaged distribution of MDI in the LV. Histograms of MDI showing mean values across the basal, midventricular and apical LV slices of WT, HET and HO knock‐out mouse hearts at E18.5 (left) and P0 (right). Solid lines: group means. Ribbons: ± standard deviation. *Significantly different from WT same stage, < 0.05; **Significantly different from WT same stage, < 0.01; ***Significantly different from WT same stage, < 0.001. Other abbreviations as in Figs 2 and 3.

References

    1. Adomian GE, Beazell J (1986) Myofibrillar disarray produced in normal hearts by chronic electrical pacing. Am Heart J 112, 79–83. - PubMed
    1. Agger P, Ilkjær C, Laustsen C, et al. (2017) Changes in overall ventricular myocardial architecture in the setting of a porcine animal model of right ventricular dilation. J Cardiovasc Magn Reson 19, 1–16. - PMC - PubMed
    1. Ahrens J, Geveci B, Law C (2005) ParaView: an end‐user tool for large‐data visualization In: Visualization Handbook. (eds Hansen CD, Johnson CR), pp. 717–732, Elsevier.
    1. Ammirati E, Contri R, Coppini R, et al. (2016) Pharmacological treatment of hypertrophic cardiomyopathy: current practice and novel perspectives. Eur J Heart Fail 18, 1106–1118. - PubMed
    1. Baličević V, Lončarić S, Cárdenes R, et al. (2015) Assessment of Myofiber Orientation in High Resolution Phase‐Contrast CT Images, pp. 111–119. Cham: Springer.

Publication types