. 2019 Sep;52(5):e12663.
doi: 10.1111/cpr.12663. Epub 2019 Jul 26.

Caspase-3-mediated GSDME activation contributes to cisplatin- and doxorubicin-induced secondary necrosis in mouse macrophages

Affiliations

Caspase-3-mediated GSDME activation contributes to cisplatin- and doxorubicin-induced secondary necrosis in mouse macrophages

Feng-Yi Mai et al. Cell Prolif. 2019 Sep.

Abstract

Objective: Induction of secondary necrosis/pyroptosis contributes to the toxicity of chemotherapeutic drugs, in which gasdermin E (GSDME) plays critical roles. This study aimed to explore whether GSDME is involved in mediating the cytotoxic effects of cisplatin and doxorubicin on mouse macrophages.

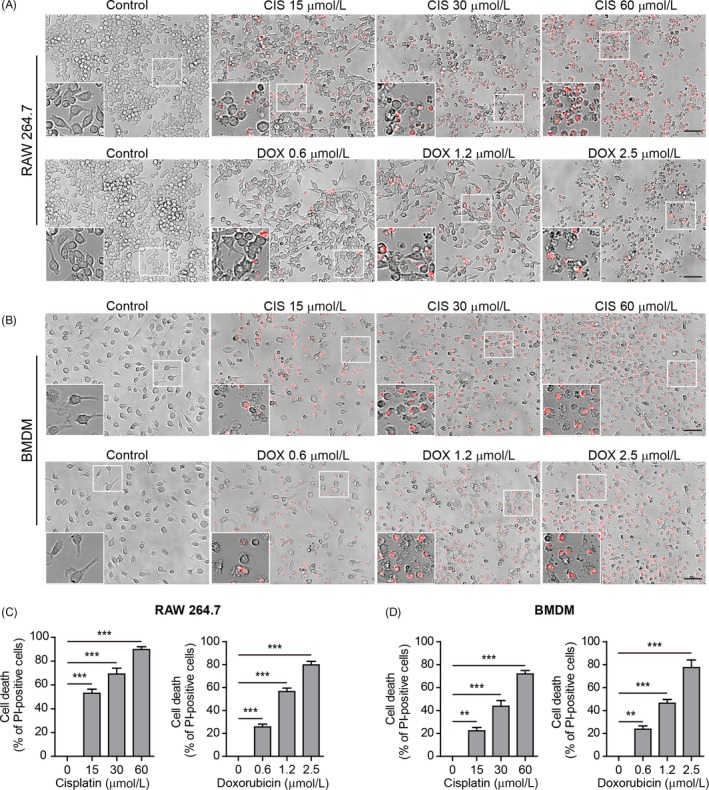
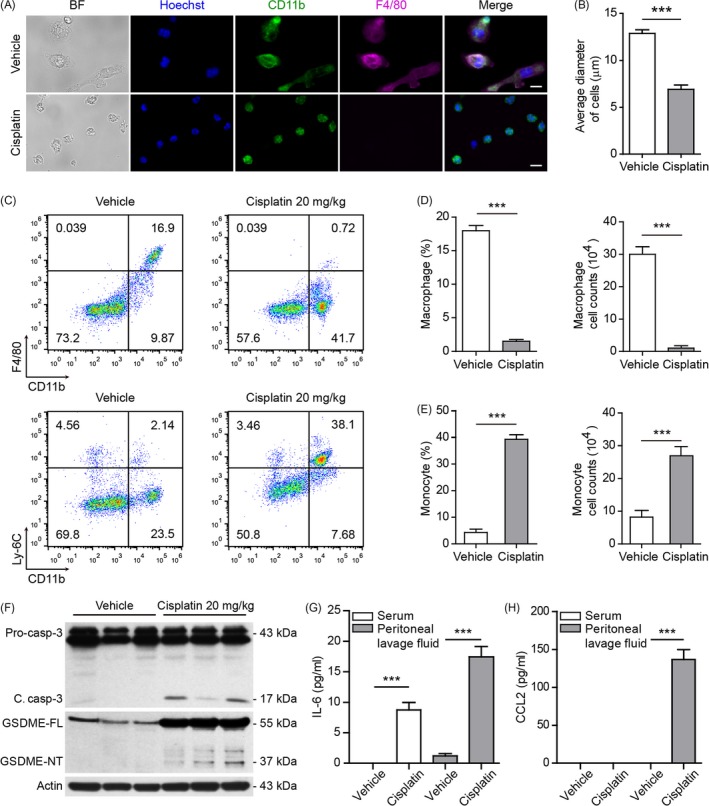
Methods: RAW 264.7 cells and bone marrow-derived macrophages (BMDMs) were treated with cisplatin or doxorubicin. Propidium iodide staining was used to assay necrosis, and immunoblotting was performed to detect protein expression. GSDME was knocked down by using small interfering RNA. Mice were injected intraperitoneally to evaluate toxicity to macrophages in vivo. Flow cytometry and immunofluorescence microscopy were adopted to analyse phenotypes of peritoneal cells. Cytokine levels were assayed by cytometric bead array.

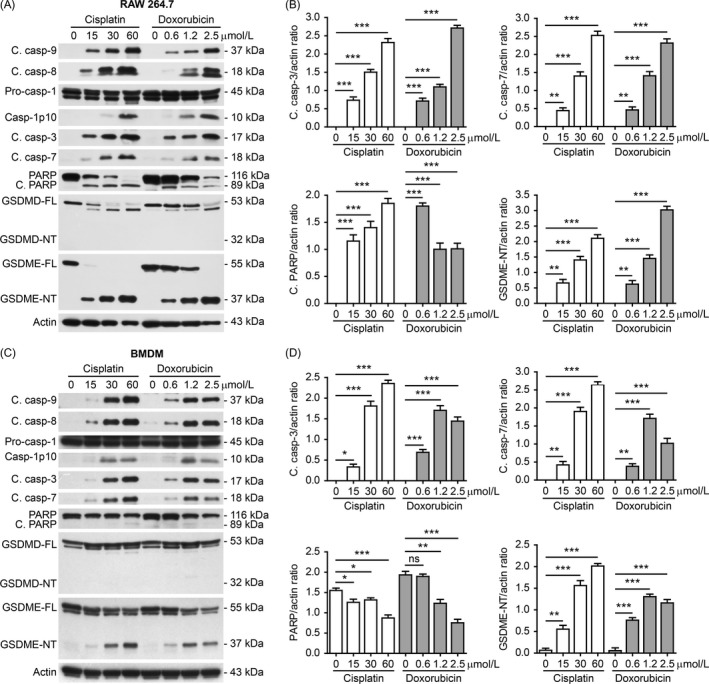
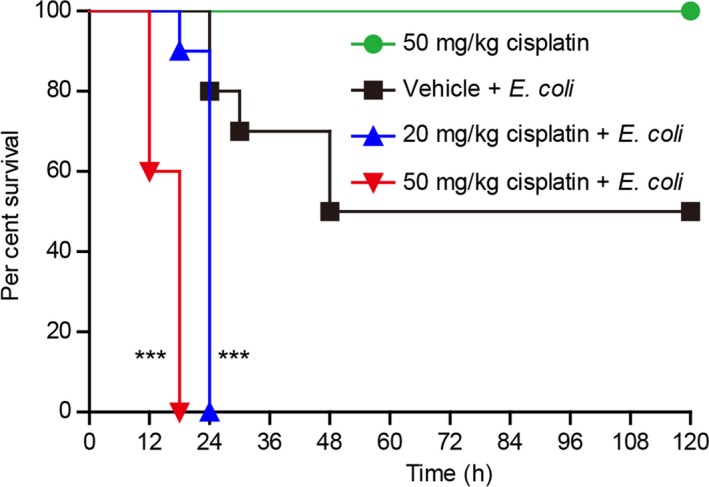
Results: Both cisplatin and doxorubicin dose-dependently induced necrosis in mouse RAW 264.7 macrophages and BMDMs. Accompanying this, multiple caspases were activated, concomitant with the cleavage of poly (ADP-ribose) polymerase. Consistent with caspase-3 activation, GSDME was cleaved to generate its N-terminal fragment (GSDME-NT), thus leading to secondary necrosis/pyroptosis. Inhibition of caspase-3 significantly attenuated the generation of GSDME-NT concurrently with decreased necrosis in macrophages. GSDME knockdown also evidently decreased the necrosis in RAW 264.7 and BMDMs. Besides, cisplatin administration depleted peritoneal macrophages in mice, which was associated with caspase-3 activation and GSDME-NT generation. Consistent with the macrophage depletion, cisplatin administration significantly decreased survival of mice with bacterial infection.

Conclusion: Chemotherapeutic cisplatin and doxorubicin exerted their cytotoxicity on macrophages partly by inducing caspase-3/GSDME-mediated secondary necrosis.

Keywords: caspase-3; chemotherapeutic drugs; gasdermin E; macrophages; secondary necrosis.


Conflict of interest statement

The authors have no conflicts of interest to declare.

Figures

Figure 1
Figure 1
Cisplatin‐ and doxorubicin‐induced necrosis in mouse macrophages in culture. A, RAW 264.7 cells were treated with graded concentrations of cisplatin and doxorubicin for 16 h. Lytic cell death (necrosis) was assayed by propidium iodide (PI) staining (positive staining for dying cells). Images were captured by fluorescence microscopy, merged with bright‐field ones. One set of representative images of three independent experiments are shown. Scale bars, 50 μm. B, Representative images showing necrosis in bone marrow‐derived macrophages (BMDMs) treated as in (A). The inset represents a magnified area of each image. C,D, Quantification of PI‐positive cells in 5 randomly chosen fields each containing ~100 cells in (A) and (B), respectively. Data are shown as mean ± SD (n = 5). **P < .01; ***P < .001
Figure 2
Figure 2
Multiple caspase pathways were activated in mouse macrophages in response to cisplatin and doxorubicin. A, RAW 264.7 cells were treated with graded concentrations of cisplatin and doxorubicin for 16 h. Western blot analysis of indicated proteins in the cell lysates was performed. Actin was recruited as a loading control. B, Western blotting of indicated proteins in bone marrow‐derived macrophages (BMDMs) treated as in (A). C,D, The ratios of indicated proteins in (A) and (B) were quantified relatively to their respective actin by densitometry. Data are shown as mean ± SD (n = 3). *P < .05; **P < .01; ***P < .001; ns, not significant; GSDME‐NT, GSDME N‐terminal fragment; GSDME‐FL, full‐length GSDME
Figure 3
Figure 3
Inhibition of caspase‐3 and caspase‐1 attenuated cisplatin‐induced necrosis in mouse macrophages. A,B, RAW 264.7 cells (A) and bone marrow‐derived macrophages (BMDMs) (B) were pre‐treated with gradient doses of Ac‐DEVD‐CHO (caspase‐3 inhibitor) or VX‐765 (caspase‐1 inhibitor) for 1 h, followed by incubation with indicated dose of cisplatin (30 μmol/L) for 16 h. Necrosis was assayed by propidium iodide (PI) staining and observed with fluorescence microscopy. PI‐positive cells in 5 randomly chosen fields each containing ~100 cells were quantified. Data are shown as mean ± SD (n = 5). *P < .05; **P < .01; ***P < .001; ns, not significant. C,D, Western blot analysis of indicated proteins in RAW 264.7 cells (C) and BMDMs (D) were pre‐treated with Ac‐DEVD‐CHO (100 µmol/L) or VX‐765 (100 µmol/L) for 1 h and then incubated with cisplatin (30 µmol/L) for 16 h. Actin was used as a loading control. GSDME‐NT, GSDME N‐terminal fragment; GSDME‐FL, full‐length GSDME; C. casp, cleaved caspase
Figure 4
Figure 4
GSDME knockdown attenuated cisplatin or doxorubicin‐induced necrosis in macrophages. RAW 264.7 cells (A,B) and bone marrow‐derived macrophages (BMDMs) (C,D) were transfected with negative control (NC) siRNA or GSDME siRNA for 48 h, respectively. The cells were then treated with indicated doses of cisplatin and doxorubicin for 16 h. a, c Knockdown efficiency of GSDME in RAW 264.7 cells (A) and BMDM (C) was analysed by Western blotting. Actin was recruited as a loading control. Histograms show the amounts of GSDME levels relative to actin (n = 3). B,D, Necrosis in RAW 264.7 cells (B) and BMDMs (D) was measured by propidium iodide staining together with fluorescence microscopy. PI‐positive cells in 5 randomly chosen fields each containing ~100 cells were quantified. Data are shown as mean ± SD (n = 5). **P < .01; ***P < .001; ns, not significant
Figure 5
Figure 5
Cisplatin administration depleted peritoneal macrophages, activated caspase‐3 and caused cleavage of GSDME in vivo. A, Mice were administered (ip) with cisplatin or vehicle once. After 16 h, peritoneal exudate cells were isolated and seeded in glass‐bottom culture dishes for 4 h. The attached cells were fixed and stained with antibodies against CD11b and F4/80. Nuclei were revealed by Hoechst 33342. Representative images captured by fluorescence microscopy are shown. Scale bars, 10 μm. B, Quantification of average cell diameters in each group. Data are shown as mean ± SD (n = 50). C, Flow cytometric analysis of macrophages (CD11b+F4/80+) and monocytes (CD11b+Ly‐6C+) in the peritoneal cavity after bacterial infection. One representative set of flow cytometric dot plots are shown. CD11b+F4/80+ cells (D) and CD11b+Ly‐6C+ cells (E) in (C) were quantified by their percentages times the total peritoneal cell numbers (determined by a hemocytometer), respectively. Data are expressed as mean ± SD (n = 3). ***P < .001. F, Western blot analysis of caspase‐3 and GSDME in the peritoneal exudate cells in mice (n = 3). The blots of three individual mice in each group were displayed. Actin was used as a loading control for cell lysates. G,H, IL‐6 (G) and CCL2 (H) in mouse serum and peritoneal lavage fluids were measured by cytometric bead array. Data are shown as mean ± SD (n = 3). ***P < .001
Figure 6
Figure 6
Cisplatin administration reduced the survival of mice with bacterial infection. Mice were administered (ip) with cisplatin or vehicle once 3 h before injection (ip) with viable E coli (1.5 × 109 CFU/mouse). Mouse survival was monitored every 6 h for five consecutive days. Kaplan‐Meier survival curves were used to analyse the data (10 mice per group). The significance was evaluated by the log‐rank (Mantel–Cox) test. ***P < .001

References

    1. Cheung‐Ong K, Giaever G, Nislow C. DNA‐damaging agents in cancer chemotherapy: serendipity and chemical biology. Chem Biol. 2013;20:648‐659. - PubMed
    1. Dasari S, Tchounwou PB. Cisplatin in cancer therapy: molecular mechanisms of action. Eur J Pharmacol. 2014;740:364‐378. - PMC - PubMed
    1. Nitiss JL. Targeting DNA topoisomerase II in cancer chemotherapy. Nat Rev Cancer. 2009;9:338‐350. - PMC - PubMed
    1. Roos WP, Kaina B. DNA damage‐induced cell death by apoptosis. Trends Mol Med. 2006;12:440‐450. - PubMed
    1. Wang Y, Gao W, Shi X, et al. Chemotherapy drugs induce pyroptosis through caspase‐3 cleavage of a gasdermin. Nature. 2017;547:99‐103. - PubMed

MeSH terms