. 2019 Jul 26;14(7):e0220061.
doi: 10.1371/journal.pone.0220061. eCollection 2019.

Consistency and differences between centrality measures across distinct classes of networks

Affiliations

Consistency and differences between centrality measures across distinct classes of networks

Stuart Oldham et al. PLoS One. .

Abstract

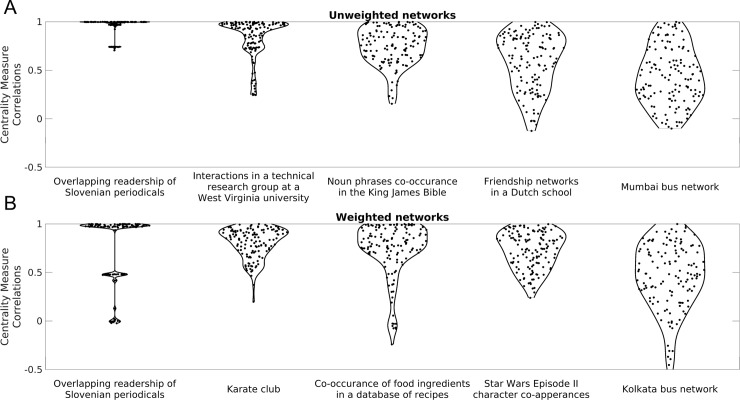
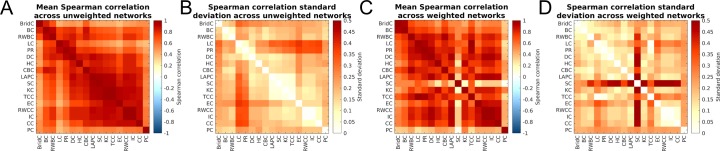
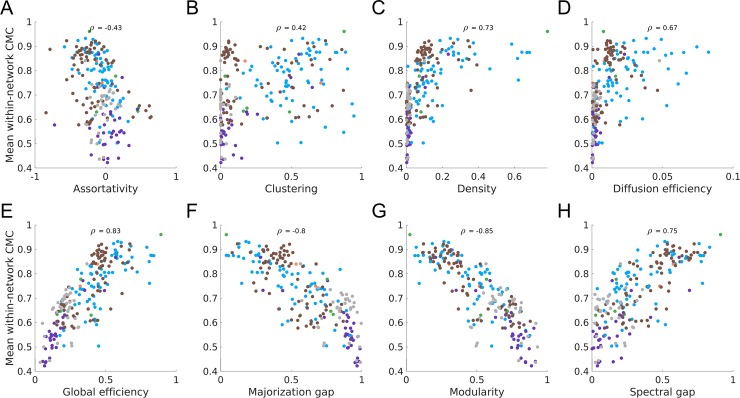
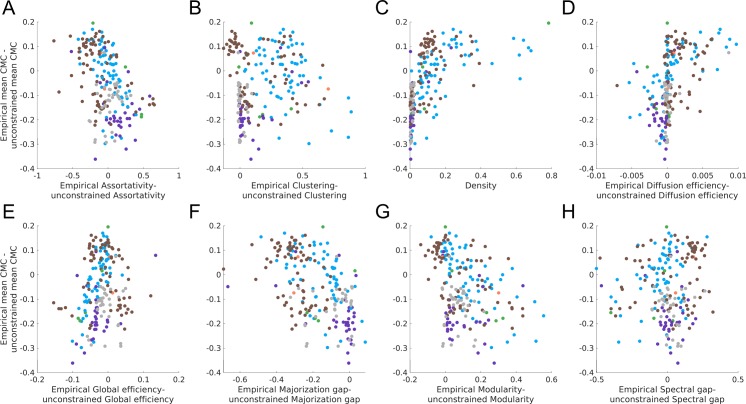
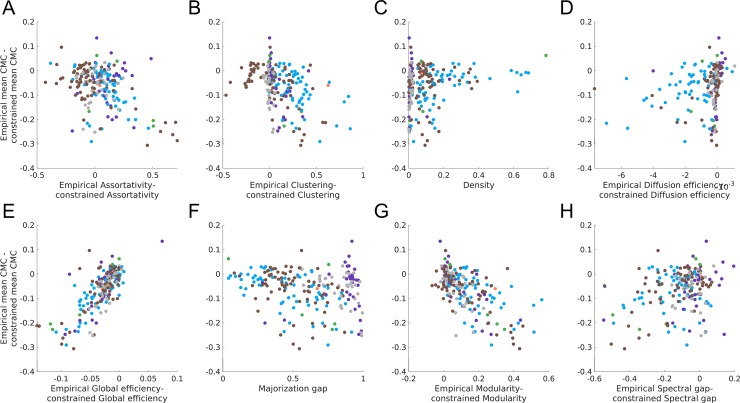
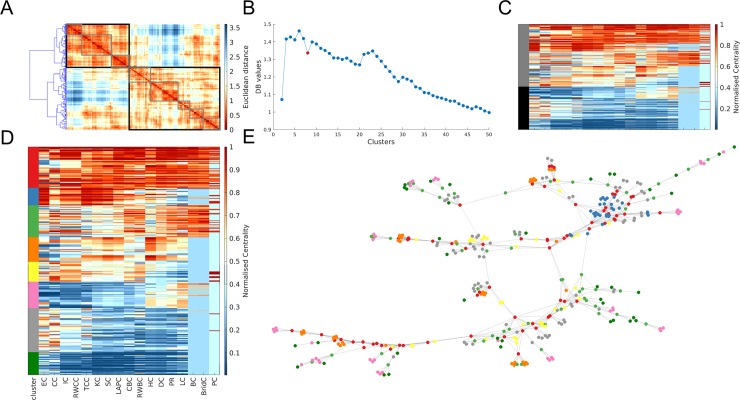
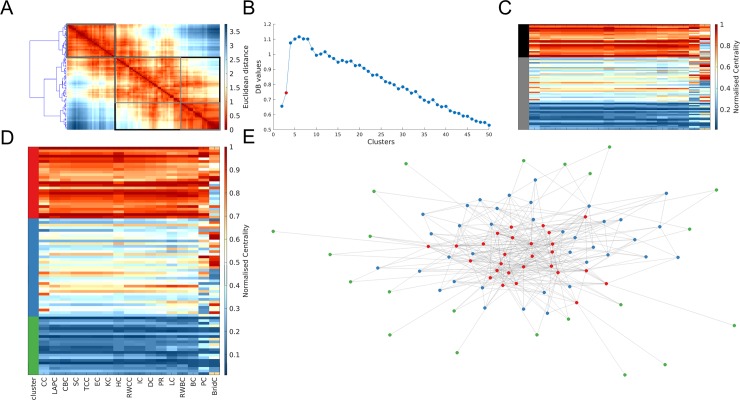
The roles of different nodes within a network are often understood through centrality analysis, which aims to quantify the capacity of a node to influence, or be influenced by, other nodes via its connection topology. Many different centrality measures have been proposed, but the degree to which they offer unique information, and whether it is advantageous to use multiple centrality measures to define node roles, is unclear. Here we calculate correlations between 17 different centrality measures across 212 diverse real-world networks, examine how these correlations relate to variations in network density and global topology, and investigate whether nodes can be clustered into distinct classes according to their centrality profiles. We find that centrality measures are generally positively correlated to each other, the strength of these correlations varies across networks, and network modularity plays a key role in driving these cross-network variations. Data-driven clustering of nodes based on centrality profiles can distinguish different roles, including topological cores of highly central nodes and peripheries of less central nodes. Our findings illustrate how network topology shapes the pattern of correlations between centrality measures and demonstrate how a comparative approach to network centrality can inform the interpretation of nodal roles in complex networks.


Conflict of interest statement

The authors have declared that no competing interests exist.

Figures

Fig 1
Fig 1. Basic properties of topological centrality.
Panel A shows an example of a star network. The red node has maximal degree (greatest number of connections), closeness (is a short distance from other nodes) and betweenness (lies on many shortest-paths between nodes) in this network. In this case these three centrality measures are perfectly concordant. Panel B shows a network in which centrality measures are not concordant. The red node has the highest betweenness and closeness, but it has the lowest degree in the network.
Fig 2
Fig 2. Distributions of Centrality Measure Correlations (CMCs) for example unweighted and weighted networks.
Distributions of CMCs for every pair of centrality measures for five example unweighted (panel A); and weighted networks (panel B). Networks have been ordered from highest (left) to lowest (right) median CMC.
Fig 3
Fig 3. Mean and standard deviation of between-network CMCs.
Panels A and B show the between-network CMC mean and standard deviation for unweighted measures, respectively. Panels C and D show the between-network CMCs mean and standard deviation for weighted measures, respectively.
Fig 4
Fig 4. Association between mean within-network CMC and network properties in unweighted networks.
The association between the mean within-network CMC (the average of all CMCs within a single network) and each of the global topological properties. Networks are coloured by their natural category (blue = social, grey = technological, brown = biological, orange = informational, purple = transportation; green = economic).
Fig 5
Fig 5. Difference between unweighted empirical and unconstrained surrogates in mean within-network CMC and network properties.
The y-axis of each plot shows the difference between the empirical networks and unconstrained surrogates mean within-network CMC. The x-axis shows the difference between the empirical networks and unconstrained surrogates on a particular property (except for panel C as the unconstrained surrogates have the same density as the empirical network). On both axis, except for the x-axis in panel C, a negative value indicates the empirical network had a lower value than the mean value of the surrogates, while a positive value indicates the empirical networks had a larger value. Points are coloured by the natural category of the empirical network (blue = social, grey = technological, brown = biological, orange = informational, purple = transportation; green = economic).
Fig 6
Fig 6. Difference between unweighted empirical and constrained surrogates in mean within-network CMC and network properties.
The y-axis of each plot shows the difference between the empirical networks and constrained surrogates mean within-network CMC. The x-axis shows the difference between the empirical networks and constrained surrogates on a particular property (except for panels C and F as the constrained surrogates have the same density and majorization gap as the empirical network). On both axis, except for the x-axis in panels C and F, a negative value indicates the empirical network had a lower value than the mean value of the surrogates, while a positive value indicates the empirical networks had a larger value. Points are coloured by the natural category of the empirical network (blue = social, grey = technological, brown = biological, orange = informational, purple = transportation; green = economic).
Fig 7
Fig 7. Multivariate centrality profiling of the network science author collaboration network.
Panel A shows the dendrogram projected alongside the distance matrix of node pairs (ranks scores were normalised to be in the range 0–1 with 1 indicating the highest rank). The black and grey boxes and indicate the clusters when a two-cluster and eight-cluster solution is used, respectively. Panel B displays the results for the Davies-Bouldin (DB) criterion. A lower DB value represents a better clustering solution. The solution shown in panels D and E is labelled in red. Only the first 50 clustering solutions are shown for ease of visibility. Panel C shows the matrix of nodal centrality scores (each row is a node and each column is a measure) and how these are clustered in a two-cluster solution (the black and grey represent the two different clusters). Panel D shows the matrix of nodal centrality scores as well as the clusters each node was assigned to. Panel E shows a topological representation of the network, produced using the force-directed layout algorithm, where each node is coloured according to the cluster it was allocated to in panel D.
Fig 8
Fig 8. Multivariate centrality profiling of trophic-level species interactions in a New Zealand stream.
Panel A shows the dendrogram projected alongside the distance matrix of node pairs (ranks scores were normalised to be in the range 0–1 with 1 indicating the highest rank). The black and grey boxes and indicate the clusters when a two-cluster and three-cluster solution is used, respectively. Panel B displays the results for the Davies-Bouldin (DB) criterion. A lower DB value represents a better clustering solution. The solution shown in panels D and E is labelled in red. Only the first 50 clustering solutions are shown for ease of visibility. Panel C shows the matrix of nodal centrality scores (each row is a node and each column is a measure) and how these are clustered in a two-cluster solution (the black and grey represent the two different clusters). Panel D shows the matrix of nodal centrality scores as well as the clusters each node was assigned to. Panel E shows a topological representation of the network, produced using the force-directed layout algorithm, where each node is coloured according to the cluster it was allocated to in panel D.

References

    1. Borgatti SP. Centrality and network flow. Soc Networks. 2005;27: 55–71. 10.1016/j.socnet.2004.11.008 - DOI
    1. Borgatti SP, Everett MG. A Graph-theoretic perspective on centrality. Soc Networks. 2006;28: 466–484. 10.1016/j.socnet.2005.11.005 - DOI
    1. Freeman LC. Centrality in social networks conceptual clarification. Soc Networks. 1978;1: 215–239. 10.1016/0378-8733(78)90021-7 - DOI
    1. Fornito A, Zalesky A, Bullmore E. Fundamentals of Brain Network Analysis. London: Academic Press; 2016.
    1. Bell DC, Atkinson JS, Carlson JW. Centrality measures for disease transmission networks. Soc Networks. 1999;21: 1–21. 10.1016/S0378-8733(98)00010-0 - DOI

Publication types