

Performance comparison of the Maxim and Sedia Limiting Antigen Avidity assays for HIV incidence surveillance
- PMID: 31348809
- PMCID: PMC6660077
- DOI: 10.1371/journal.pone.0220345
Performance comparison of the Maxim and Sedia Limiting Antigen Avidity assays for HIV incidence surveillance
Abstract
Background: Two manufacturers, Maxim Biomedical and Sedia Biosciences Corporation, supply CDC-approved versions of the HIV-1 Limiting Antigen Avidity EIA (LAg) for detecting 'recent' HIV infection in cross-sectional incidence estimation. This study assesses and compares the performance of the two assays for incidence surveillance.
Methods: We ran both assays on a panel of 2,500 well-characterized HIV-1-infected specimens. We analysed concordance of assay results, assessed reproducibility using repeat testing and estimated mean durations of recent infection (MDRIs) and false-recent rates (FRRs) for a range of normalized optical density (ODn) thresholds, alone and in combination with viral load thresholds. We defined three hypothetical surveillance scenarios, similar to the Kenyan and South African epidemics, and a concentrated epidemic. These scenarios allowed us to evaluate the precision of incidence estimates obtained by means of various recent infection testing algorithms (RITAs) based on each of the two assays.
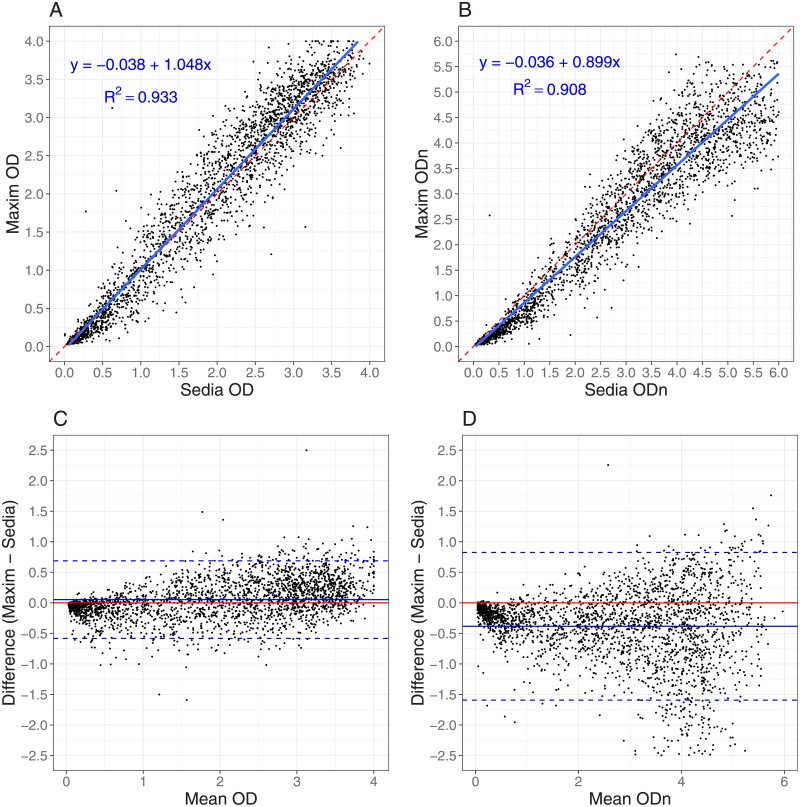
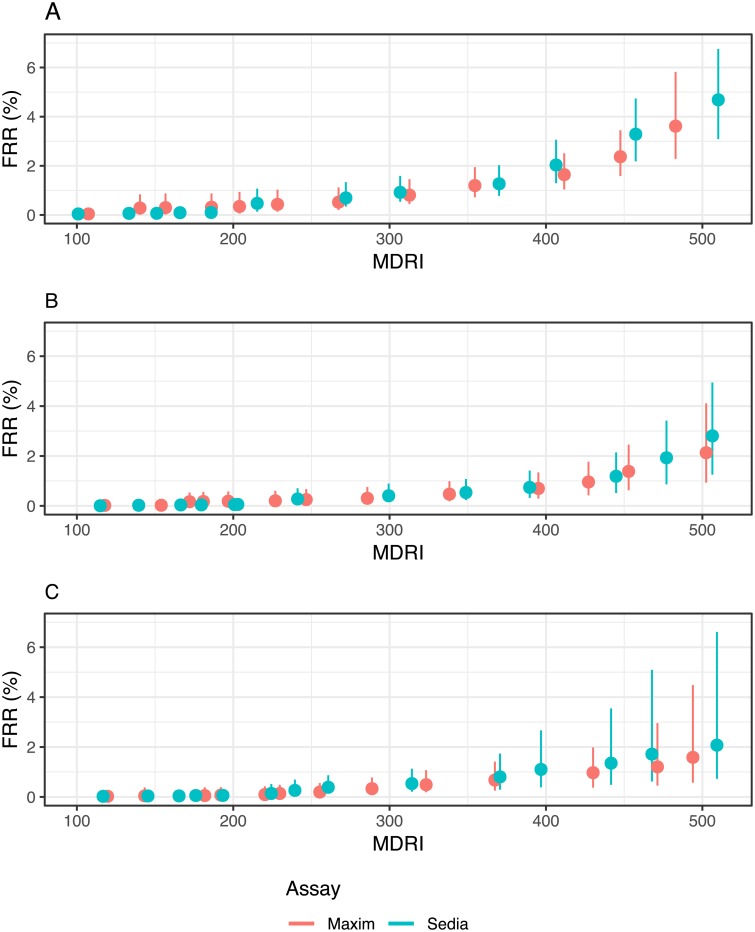
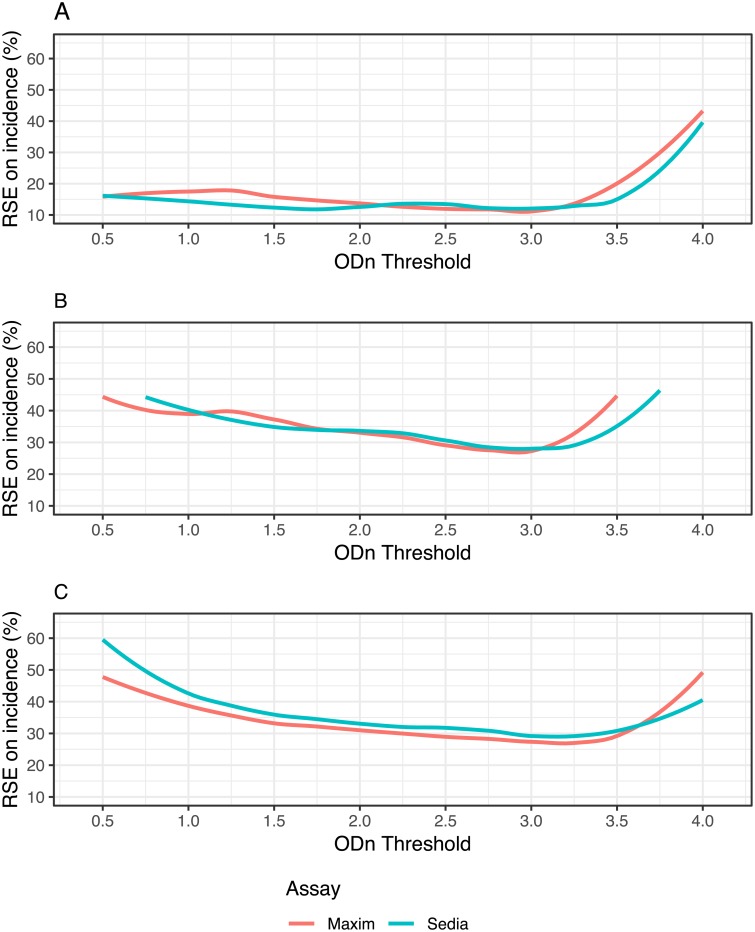
Results: The Maxim assay produced lower ODn values than the Sedia assay on average, largely as a result of higher calibrator readings (mean OD of 0.749 vs. 0.643), with correlation of normalized readings lower (R2 = 0.908 vs. R2 = 0.938). Reproducibility on blinded control specimens was slightly better for Maxim. The MDRI of a Maxim-based algorithm at the 'standard' threshold (ODn ≤1.5 & VL >1,000) was 201 days (95% CI: 180,223) and for Sedia 171 (152,191). The difference Differences in MDRI were estimated at 32.7 (22.9,42.8) and 30.9 days (21.7,40.7) for the two algorithms, respectively. Commensurately, the Maxim algorithm had a higher FRR in treatment-naive subjects (1.7% vs. 1.1%). The two assays produced similar precision of incidence estimates in the three surveillance scenarios.
Conclusions: Differences between the assays can be primarily attributed to the calibrators supplied by the manufacturers. Performance for surveillance was extremely similar, although different thresholds were optimal (i.e. produced the lowest variance of incidence estimates) and at any given ODn threshold, different estimates of MDRI and FRR were obtained. The two assays cannot be treated as interchangeable: assay and algorithm-specific performance characteristic estimates must be used for survey planning and incidence estimation.
Conflict of interest statement
M.P.B., E.G., S.N.F., D.H., A.W. and G.M. receive grant support and/or consulting fees from Sedia Biosciences Corporation for evaluation of a separate assay. Sedia Biosciences Corporation had no role in the study design, data collection and analysis, decision to publish, or preparation of the manuscript. S.N.F. and N.P. are affiliated with commercial entities. This does not alter our adherence to PLOS ONE policies on sharing data and materials.
Figures
References
-
- McDougal JS, Parekh BS, Peterson ML, Branson BM, Dobbs T, Ackers M, et al. Comparison of HIV type 1 incidence observed during longitudinal follow-up with incidence estimated by cross-sectional analysis using the BED capture enzyme immunoassay. AIDS Research and Human Retroviruses. 2006;22(10):945–52. 10.1089/aid.2006.22.945 - DOI - PubMed
