. 2019 Jul 25;178(3):567-584.e19.
doi: 10.1016/j.cell.2019.06.030.

Antibody Lineages with Vaccine-Induced Antigen-Binding Hotspots Develop Broad HIV Neutralization

Affiliations

Antibody Lineages with Vaccine-Induced Antigen-Binding Hotspots Develop Broad HIV Neutralization

Rui Kong et al. Cell. .

Abstract

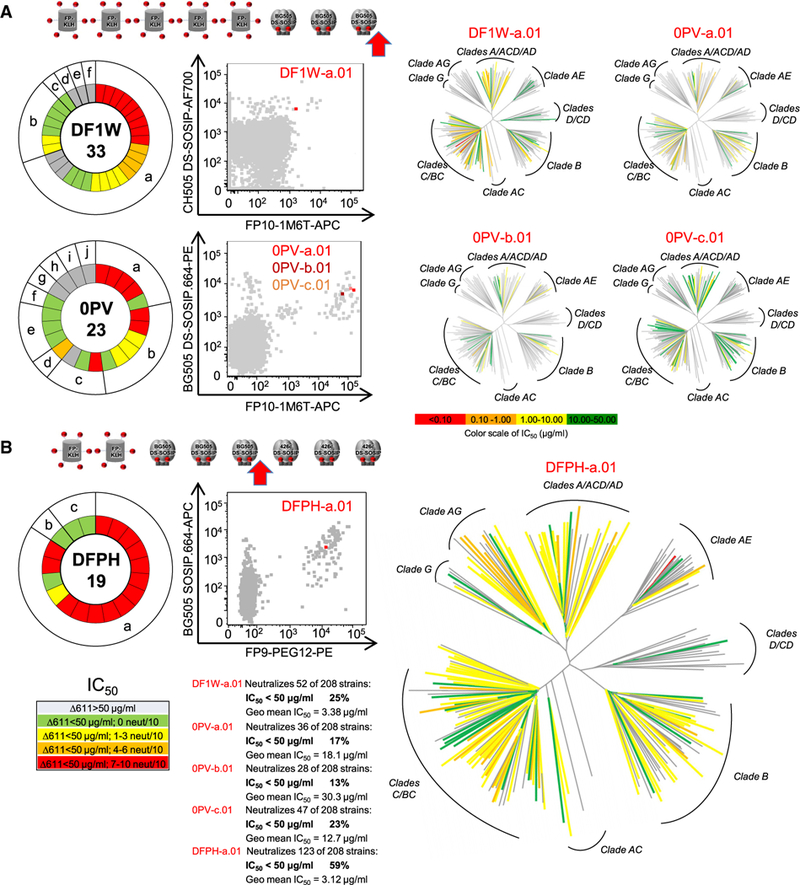
The vaccine-mediated elicitation of antibodies (Abs) capable of neutralizing diverse HIV-1 strains has been a long-standing goal. To understand how broadly neutralizing antibodies (bNAbs) can be elicited, we identified, characterized, and tracked five neutralizing Ab lineages targeting the HIV-1-fusion peptide (FP) in vaccinated macaques over time. Genetic and structural analyses revealed two of these lineages to belong to a reproducible class capable of neutralizing up to 59% of 208 diverse viral strains. B cell analysis indicated each of the five lineages to have been initiated and expanded by FP-carrier priming, with envelope (Env)-trimer boosts inducing cross-reactive neutralization. These Abs had binding-energy hotspots focused on FP, whereas several FP-directed Abs induced by immunization with Env trimer-only were less FP-focused and less broadly neutralizing. Priming with a conserved subregion, such as FP, can thus induce Abs with binding-energy hotspots coincident with the target subregion and capable of broad neutralization.

Keywords: B cell ontogeny; HIV-1 vaccine; broadly neutralizing antibody; fusion peptide; immune monitoring; interaction hotspot; multidonor antibody class.


Figures

Figure 1.
Figure 1.. FP-Directed Neutralizing Abs Arise by Vaccination and Achieve up to 59% Neutralization Breadth
(A) Abs were isolated by single-cell sorting of B cells after eight immunizations (red arrow), using FP (FP10–1M6T) and Env trimer (BG505 DS-SOSIP or CH505 DSSOSIP) probes (middle). Abs are summarized by pie chart, with clones of each lineage colored individually based on the color key on bottom left (neutralization data for individual Abs shown in Table S1A). Animal name and total number of clones recovered are indicated at center of each pie chart. The broadest Abs of each lineage, if able to neutralize at least 7 strains of the 10-strain panel, were characterized on the 208-strain panel, with neutralization shown on dendrograms colored by IC50 (color scale bar at center). (B) Abs from NHP DFPH after five immunizations (red arrow) were isolated and are displayed as described in (A). see also Figure S1 and S7 and Table S1 and S2.
Figure 2.
Figure 2.. Crystal and Cryo-EM Structures for Five FP-Directed Abs Reveal Two Vaccine-Elicited FP-Directed Lineages to Be from the Same Ab Class
(A) Approach angles for five FP-directed Abs induced by vaccination of NHP. Cryo-EM structures were determined for quaternary complexes of BG505 Env trimer in complex with a FP-directed Fab and two additional Fabs, PGT122 and VRC03,which were used as fiducials; both FP-directed Fab and Env trimer are displayed here. Angles shown represent the 2D projection of FP-Fab approach along the X, Y plane of the trimer axis or the X, Z plane of the protomer axis. A summary of percentage volume overlap of the Fv-domains and their relative rotation angles in the structural superposition is listed in Table S4C. (B-D) Close-ups of detailed Ab-trimer interactions for DF1W-a.01 (B); 0PV-a.01, 0PV-b.01, and 0PV-c.01 (C); and DFPH-a.15 (D). Env trimer is kept in the same orientation for comparison and colored green for gp120 and gray for gp41. Ab light chains are colored yellow, and heavy chains are individually colored. (E) Superposition of crystal structures of 0PV-c and DFPH-a in complex with FP reveals highly similar FP conformation and interactions with Ab. (F) Sequence signatures of the reproducible Ab class for FP binding. Immunoglobulin heavy chains of both Abs utilize the same germline genes. Germline HV4- AGR, HD3–14, and HJ5–1 encoded nucleotides and amino acid residues are shown in black, with residues derived from N- and P-nucleotide addition in light blue and residues that have undergone SHM in red. Nucleotides trimmed by exonuclease are indicated with strikethrough. Conserved FP-interacting CDR H3 residues are highlighted with black boxes; SHM-derived Arg100 HC of 0PV-c.01 is highlighted with a red box. (G) FP interactions with HV, HD, and LV motifs in the 0PV-c.01-FP complex are shown in three panels, each displaying conserved side chains in space-filling representations. Details of the motifs and compatible genes are described below each panel. See also Figures S4 and S5 and Tables S1C, S4, and S5A-S5D.
Figure 3.
Figure 3.. Developmental Pathway for the DF1W-a Lineage Reveals How FP Priming Creates a Binding-Energy Hotspot Focused on the Conserved N Terminus of FP
(A) Single-cell sorting of IgG+ B cells for binding to FP and Env trimer at indicated time points. B cells were probed with BG505 DS-SOSIP.664 trimer and FP scaffold FP10–1M6T. Percentages of total IgG+ B cells binding to trimer, FP, or both are denoted on the plots. (B) Frequencies of double-positive B cells and normalized frequencies of DF1W-a lineage heavyor light chains in IgG B cell repertoiresdetected by NGS analysis. HC, heavy chain; LC, light chain. (C) Maximum-likelihood phylogenetic trees of DF1W-a lineage heavy- and light-chains, rooted on the germline genes. Intermediates separating time points were highlighted with solid circles. (D) SHM (mean ± SD) levels of DF1W lineage sequences from NGS and single-cell sorting analysis. The number of identified Ab sequences is labeled above each bar. (E) Mapping of SHM residues at post-3, post-5, and post-8 time points onto the cryo-EM structure of the DF1W-a.01-trimer complex. FP and residues altered by SHM are highlighted in sphere representation,with SHM altered residues color-coded according to the time point where the SHM was observed. Binding affinities of the Ab at each time point to the Env trimer and FP10–1M6T are listed under each panel. Number of strains of a 9-virus panel neutralized by these Abs are also shown. *UCA differed from MRCA by two nucleotides in heavy chain and by three amino acids in the light chain, which were reverted to germline (Table S5E); post-3 and post-5 Abs had the following heavy:light pairings, I3:I3/I5 and I5:I3/I5, respectively, while post-8 refers to Ab DF1W-a.01. (F) Mutational antigenic profiling of DF1W-a.01. The positive site differential selection is plotted across the length of the mutagenized portion of Env sequence(top panel). Regions of interest are expanded in logo plots in the lower panel (underlined and labeled in red in both the top and bottom plots). The height of each amino acid is proportional to its differential selection, which is the logarithm of the relative enrichment of that mutation in the Ab-selected condition relative to the non-selected control. (G) Surface representation of the DF1W-a.01 functional epitope on the Env trimer. Env trimer is colored from white to red according to positive differential selection as shown in the scale below the left two panels. Selected residues with considerable escape are labeled on the zoom-in view (middle). Location of FP (red, residues 512–521)and the rest of Env-trimer binding epitope (green, defined as within 5.5 Å from Ab) are shown in a 2nd zoom-in (second from right) with Ab-binding energy for Env trimer and for FP10–1M6Tshown in the graph below the panel. Sequence conservation of Env around the epitope is mapped on the surface and colored from white to purple for conserved to variable as shown in the scale bar below the panel (right). See also Figures S1, S2, S3, S4, S6, and S7 and Tables S2A, S3, S4, S5, S6B, and S7.
Figure 4.
Figure 4.. Developmental Pathways for 0PV-Neutralizing Lineages Reveal Induction and Expansion by FP Carrier and Maturation by Env Trimer
(A) Single-cell sorting of FP+BG505+ B cells at Indicated time points. IgG+ B cells were probed with BG505 SOSIP.664 Env trimer and FP10–1M6T. Percentages of total IgG+ B cells binding to trimer, FP, or both are denoted on the plots. (B) Frequency of 0PV-a, -b, and -c lineages among total amplified sequences from FP+BG505+ slngle-cell sequencing data at Indicated time points. (C) SHM (mean ± SD) in the variable regions of the heavy and light chains of 0PV-a, -b, and -c lineages from single-cell sequencing data at indicated time points. HC, heavy chain; LC, light chain. (D) Maximum-likelihood phylogenetic trees of 0PV-a, -b, and -c lineages. Intermediates separating time points are marked with solid circles. For each lineage, the heavy and light chains of a representative Ab are connected by dashed lines. (E) Mapping of residues altered by SHM at time points as marked onto the cryo-EM structure of the Ab-trimer complexes for 0PV-a (upper), 0PV-b (middle), and 0PV-c (lower) lineages. The SHM altered residues (colored by time point of SHM appearance) and the FP (red) are highlighted in sphere representation. Binding affinities of the Ab at each time point to the Env trimer and FP10–1M6T are tabulated undereach panel. Number of strains of a 9-virus panel neutralized by these Abs are also shown. Abs GL-rev, MRCA, post-3, and post-5 are paired from inferred heavy and light intermediates in Table S5E (note that 0PV-b GL-rev is comprised of GL-rev:UCA). Post-8 refers to 0PV-a.01, 0PV-b.01, or 0PV-c.01. See also Figures S1, S2, S3, S4, S5, and S7 and Tables S1, S2A, S3, S4, S5E, S6B, and S7.
Figure 5.
Figure 5.. Developmental Pathways for DFPH-a Lineage Abs
(A) Probe staining of memory B cells from week 0, 8, 39, and 72. The percentages of total IgG+ B cells binding to trimer, FP, or both are marked on the plots. (B) Frequency of double-positive B cells and DFPH-a lineage reads from NGS and single-cell sequencing at indicated time points post immunization. HC, heavy chain; LC, light chain. (C) Maximum-likelihood phylogenetictrees of the DFPH-a lineage plotted from NGS and single-cell sequencing data. The heavy-chain tree (left); light-chain tree (right); intermediates demarcated by solid circles. (D) SHMs (mean ± SD) levels of the variable regions of the DFPH-a lineage from NGS and single-cell sequencing data at indicated time points. The number of identified Ab sequences is labeled above each bar. ND, not detected. (E) Mapping of residues altered by SHM onto the cryo-EM structure of the Ab-trimer complexes at indicated time points. The SHM altered residues (colored by time point of SHM appearance) and the FP (red) are highlighted in sphere representation. GL-rev and post-2 SHMs are from the inferred paired intermediates GLrev: GL-rev and MRCA/I2:I2, respectively (Table S5E), while post-4, −5, and −8 refer to DFPH-a.15, DFPH-a.01, and DFPH-a.16, respectively. Binding affinities of the Ab at each time point to the Env trimer and FP10–1M6T are tabulated under each panel. Number of strains of a 9-virus panel neutralized by these Abs also shown. (F) Mutational antigenic profiling of DFPH-a.15. The positive site differential selection is plotted across the mutagenized portion of Env (top panel). Regions of interest are expanded in logo plots in the lower panel (underlined and labeled in red in both the top and bottom plots). The height of each amino acid is proportional to its differential selection. (G) Surface representation of the DFPH-a.15 functional epitope on the Env trimer. The Env trimer is colored from white to red according to the positive differential selection at each site. Selected residues with considerable escape are labeled on the zoom-in view (middle). Location of FP (red, residues 512–521) and the rest of Env-trimer epitope (green, within 5.5 Å from Ab) are shown in a 2nd zoom-in (second from right) with the Ab-binding energy for Env trimer and for FP10–1M6T shown in the graph below the panel. Sequence conservation of Env around the epitope is mapped on the surface and colored from white to purple for conserved to variable as shown in the scale bar below the panel (right). See also Figures S1, S2, S3, S4, S6, and S7 and Tables S1, S2A, S3, S4, S5, S6, and S7.
Figure 6.
Figure 6.. FP-Directed Abs Isolated from NHP after Trimer-Only Immunization
(A) FP and trimer ELISA endpoint titers of sera from 14 NHPs immunized three times with BG505 DS-SOSIP with Alum, Adjuplex, or ISCOMATRIX as adjuvants. NHP A12V163 with the highest FP ELISA titer is labeled. (B) Immunization regimen of NHPA12V163 and analyses of plasma and B cells. Plasma titers to the FP-sensitive Δ611 BG505 strain after each immunization are shown with breadth on 10-strain panel (numbers in parentheses) for those with titers higher than 500. The percentage decrease in Δ611 titer for the post-8 plasma in the presence of apeptide correspondingtothe FP sequence is shown at right. Fluorescence-activated cell sorting (FACS) of B cells for binding to FP and trimer at post-3 and post-8 time points are shown in lower panels. Percentages of total IgG+ B cells binding to trimer, FP, or both are marked on the plots. (C) Neutralization analysis of Abs from NHPA12V163. Abs isolated from post-3 are summarized in a pie chart, two Abs of lineage a and one Ab of lineage b. One Ab of each lineage was characterized on the 208-strain panel, with neutralization shown in dendrogram format and colored based on IC50 as shown in the color scale bar. (D and E) Close-ups of detailed Ab-trimer interactions for A12V163-a.01 (D) and A12V163-b.01 (E). Env trimer is displayed at an orientation similar to Figures 3B-3D, and colored green for gp120 and gray for gp41. Ab light chains are colored yellow, and heavy chains are colored individually. (F) Analysis of the Env trimer-Ab binding interface. Cryo-EM structures of the Env trimer in complex with indicated Abs were analyzed for the buried surface area of Env in the binding interface. Total buried surface area contributed by the eight N-terminal FP residues, remaining Env protein residues, or glycans is shown using bar plots in red, gray, and green, respectively. The resolution for 0PV-a.01 and DFPH-a.15 (labeled with asterisks) was too low to fully define glycan interactions in the cryo-EM structures. In general, glycans may not be accurately modeled in the cryo-EM structures, and their contributions to buried surface areas should be interpreted with caution. Neutralization breadths above the graph based on 208-strain panel. (G) Ab affinity for FP10–1M6T and trimer measured by SPR. The data points (square symbols) for Abs from trimer-only immunization are labeled. (H) Mutational antigenic profiling of A12V163-a.01. The positive site differential selection is plotted across the mutagenized portion of Env (top). Regions of interest are expanded in logo plots in the lower panel (underlined and labeled in red in both the top and bottom plots). The height of each amino acid is proportional to its differential selection. (I) Structural representation of the A12V163-a.01 functional epitope on the BG505 Env trimer. The Env trimer is colored from white to red according to the positive differential selection at each site. Selected residues with considerable escape are labeled on the zoom-in view (middle). Location of FP (red, residues 512–521) and the rest of Env-trimer binding epitope (green, defined as within 5.5Å from Ab) are shown in a 2nd zoom-in (second from right) with Ab-binding energy for Env trimer and for FP10–1M6T shown in the graph below the panel. Sequence conservation of Env around the epitope is mapped on the surface and colored from white to purple for conserved to variable as shown in the scale bar below the panel (right). See also Figures S2, S4, and S6 and Tables S1, S2, S3, S4, S6, and S7.
Figure 7.
Figure 7.. FP Priming Increases Elicited Ab Tolerance to Ala-Gly Variation in FP
(A) Normalized response of Ala-Gly scan (left column) and side-chain buried surface area (right column) of FP residues 512–520. Effects of single Ala or Gly substitution on the binding affinity of the peptides to FP-directed Abs were measured by Octet with Fab as the analyte. The response of individual mutated peptideswas normalized to that of the unmutated parent FP. With A12V163-b.01, the concentration of Fabwas 2-fold higher to accommodate the weak binding of this Ab. Buried surface areas of the side chains of the FP residues were calculated from the cryo-EM structures of Ab-BG505 trimer complexes. (B) Metric for reduction of normalized response in Ala-Gly scan. For each Ab, the reduction in normalized response to Ala and Gly mutation was summed, as exemplified schematically with blue arrows for DF1W-a.01. (C) Correlation between reduction in normalized response from the Ala-Gly mutation of a select FP side chain versus the Ab buried surface area of that particular FP side chain. (D) The sum of Ala-Gly reduction of normalized response of each vaccine-elicited Ab is graphed versus the overall breadth. Included are Abs with the broadest neutralization in each class: DF1W-a.01, 0PV-a.01,0PV-b.01, DFPH-a.01,A12V163-a.01,A12V163-b.01,vFP16.02, vFP5.01, and VRC34.01.VRC34.01 was elicited by natural infection and not included in the statistics calculation of vaccine-elicited Abs. (E) Correlation between the number of SHM in the V gene region of each Ab contacting FP (as defined by Ab-FP crystal structures) and neutralization breadth (as defined on the 208-strain panel). (F) Metric of Ala-Gly reduction of normalized responses as defined in (B) was plotted for each Ab analyzed in (A). VRC34.01 clustered with two vaccine-elicited trimer-only immunized Abs. p value determined by two-tailed Mann-Whitney test. (G) Schematic showing that priming with a conserved subregion of an epitope provides a means to induce Abs with antigen-binding hotspots, coincident with the target subregion and tolerant to sequence variation. Notably, for FP-directed Ab to neutralize broadly, these Abs must have a “coldspot” or “anti-hotspot” with tolerance to regions of sequence diversity proximal to FP, as was previously observed to allow receptor binding while escaping from most Abs at the CD4-binding site (Kwong et al., 1998). See also Figures S4, S5, and S6 and Tables S2, S4, and S5E.

References

    1. Adams PD, Gopal K, Grosse-Kunstleve RW, Hung LW, loerger TR, McCoy AJ, Moriarty NW, Pai RK, Read RJ, Romo TD, et al. (2004). Recent developments in the PHENIX software for automated crystallographic structure determination. J. Synchrotron Radiat. 11, 53–55. - PubMed
    1. Adams PD, Afonine PV, Bunkóczi G, Chen VB, Davis IW, Echols N, Headd JJ, Hung LW, Kapral GJ, Grosse-Kunstleve RW, et al. (2010). PHENIX: a comprehensive Python-based system for macromolecular structure solution. Acta Crystallogr. D Biol. Crystallogr. 66, 213–221. - PMC - PubMed
    1. Alam SM, Aussedat B, Vohra Y, Meyerhoff RR, Cale EM, Walkowicz WE, Radakovich NA, Anasti K, Armand L, Parks R, et al. (2017). Mimicry of an HIV broadly neutralizing antibody epitope with a synthetic glycopeptide. Sci. Transl. Med. 9, eaai7521. - PMC - PubMed
    1. Azoitei ML, Correia BE, Ban YE, Carrico C, Kalyuzhniy O, Chen L, Schroeter A, Huang PS, McLellan JS, Kwong PD, et al. (2011). Computation-guided backbone grafting of a discontinuous motif onto a protein scaffold. Science 334, 373–376. - PubMed
    1. Barad BA, Echols N, Wang RY, Cheng Y, DiMaio F, Adams PD, and Fraser JS (2015). EMRinger: side chain-directed model and map validation for 3D cryo-electron microscopy. Nat. Methods 12, 943–946. - PMC - PubMed

Publication types

MeSH terms