. 2019 Jul 25;178(3):653-671.e19.
doi: 10.1016/j.cell.2019.06.034.

A Paranigral VTA Nociceptin Circuit that Constrains Motivation for Reward

Affiliations

A Paranigral VTA Nociceptin Circuit that Constrains Motivation for Reward

Kyle E Parker et al. Cell. .

Abstract

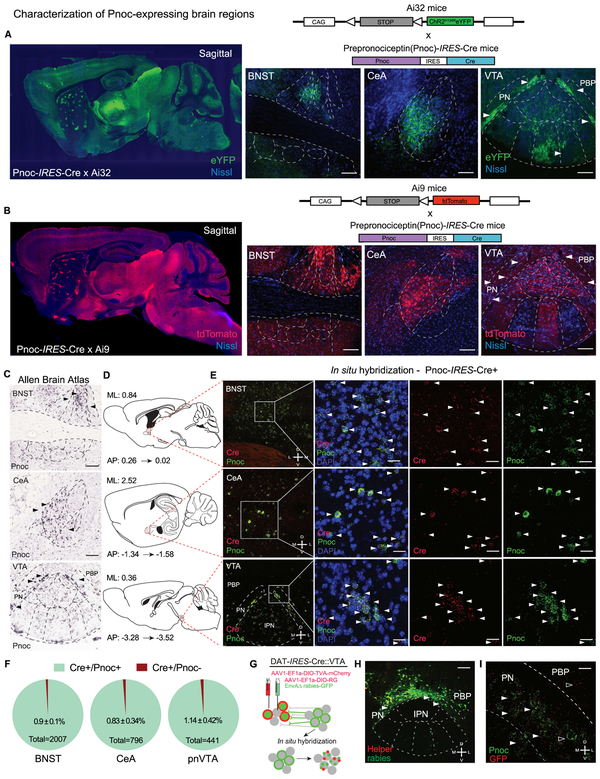
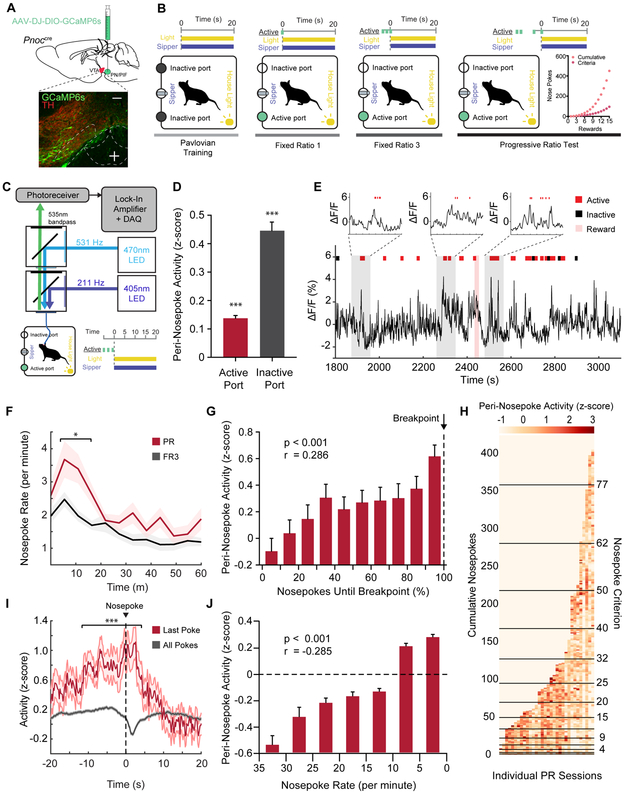
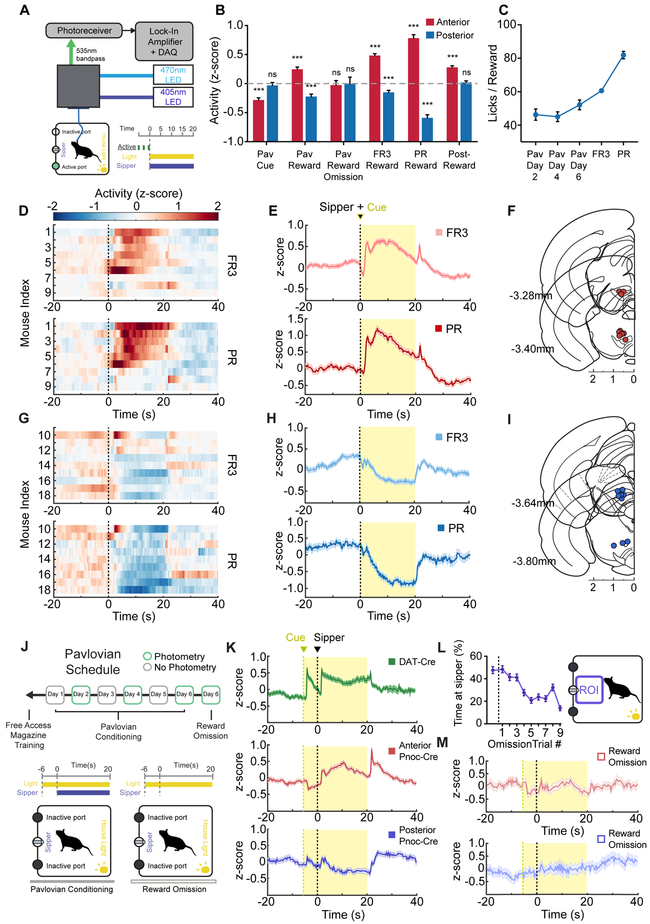
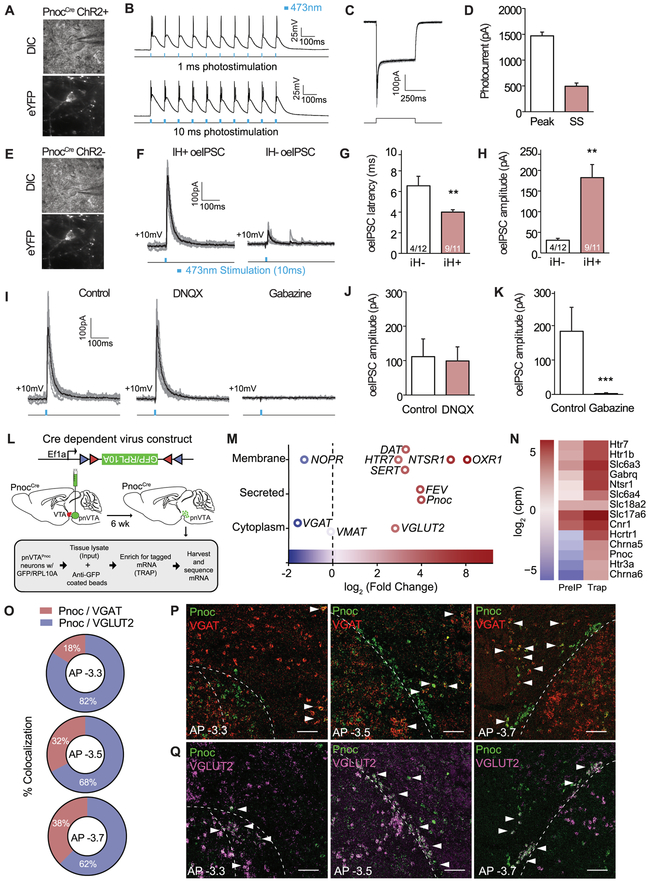
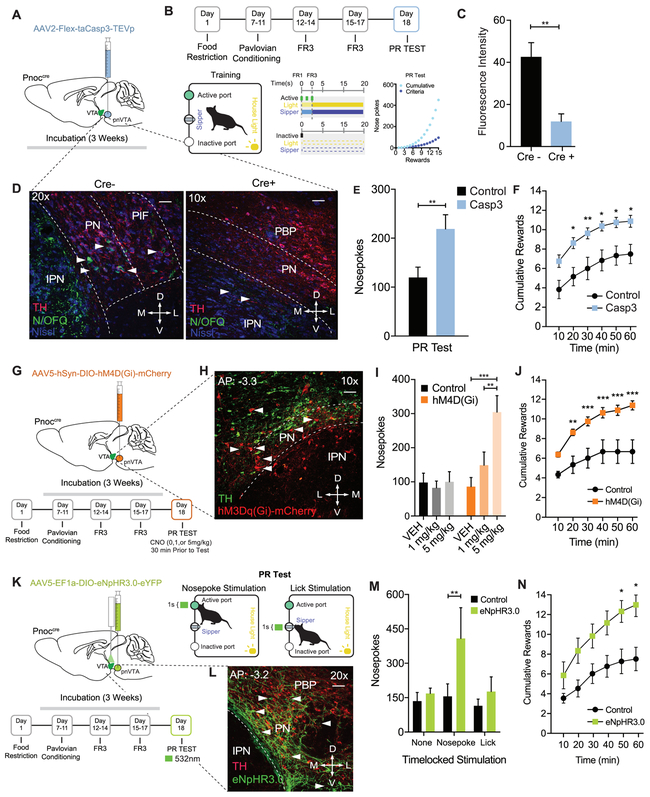
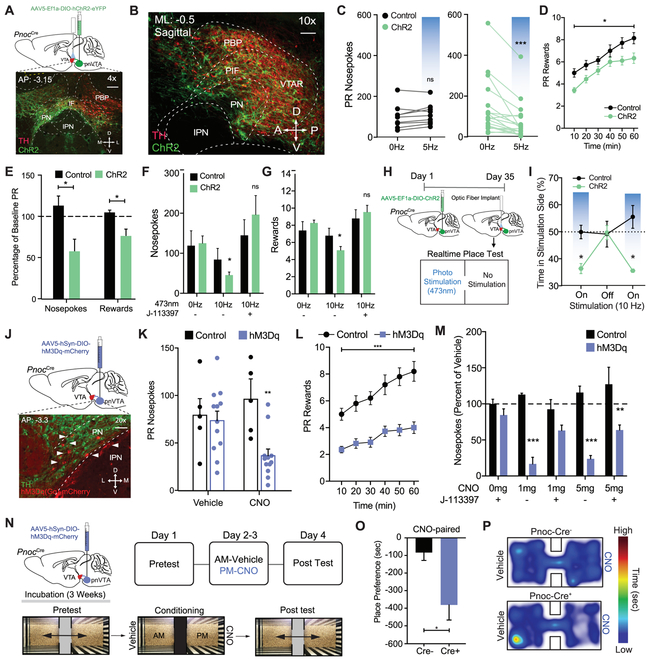
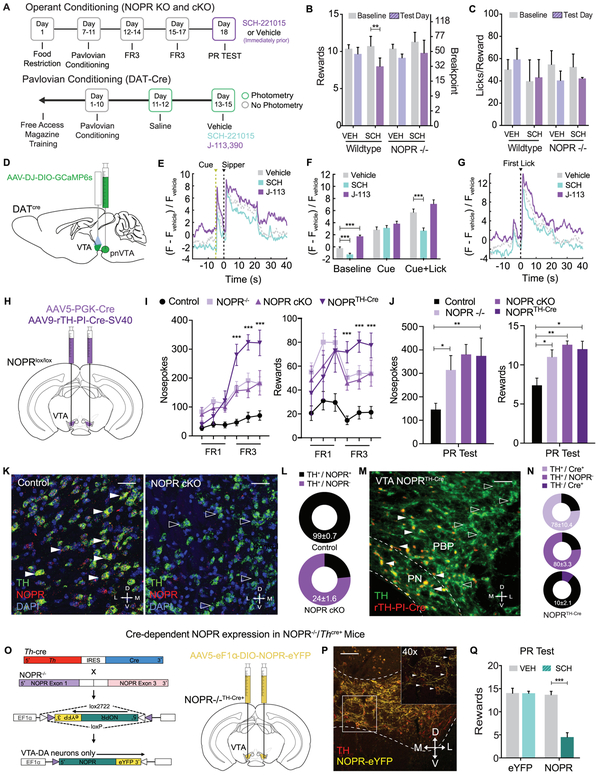
Nociceptin and its receptor are widely distributed throughout the brain in regions associated with reward behavior, yet how and when they act is unknown. Here, we dissected the role of a nociceptin peptide circuit in reward seeking. We generated a prepronociceptin (Pnoc)-Cre mouse line that revealed a unique subpopulation of paranigral ventral tegmental area (pnVTA) neurons enriched in prepronociceptin. Fiber photometry recordings during progressive ratio operant behavior revealed pnVTAPnoc neurons become most active when mice stop seeking natural rewards. Selective pnVTAPnoc neuron ablation, inhibition, and conditional VTA nociceptin receptor (NOPR) deletion increased operant responding, revealing that the pnVTAPnoc nucleus and VTA NOPR signaling are necessary for regulating reward motivation. Additionally, optogenetic and chemogenetic activation of this pnVTAPnoc nucleus caused avoidance and decreased motivation for rewards. These findings provide insight into neuromodulatory circuits that regulate motivated behaviors through identification of a previously unknown neuropeptide-containing pnVTA nucleus that limits motivation for rewards.

Keywords: NOPR; motivation; neuropeptide; nociceptin; opioid; optogenetics; orphanin FQ; photometry; reward; ventral tegmental area.


Conflict of interest statement

Declaration of Interests

The authors declare no competing interests.

Figures

Figure 1:
Figure 1:. Anatomical Identification of Endogenous Pnoc-expressing VTA Inputs
(A-B) Generation of the Pnoc-CretdTomato and Pnoc-CreChR2/eYFP mouse lines from the cross between the Pnoc-Cre × Ai9-tdTomato or Pnoc-Cre × Ai32-ChR2/eYFP. Sagittal images of Pnoc labeling in Pnoc-Cre × Ai9 or Ai32 with coronal images depicting bed nucleus of stria terminalis (BNST), central amygdala (CeA), and paranigral ventral tegmental area (pnVTA). Images show tdTomato (red) or ChR2/eYFP (green) and Nissl (blue) staining. Scale bars are 100 μm. (C) Representative coronal images for Pnoc in situ hybridization from Allen Brain Institute of the BNST, CeA, VTA/IPN regions. All scale bars are 100 μm. (D) Sagittal atlas images depicting the location of BNST, CeA, and VTA regions used for quantification. (E) Pnoc and Cre expression patterns in Pnoc-Cre+ mice via in situ hybridization of Pnoc (green), Cre (red), and DAPI (blue) for coronal images of BNST, CeA, and pnVTA regions corresponding to panel D. Scale bars are 25 μm. (F) Quantification of Pnoc expression within Cre-expressing cells in the BNST, CeA, and pnVTA (n=4, 4 mice, 3 slices each) (G) Schematic depicting in situ hybridization for GFP (red) and Pnoc (green) mRNA following recombinant AAV helper viral and rabies viral injections into the VTA of DAT-Cre mice. (H) Coronal image depicting cre-dependent helper (red) and monosynaptic rabies (green) viral expression in the VTA / IPN regions of DAT-Cre mice. PBP- parabrachial pigmented nucleus, PN – paranigral VTA. Scale bars are 200 μm. (I) Coronal image depicting fluorescent in situ hybridization (FISH) of Pnoc (green) and GFP (red) colocalization in the pnVTA of DAT-Cre mice following recombinant AAV helper viral and rabies viral injections into the VTA. Scale bars are 25 μm.
Figure 2:
Figure 2:. Pnoc+ VTA Inputs are Engaged During Low-Yield Reward Seeking
(A) Sagittal brain cartoon (top panel) of viral injection of GCaMP6s into the pnVTA of Pnoc-Cre+ mice and representative coronal image (bottom panel) showing immunohistochemistry for GCaMP6s and tyrosine hydroxylase (TH) staining. Images show GCaMP6s (green), and TH (red). Scale bars are 100 μm. (B) Cartoon schematic depicting training regimen for Pavlovian conditioning and operant task within operant box. (C) Cartoon schematic of fiber photometry setup for recording from mouse within operant box. (D)Neural activity during 2 second time bins centered around active or inactive nosepoke events (n = 18 mice, 65 sessions: One sample t-test, ***p<0.001). (E) Representative recorded activity during PR operant task (red ticks = active nosepoke, black ticks = inactive nosepoke, red highlight = 20s reward period). (F) Mean nosepoke rate (active nosepokes per minute) over entire hour-long FR3 sessions and PR sessions (n = 18 mice, 65 sessions: Two sample t-test, *p=0.031). (G) Mean peri-nosepoke activity relative to proportion of nosepokes until breakpoint for each PR session (n = 18 mice, 32 sessions: Pearson’s correlation on uncategorized data points, ***p<0.001, r = 0.286). (H) Individual 2s time bins of mean neural activity centered around active nosepoke events; shown for every active nosepoke during PR sessions (n = 18 mice, 32 sessions). Horizontal black lines indicate attainment of reward for given PR level. (I) Mean neural activity aligned to nosepoke times for all active nosepokes and the last active nosepoke (breakpoint) for PR sessions (n = 18 mice, 32 sessions: Two sample t-test, ***p<0.001). (J) Mean peri-nosepoke activity relative to nosepoke rate (active nosepokes per minute) (n = 18 mice, 32 sessions: Pearson’s correlation on uncategorized data points, ***p<0.001, r = −0.285).
Figure 3:
Figure 3:. Anatomically Distinct Subdivisions of pnVTAPnoc Neurons are Engaged During Reward Anticipation and Consumption
(A) Cartoon schematic of fiber photometry setup. (B) Summary of mean neural activity across various time intervals (intervals specified in Figure S3B) associated with reward anticipation and consumption during Pavlovian conditioning (n = 10 mice, 30 sessions) and operant task performance (n = 18 mice, 65 sessions; data presented as mean ± SEM; one sample t-tests: ***p<0.001). (C) Number of licks per reward period during Pavlovian conditioning (n = 10 mice, 30 sessions) and operant task performance (n = 18 mice, 65 sessions; data presented as mean ± SEM). (D) Heatmap of neural activity averaged across every reward period during FR3 (top panel) and PR (bottom panel) tasks. Each row corresponds to an individual mouse with anterior VTA fiber placement (n = 9 mice, 17 FR3 sessions, 17 PR sessions). (E) Trace of neural activity averaged across every reward period during FR3 (top panel) and PR (bottom panel) tasks. Generated from all mice with anterior VTA fiber placement (n = 9 mice, 17 FR3 sessions, 17 PR sessions). (F) Coronal section showing anatomical location of 400μm optic fiber implant placement for mice with anterior VTA fiber placements. (G) Heatmap of neural activity averaged across every reward period during FR3 (top panel) and PR (bottom panel) tasks. Each row corresponds to an individual mouse with posterior VTA fiber placement (n = 9 mice, 16 FR3 sessions, 15 PR sessions). (H) Trace of neural activity averaged across every reward period during FR3 (top panel) and PR (bottom panel) tasks. Generated from all mice with posterior VTA fiber placement (n = 9 mice, 16 FR3 sessions, 15 PR sessions). (I) Coronal section showing anatomical location of 400μm optic fiber implant placement for mice with posterior VTA fiber placements. (J) Pavlovian conditioning schedule and cartoon depicting time course of house light (CS) and sipper access (US) during Pavlovian conditioning. (K) Trace of neural activity averaged across every reward period during Pavlovian conditioning. Generated from Pnoc-Cre mice with anterior VTA fiber placement (middle panel) (n = 5 mice, 15 sessions) and posterior fiber placement (bottom panel) (n = 5 mice, 15 sessions). Trace of neural activity also shown for DAT-cre mice (top panel) (n = 7 mice, 14 sessions) for comparison of DA cell and Pnoc cell activity over identical Pavlovian conditioning paradigm. (L) Proportion of time spent near sipper (ROI) during reward omission periods. Data point left of dashed line represents the last rewarded trial on day 6 of Pavlovian conditioning (n = 10 mice, 10 sessions). (M) Trace of neural activity averaged across every reward omission period during day 6 of Pavlovian conditioning. Mice with anterior VTA fiber placement (top panel) (n = 5 mice, 5 sessions) and posterior fiber placement (bottom panel) (n = 5 mice, 5 sessions).
Figure 4:
Figure 4:. pnVTAPnoc Neurons Synapse onto DA Neurons and Molecularly Heterogeneous
(A) Differential interference contrast (DIC; top) and fluorescent (eYFP; bottom) images of patch recordings for Pnoc-CreChR2cells. (B) Representative traces of slice electrophysiological recordings of pnVTA Pnoc-CreChR2cells following 1 and 10ms, 10Hz photostimulation. (C) Representative traces showing photocurrent in ChR2-eYFP expressing neurons. (D) Peak and steady-state photocurrent amplitudes in ChR2-eYFP expressing neurons (n=4). (E) Representative images showing patch-clamp recordings from non-eYFP expressing VTA neurons. F) Representative traces showing optically evoked inhibitory postsynaptic currents (oeIPSC) in IH+ (putative DA cells; n=11) and IH− (putative non-DA cells; n=12) neurons. G) oeIPSC latency was faster in IH+ versus IH− neurons (p<0.05). H) oeIPSC amplitude was larger in IH+ versus IH− neurons (p<0.05). I) Representative traces showing oeIPSCs from VTA neurons before and after drug application. J) oeIPSCs were unaffected by blockade of glutamate receptors. K) oeIPSCs were abolished by blockade of GABA receptors. (L) Cartoon depicting viral injection and TRAP of pnVTAPnoc neurons. (M) Single-cell RNA-sequencing of TRAPed pnVTAPnoc neurons showing significantly expressed genes from membrane, secreted, and cytoplasm of Pnoc-labeled neurons (n=5, 5 slices per n). (N) Heatmap from single-cell RNA-sequencing comparing Input and TRAP (O) Pie charts depicting Pnoc / VGAT (blue) and Pnoc / VGlut2 percent co-expression as a function of anterior to posterior (AP) progression (n=4, 4 slices per n). (P) Coronal images images of Pnoc (green) and VGAT (red) mRNA expression within the pnVTA as a progression from anterior to posterior (AP). Open arrows: no colabeling and filled-in arrows: colabeling. (Q) Coronal images of Pnoc (green) and VGlut2 (purple) mRNA expression within the pnVTA from anterior to posterior (AP). Open arrows represent no co-labeling, and filled arrows represent colabeling.
Figure 5:
Figure 5:. Selective Ablation and Inhibition of pnVTAPnoc Neurons Enhances Operant Responding for Natural Rewards
(A) Cartoon depicting injection of AAV2-FLEX-taCasp3-TEVp into the pnVTA of Pnoc-Cre+ and Pnoc-Cre− mice. (B) Schematic and timeline for the operant training schedule, FR, and PR test days. (C) Quantification of fluorescence intensity from immunohistochemistry analysis for N/OFQ fluorescence in Pnoc-Cre+ and Pnoc-Cre− mice following cell ablation). (D) Representative coronal images of the VTA and IPN showing immunohistochemistry for nociceptin (N/OFQ) and tyrosine hydroxylase (TH) staining in Pnoc-Cre− (left panel) and Pnoc-Cre+ (right panel) mice. Images show N/OFQ (green), DAPI (blue) and TH (red). Scale bars are 50 and 100μm, respectively. (E) Nosepokes performed during PR test. Pnoc-CretaCasp3 mice have significantly increased nosepokes and rewards, compared to controls (n = 11 to 13: two-way repeated-measures ANOVA, Bonferroni post hoc; Nosepokes for control versus Casp3 during PR test **p < 0.01,. (F) Cumulative rewards received in Control and Pnoc-CretaCasp3 mice. Pnoc-CretaCasp3 mice show significantly increased number of rewards received, compared to controls (n = 11 to 13: two-way repeated-measures ANOVA, Bonferroni post hoc; Nosepokes for Control versus Casp3 during PR test *p < 0.05, **p<0.01. (G) Calendar for injection of AAV5-hSyn-DIO-hM4D(Gi)-mCherry into the pnVTA of Pnoc-Cre+ and Pnoc-Cre− mice. Schematic and timeline for the operant training schedule and FR and PR test days. (H) Coronal images of the pnVTA and IPN showing immunofluorescence staining tyrosine hydroxylase (TH) and hM4D(Gi)-mCherry following viral injection in Pnoc-Cre+ mice. Images show TH (green) and hM4D(Gi)-mCherry (red). (I) Number of nosepokes performed during PR test. Pnoc-CrehM4D(Gi) mice show significantly increased active nosepokes compared to Controls (n = 8: two-way repeated-measures ANOVA, Bonferroni post hoc; Nosepokes for Vehicle versus 5mg/kg, ***p < 0.001, 1mg/kg versus 5mg/kg **p < 0.01. (J) Cumulative rewards received in Control and Pnoc-CrehM4D(Gi) mice. Pnoc-CrehM4D(Gi) mice receive significantly more rewards over session, compared to controls (n = 8: two-way repeated-measures ANOVA, Bonferroni post hoc; Nosepokes for control versus hM4D(Gi) during PR test, **p < 0.01, ***p < 0.001. (K) Calendar for injection of AAV5- EF1α-DIO-eNpHR3.0-eYFP into the pnVTA of Pnoc-Cre+ and Pnoc-Cre− mice. Schematic and timeline for the operant training schedule, FR and PR test days. (L) Coronal images of pnVTA immunofluorescence staining of tyrosine hydroxylase (TH) and eNpHR3.0-eYFP following viral injection in Pnoc-Cre+ mice. Images show TH (red) and eNpHR3.0-eYFP (green). (M) Number of nosepokes performed during PR test. Pnoc-CreeNpHR3.0 mice show significantly increased active nosepokes compared to Controls following nosepoke-paired inhibition (n = 6: two-way repeated-measures ANOVA, Bonferroni post hoc; **p<0.01) (N) Cumulative rewards received in Control and Pnoc-CreeNpHR3.0 mice. Pnoc-CreeNpHR3.0 mice receive significantly more rewards over session compared to control mice following nosepoke-paired inhibition (n = 6: two-way repeated-measures ANOVA, Bonferroni post hoc; Nosepoke-paired inhibition Rewards for Control versus Pnoc-CreeNpHR3 during PR test, *p<0.05.
Figure 6:
Figure 6:. Optogenetic and Chemogenetic Stimulation of pnVTAPnoc Neurons Decreases Effort to Receive a Natural Reward and Promotes Aversion
(A) Sagittal brain cartoon (top) of viral injection of ChR2 into the pnVTA of Pnoc-Cre+ mice and representative sagittal image (bottom) showing immunohistochemistry for ChR2 (green) and tyrosine hydroxylase (TH) (red). (B) Calendar outlining timeline and stimulation parameters for operant training schedule during FR1, FR3, and PR tasks. (C) Number of nosepokes during PR test. Pnoc-CreChR2 mice decrease responding during continuous 5 Hz (10ms) blue light stimulation compared to controls (n=12: two-way repeated-measures ANOVA, Bonferroni post hoc; Nosepokes for 0Hz versus 5Hz during PR test, ***p<0.001). (D) Number of rewards received over time during PR test. Pnoc-CreChR2 mice show a significant reduction in the number of rewards received during the PR test received following 5Hz stimulation compared to controls (n=12: Student’s t-test, *p<0.05) (E) Percentage of baseline nosepokes and rewards during PR test. Pnoc-CreChR2 mice show a significant decrease in active nosepokes and number of rewards received during 5 Hz stimulation compared to baseline and controls (n=12: One way ANOVA, Bonferroni post hoc; Nosepokes for baseline versus 5Hz during PR test *p<0.05, Rewards for baseline versus 5Hz during PR test *p<0.05). (F) Number of nosepokes and (G) rewards during PR test in Pnoc-CreChR2 mice that received photostimulation (10Hz, 10ms) and the NOPR antagonist (J-113397, 3 mg/kg). Pnoc-CreChR2 mice show a significant decrease in active nosepokes and rewards compared to controls during photostimulation that was rescued by treatment with J-113397 (n=12: two-way repeated-measures ANOVA, Bonferroni post hoc; Pnoc-CreChR2 0Hz versus 10 Hz, *p<0.05, 0Hz versus 10 Hz + J-113397, ns) (H) Calendar outlining timeline for viral injection of ChR2 and VTA fiber optic implantation, followed by real time place testing. (I) Time-lock (ON-OFF-ON) patterns of photostimulation-induced avoidance. Percentage of total time spent receiving 10Hz stimulation in control and Pnoc-CreChR2 mice (n=9 to 12: two-way repeated-measures ANOVA, Bonferroni post hoc; percentage of time spent in stimulation side for control versus Pnoc-CreChR2 at 10Hz *p < 0.05). (J) Sagittal brain cartoon (top panel) of viral injection of hM3D(Gq)-mCherry into the pnVTA of Pnoc-Cre+ mice and representative coronal image (bottom panel) showing immunohistochemistry for hM3D(Gq)-mCherry (red) and tyrosine hydroxylase (TH) (green). (K) Number of nosepokes during PR test. Pnoc-CrehM3D(Gq) mice show a significant decrease in active nosepokes CNO (5mg/kg) administration compared to controls (data presented as mean ± SEM, n=5 to 12: two-way repeated-measures ANOVA, Bonferroni post hoc; Nosepokes for baseline versus CNO (5mg/kg) during PR test **p<0.01) Control mice show no effect in nosepokes or number of rewards received following CNO (5mg/kg) administration. (L) Number of rewards received over time during PR test. Pnoc-CrehM3D(Gq) mice show a significant reduction in the number of rewards received during PR test received following CNO (5mg/kg) administration compared to controls (n=5 to 12: Student’s t-test, ***p<0.001) (M) Number of nosepokes (as a % of vehicle treatment) during PR test in Pnoc-CrehM3D(Gq) mice that received CNO (1 and 5 mg/kg) and J-113397 (3 mg/kg). CNO treated mice show a significant decrease in nosepokes compared to controls that was partially rescued by treatment with J-113397 (n=5 to 12: two-way repeated-measures ANOVA, Bonferroni post hoc; Nosepokes for baseline versus CNO (5mg/kg) during PR test **p < 0.01, Rewards for baseline versus CNO (5mg/kg) during PR test **p < 0.01). N) Timeline for pnVTA viral injection and detailed calendar outlining CPP experimental paradigm. (O) Amount of time spent on CNO-treated side during conditioned place post-test between Pnoc-Cre− and Pnoc-Cre+ mice. Post test reveals Pnoc-CrehM3D(Gq) mice spend significantly less time in the side previously paired with CNO (5mg/kg). (n=5, 12 sessions: Student’s t-test, Tukeys post-hoc, ****p<0.01). (P) Representative heat map of relative time spent in CPP chambers for a Pnoc-Cre− and Pnoc-Cre+ mouse during CPP post-test following 5 mg/kg CNO treatment.
Figure 7:
Figure 7:. VTA Dopamine Neuron NOPR Expression is Necessary and Sufficient for Regulating Motivation for Sucrose
(A) Calendar outlining timeline for operant training schedule in NOPR KO and cKO experiments or pavlovian training schedule for in vivo photometry recording of DAT-Cre experiments. (B) Number of rewards and licks per reward during PR test following vehicle and SCH221510 (10mg/kg) administration. Wildtype (WT) mice show a significant decrease in the number of rewards received following SCH221510 (10mg/kg) administration compared to NOPR−/− mice (n=6 to 8: two-way repeated-measures ANOVA, Bonferroni post hoc; Rewards for Baseline versus SCH221510 (10mg/kg) PR test **p < 0.01). (C) Data depicting lick rate between vehicle and SCH221510 (10 mg/kg) treated WT and NOPR KO mice during PR testing. (n=6 to 8: two-way repeated-measures ANOVA, ns). D) Cartoon representation of viral injection of GCaMP6s in the VTA of DAT-cre animals. (E) Comparison of mean DA cell dynamics across reward-predictive cue and sipper presentation in Pavlovian conditioning paradigm with systemic activation or blockade of NOPR (n=7 animals, 7 sessions per drug treatment). (F) Activity of DA cells during Pavlovian conditioning paradigm organized into 2-s time bins based on behavioral state of animal (n=7, 7 sessions per drug treatment; data represented as mean ± SEM; two sample t-tests: ***p<0.001). (G) Comparison of mean DA cell dynamics across first lick event within reward period of Pavlovian conditioning paradigm with systemic activation or blockade of NOPR (n = 7 , 7 sessions per drug treatment). (H) Cartoon depicting viral conditional knock out of NOPR in the VTA of NOPRloxP/YFP mice after bilateral injection of AAV5-PGK-Cre or AAV9-rTH-PI-Cre-SV40 into the VTA. (I) Number of nosepokes and rewards during FR1 and FR3 test sessions between control, NOPR KO, NOPR cKO, and NOPRTH-Cre mice. NOPR KO, NOPR cKO, and NOPRTH-Cre mice show a significant increase in the number of rewards received and total nosepokes in comparison to WT mice (n=6 to 8: two-way repeated-measures ANOVA, Bonferroni post hoc; Nosepokes and Rewards for WT versus NOPR KO, NOPR cKO, and NOPRTH-Cre FR1 and FR3 tests ***p<0.001). (J) Number of nosepokes and rewards during PR test sessions between control, NOPR KO, NOPR cKO, and NOPRTH-Cre mice. NOPR KO, NOPR cKO, and NOPRTH-Cre mice show a significant increase in the number of rewards received and total nosepokes in comparison to WT mice (n=6 to 8: two-way repeated-measures ANOVA, Bonferroni post hoc; Nosepokes and Rewards for WT versus NOPR KO and NOPR cKO PR tests, ***p<0.001). (K) Representative 40X coronal images for in situ hybridization showing colabeling of NOPR (red) and TH (green) mRNA in NOPRlox/lox− (left panel) and NOPRlox/lox+ (right panel) mice that received injections of AAV5-PGK-Cre. (L) Pie chart graph depicting %Co-expression of TH and NOPR mRNA in the VTA of NOPRlox/lox− (top panel) and NOPRlox/lox+ (bottom panel) mice that received injections of AAV5-PGK-Cre (n=4, 4 slices per n). (M) Representative 20X coronal images for immunofluorescence showing colabeling of Cre (red) and TH (green) in NOPRlox/lox+ mice that received injections of AAV9-rTH-PI-Cre-SV40. (L) Pie chart graph depicting %Co-expression of TH and Cre (top panel) and %Co-expression of TH and NOPR (bottom panel) in the VTA of NOPRlox/lox+ mice that received injections of AAV9-rTH-PI-Cre-SV40 (n=4, 4 slices per n). (O) Cartoon for viral rescue of NOPR in VTA dopamine cells of NOPR−/− X TH-Cre mice. (P) Representative image (10x) showing NOPR-eYFP infected VTA TH+-cells. Images show TH (red) and NOPR-eYFP (yellow). Inset image depicts 40x image. Arrows indicate TH and NOPR-eYFP co-labeling. (Q) Number of rewards during PR test sessions following vehicle and SCH221510 (10mg/kg) administration. TH-Cre x NOPR−/− “rescue” mice show a significant decrease in the number of rewards received following SCH221510 (10mg/kg) administration compared to NOPR−/− mice (n=8 to 10: two-way repeated-measures ANOVA, Bonferroni post hoc; Training: Rewards for NOPR-rescue baseline PR test versus SCH221510 (10mg/kg) PR test ***p<0.001. No Training: Rewards for NOPR-rescue mice with Vehicle PR test versus SCH221510 (10mg/kg) PR test versus CNO (5mg/kg) during PR test ***p<0.001).

Comment in

References

    1. Al-Hasani R, McCall JG, Shin G, Gomez AM, Schmitz GP, Bernardi JM, Pyo CO, Park SI, Marcinkiewcz CM, Crowley NA, Krashes MJ, Lowell BB, Kash TL,, Rogers JA, Bruchas MR (2015). Distinct subpopulations of nucleus accumbens dynorphin neurons drive aversion and reward. Neuron, 87, 1063–1077. - PMC - PubMed
    1. Anton B, Fein J, To T, Li X, Silberstein L, Evans CJ (1996). Immunohistochemical localization of ORL-1 in the central nervous system of the rat. J Comp Neurol. 368(2), 229–251. - PubMed
    1. Baimel C, Bartlett SE, Chiou LC, Lawrence AJ, Muschamp JW, Patkar O, Tung LW, Borgland SL (2015). Orexin/hypocretin role in reward: implications for opioid and other addictions. Br J Pharmacol, 172(2), 334–348. - PMC - PubMed
    1. Beier KT, Steinberg EE, DeLoach KE, Xie S, Miyamichi K, Schwarz L, Gao XJ, Kremer EJ, Malenka RC, Luo L (2015). Circuit Architecture of VTA Dopamine Neurons Revealed by Systematic Input–Output Mapping. Cell, 162(3), 622–634. - PMC - PubMed
    1. Binder EB, Kinkead B, Owens MJ, Nemeroff CB (2001). Neurotensin and dopamine interactions. Pharmacol Rev, 53, 453–486. - PubMed

Publication types

MeSH terms