. 2019 Jul 25;178(3):714-730.e22.
doi: 10.1016/j.cell.2019.06.029.

Intra- and Inter-cellular Rewiring of the Human Colon during Ulcerative Colitis

Affiliations

Intra- and Inter-cellular Rewiring of the Human Colon during Ulcerative Colitis

Christopher S Smillie et al. Cell. .

Abstract

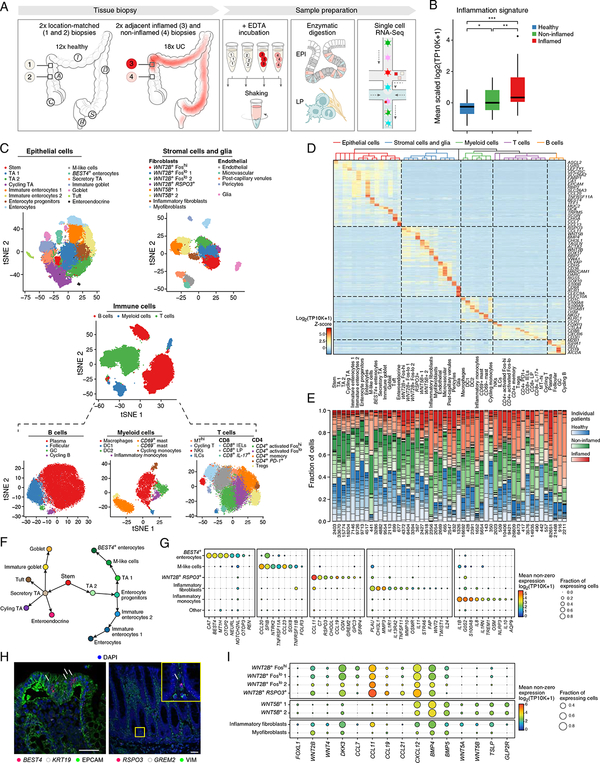
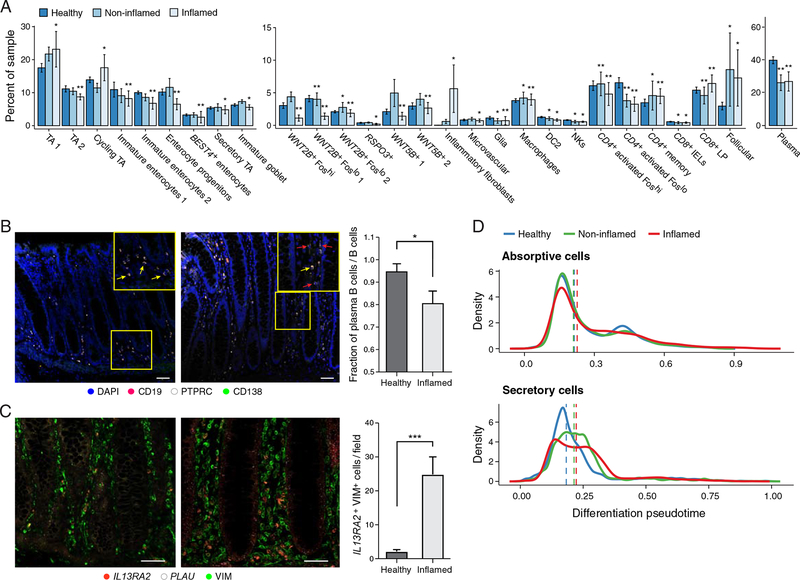
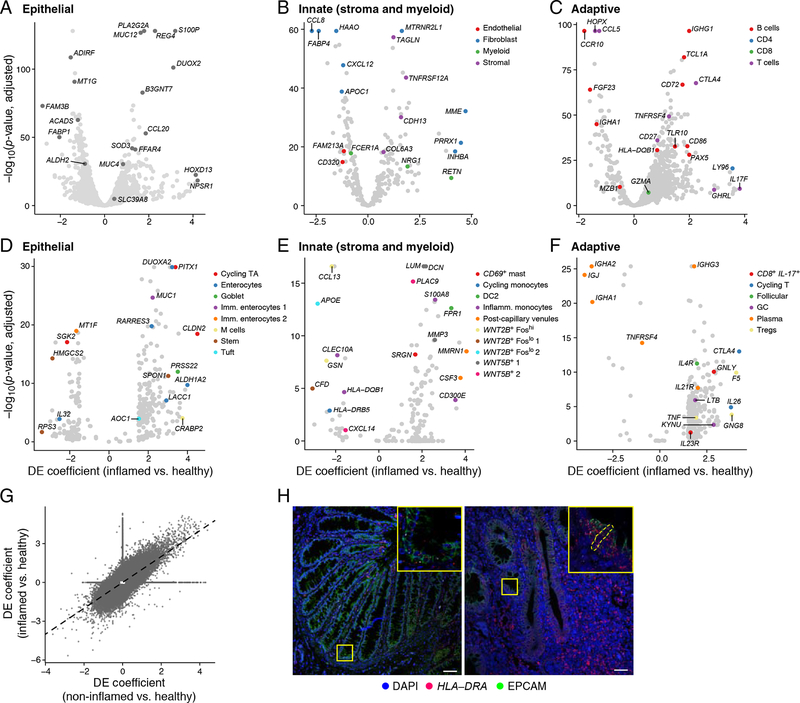
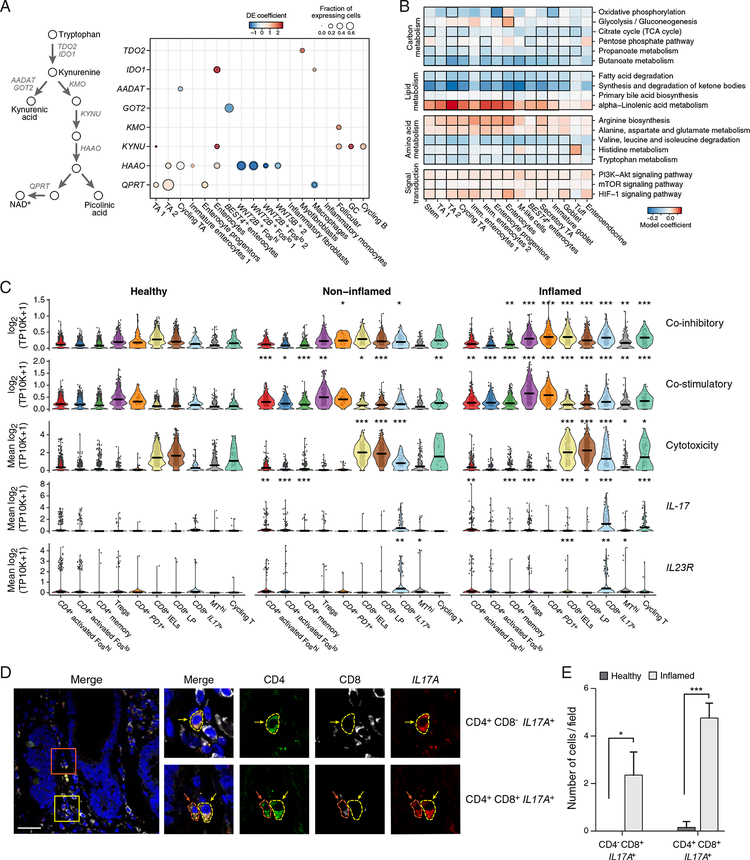
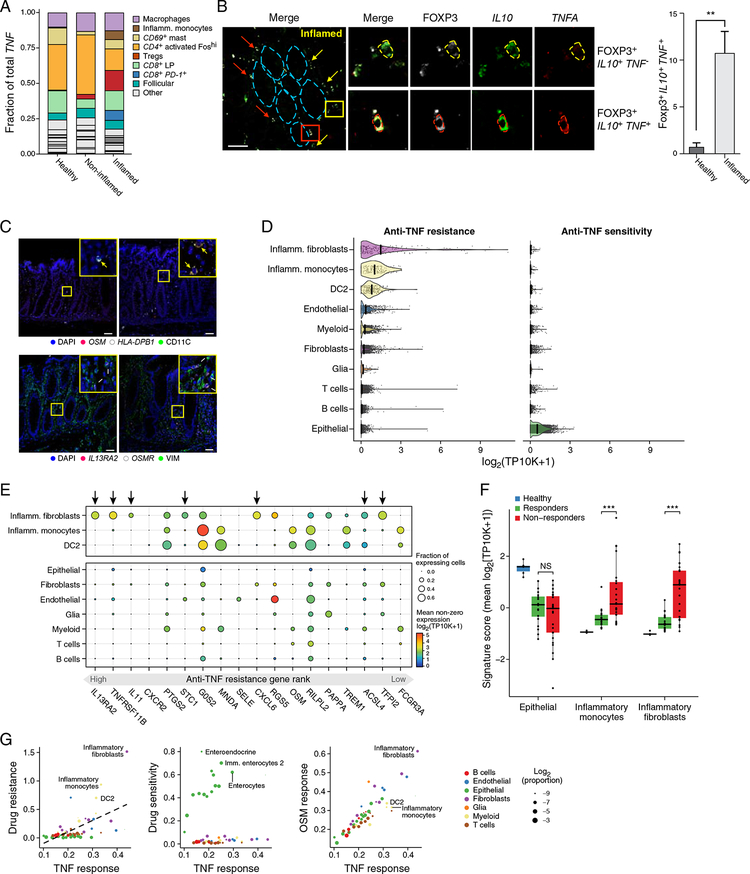
Genome-wide association studies (GWAS) have revealed risk alleles for ulcerative colitis (UC). To understand their cell type specificities and pathways of action, we generate an atlas of 366,650 cells from the colon mucosa of 18 UC patients and 12 healthy individuals, revealing 51 epithelial, stromal, and immune cell subsets, including BEST4+ enterocytes, microfold-like cells, and IL13RA2+IL11+ inflammatory fibroblasts, which we associate with resistance to anti-TNF treatment. Inflammatory fibroblasts, inflammatory monocytes, microfold-like cells, and T cells that co-express CD8 and IL-17 expand with disease, forming intercellular interaction hubs. Many UC risk genes are cell type specific and co-regulated within relatively few gene modules, suggesting convergence onto limited sets of cell types and pathways. Using this observation, we nominate and infer functions for specific risk genes across GWAS loci. Our work provides a framework for interrogating complex human diseases and mapping risk variants to cell types and pathways.

Keywords: anti-TNF resistance; cell-cell interactions; colon; genome-wide association studies; inflammation; inflammatory bowel disease; large intestine; single-cell RNA-seq; single-cell genomics; ulcerative colitis.


Conflict of interest statement

DECLARATION OF INTERESTS

A.R. is an SAB member of ThermoFisher Scientific and Syros Pharmaceuticals. A.R. and R.J.X. are cofounders of and equity holders in Celsius Therapeutics. R.J.X. is a consultant to Novartis. A.K.S was compensated for consulting and SAB membership from Honeycomb Biotechnologies, Dot Bio, Cellarity, Cogen Therapeutics, and Dahlia Biosciences. M.B., A.L.H., N.R., R.H.H., J.O.-M., O.R.-R., A.K.S., K.S., C.S.S., A.R. and R.J.X. are co-inventors on PCT/US2018/042554 relating to advances in understanding cellular dynamics, cellular effectors, and risk variants of the human colon in health and UC described in this manuscript.

Processed data was deposited in the Single Cell Portal (SCP259). Raw data will be available for download from Broad DUOS.

Figures

Figure 1.
Figure 1.. Single-cell atlas of colon biopsies from healthy individuals and ulcerative colitis (UC) patients.
A. Study design. See also Table S1. B. Confirmation of inflammation status. Mean expression of an inflammation signature (STAR Methods) in cells from healthy (blue), non-inflamed (green), and inflamed (red) biopsies (Wilcoxon test, * p = 0.05; ** p = 0.01; *** p = 0.001); boxplots: 25%, 50%, and 75% quantiles; error bars: standard deviation (SD). C. Cell census. t-stochastic neighborhood embedding (t-SNE) of cells, colored by cell subset (legend, STAR Methods). D. Subset specific markers. Expression of marker genes (columns) across cell subsets (rows) ordered by cell lineage relationships (left, color legend, STAR Methods). E. Reproducible cell subset distributions across samples (discovery and validation sets). Fraction of cells (y axis) in each cell subset (bars) that are derived from each healthy (blue), non-inflamed (green), or inflamed (red) sample. Bottom: total cell count in subset (see also Figure S1A). F. Epithelial differentiation. Inferred differentiation trajectory (STAR Methods) for epithelial cell subsets including absorptive (right) and secretory (left) lineages. G-I. New colon cell subsets and their markers. G,I. Fraction of expressing cells (dot size) and mean expression level in expressing cells (dot color) of select marker genes (columns) across subsets (rows). H. Representative images of combined single-molecule fluorescence in situ hybridization (smFISH) and immunofluorescence assay (IFA) of colon tissue microarray (TMA, STAR Methods) for BEST4+ enterocytes (left, white arrow) and RSPO3+ fibroblasts (right, white arrow) in healthy colon. Inset, x3 magnification; scale bar, 50 m. Also see related Figures S1, S2 and Tables S1, S2, and S3.
Figure 2.
Figure 2.. Changes in cell composition and differentiation in UC.
A. Cell proportion changes. Significant changes in cell frequency (y axis) for non-inflamed (light blue) and inflamed (white) samples relative to healthy (dark blue) (Dirichlet-multinomial regression, adjusted p, * = 0.05, ** = 0.01, *** = 0.001); error bars: SEM. B. Relative reduction in plasma cells among B cells in inflamed colon. Left: representative images of combined smFISH and IFA of plasma cells in TMA from healthy (left) and inflamed (middle) human colon; yellow arrow: plasma cell, red arrow: B cell; scale bar, 50 m; Inset, x2.5 magnification. Right: fraction of plasma cells out of total B cells (y axis) in field of view (n = 9 biopsies per condition; * p < 0.05, t-test, error bars: SEM). C. Expansion of IAFs in inflamed colon. Left: representative images of combined smFISH and IFA of IAFs in TMA from healthy (left) and inflamed (middle) human colon; scale bar, 50 m; Right: number of IAFs (y axis) in the field of view (100 m2 per image; n = 9 and n = 7 healthy and inflamed biopsies, respectively; *** p < 5*10−4, t-test, error bars: SEM). D. Reduction in epithelial progenitors with disease. Distribution of diffusion pseudotimes (STAR Methods) for absorptive (top) and secretory (bottom) epithelial cells, colored by disease state, both significantly shifted to later pseudotimes during disease (likelihood ratio test, p = 10−4). Also see related Figure S3.
Figure 3.
Figure 3.. Shared lineage-specific and cell-specific expression changes in non-inflamed and inflamed tissues.
A-G. Lineage- and cell-specific expression changes are shared by non-inflamed and inflamed vs. healthy tissue. A-F. DE genes shared by the disease states (STAR Methods) with their effect size during inflammation (discrete DE coefficient, x axis) and statistical significance (y axis). (A-C) Shared changes among multiple cell subsets within (A) epithelial, (B) innate (stromal/myeloid), or (C) adaptive compartments; (D-F) Unique changes in specific cell subsets within each compartment. Select genes are highlighted; all marker genes are reported in Table S2. G. Discrete DE coefficients estimated for non-inflamed (x axis) and inflamed (y axis) samples vs. healthy samples, for genes that were significantly DE in at least one disease state (96,445 gene-by-subset coefficients, Spearman’s ρ = 0.71, p < 10−16). H. Upregulation of epithelial-MHCII expression in inflamed colon. Representative images of combined smFISH and IFA of epithelial cells from TMA of healthy (left) and inflamed (right) human colon; scale bar, 50 m; Inset, x5 magnification, dashed line: HLA-DRA+ epithelial cell. Also see related Figure S4 and Table S4.
Figure 4.
Figure 4.. Cell-specific expression changes in UC highlight metabolic reprogramming in epithelial cells.
A. Induction of kynurenine pathway in epithelial cells in UC. DE genes (rows) from the kynurenine pathway (left) in inflamed vs. healthy samples across cell subsets (columns). Dot size: fraction of expressing cells in healthy (grey outline) or inflamed (black outline) samples; dot color: significant DE model coefficients (q < 0.05, MAST hurdle model, discrete coefficient). B. Metabolic reprogramming of enterocytes in UC. Expression changes of KEGG pathways (rows) captured by a mixed linear model (color bar) in inflamed vs. healthy samples, for epithelial subsets (all subsets in Figure S5C); black outlines: q < 0.05. C. CD8+IL-17+ T cells induce IL17A/F, IL23R, and cytotoxic, co-stimulatory and co-inhibitory programs in UC. Distribution of gene and program expression (y axis) in T cells (x axis) from healthy (left), non-inflamed (middle), and inflamed (right) samples (Wilcoxon test, * p = 0.05, ** p = 0.01, *** p = 0.001). D. IL17A expression by CD4+CD8+ cells. Representative image of combined smFISH and IFA of CD4, CD8 and IL17A in inflamed human colon TMA (left), showing (inset) CD4+CD8IL17A+ (yellow outlines; upper panels, from yellow inset) and CD4+CD8+IL17A+ (red outlines; lower panels, from red inset) cells; Insets, x5 magnification. E. Number of CD4-CD8+IL17A+ or CD4+CD8+IL17A+ cells in field of view (250mm2). n = 5 samples per condition (* p < 0.05, *** p < 10−4, t-test, error bars: SEM). Also see related Figure S5.
Figure 5.
Figure 5.. IAFs and monocytes are associated with anti-TNF drug resistance via OSM signaling.
A,B. Tregs become major sources of TNF expression in UC. A. Fraction of total TNF transcripts (mean across samples, y axis) expressed by each cell subset in healthy, non-inflamed, and inflamed samples (x axis). Top expressing subsets are highlighted (legend). B. TNF expression by Tregs during inflammation. Left: representative image of combined smFISH and IFA of FOXP3, IL10, and TNFA in inflamed human colon TMA. FOXP3+IL10+TNF (yellow outlines; upper right, from yellow inset) and FOXP3+IL10+TNF+ (red outlines; lower right, from red inset) Tregs are highlighted; Inset, x5 magnification; Blue dashed lines: crypt position in the tissue; Right: number of FOXP3+IL10+TNF+ cells in field of view (250μm2). n = 5 samples per condition (** p < 0.005, t-test, error bars: SEM). C. OSM and OSMR expression by MHCII+ myeloid cells and IAFs, respectively. Representative images of combined smFISH and IFA of TMA from healthy (left) and inflamed (right) human colon. Top: MHCII+ myeloid cells (i.e. inflammatory monocytes or DC2), yellow arrows; Bottom: IAFs, white arrows; scale bar, 50μm; Inset, x5 magnification. D-G. IAF, inflammatory monocyte and DC2 subsets are associated with anti-TNF resistance. D. Distribution of signature scores (x axis) for anti-TNF resistance (left) and sensitivity (right) in select cell subsets (y axis). E. Mean expression level (color) and fraction of cells (dot size) expressing genes in the anti-TNF resistance signature (columns, ordered by signature rank, bottom bar) in select cell subsets (rows). Arrows: genes whose highest expression is in IAFs. F. Distribution of signature scores for cell subsets (x axis) in bulk RNA-Seq (Arijs et al., 2009) from human colon biopsies (y axis) of drug responders, non-responders, and healthy controls. G. TNF signaling (KEGG) signature score (x axis) vs. drug resistance (left, y axis), drug sensitivity (middle, y axis), and OSM signaling (right, y-axis) signature scores in each cell subset (dots) labeled by lineage (color) and mean proportion across samples (size). Also see related Figure S5.
Figure 6.
Figure 6.. Re-wiring of cell-cell interactions explains shifts in cellular proportions during disease.
A-C. Increased decompartmentalization with disease. Cell-cell interaction networks estimated in (A) healthy, (B) non-inflamed, and (C) inflamed tissue. Nodes: cell subsets, annotated by lineage (color) and mean proportions (size). Edges connect pairs of cell subsets with a significant excess of cognate receptor-ligand pairs expressed (light grey, p < 0.05) or DE (dark grey, p < 0.05) in a disease state, relative to a null model (STAR Methods, Table S5). D. Colitis-associated cell subsets are central nodes in the interaction networks. Mean betweenness centrality (x axis) for each cell subset (y axis) across healthy, non-inflamed, and inflamed networks, showing the 10 highest ranked cell subsets, and the mean across all other subsets (bottom bar). E-G. Receptor-ligand interactions explain changes in cell proportions. E. Each panel shows for a pair of cells connected by a receptor-ligand interaction, the mean expression level of the ligand in one cell subset (x-axis) and the logit-transformed proportion of the cell subset expressing the receptor (y-axis) in each sample, labeled by disease state (color). Dashed line: best linear fit. F. Example LASSO model explaining the change in CD8+IL-17+ T cell proportions across samples as a function of positive (dark arrows) and negative (light arrows) relationships with ligands (edge label) expressed by other cell subsets colored by lineage. G. The fraction of variance (y axis) in the proportion of each cell subset (x axis) explained by a LASSO model of cell interactions as in F (red dot, STAR Methods) and distribution of this statistic in 100 null models (black dots, STAR Methods). Only subsets with a significant model (p < 0.05) are shown, ordered from left by decreasing fraction of variance explained. See also related Figure S6 and Table S5.
Figure 7.
Figure 7.. Modules of co-regulated risk genes help predict genes, pathways, and cell types targeted by IBD.
A. Cell type specific expression of putative IBD risk genes. Mean expression of GWAS-implicated IBD risk genes (columns) across cell subsets (rows), that were identified as cell- or lineage-specific in both healthy and UC cells (left), only in healthy cells (center), or only in UC cells (right). Asterisks: genes with significantly changed specificity between health and UC. B. Induction of putative IBD risk genes in specific subsets in disease. Mean expression of GWAS-implicated IBD risk genes across cell subsets (marked by lineage, color) in healthy (x axis) and inflamed (y axis) samples. C. Functional annotation of putative IBD risk genes by co-expression meta-modules within a cell subset. Number (bottom x axis) and percent (top x axis) of GWAS-implicated IBD risk genes captured (solid line) by the successive addition of each meta-module seeded by an IBD risk gene (y axis) using healthy (blue) or UC (red) cells, relative to a null model (dashed line). Left labels: cell type and seed gene. Right label: GWAS-implicated IBD risk genes in meta-module. D,E. Meta-modules help nominate causal IBD risk genes from GWAS risk loci. D. Mean number of “correct” predictions (left y axis) and mean percent accuracy (right y axis) across 20 risk regions for IBD and UC (left) and 22 risk regions unique to CD (right), for several methods based on scRNA-Seq relative to the null model (x axis). * p = 0.05, ** p = 0.01, *** p = 0.001, Wilcoxon test. E. Nominated risk genes. Loci containing GWAS-implicated IBD risk genes with correct (white) or incorrect (grey) predictions, loci associated with a single gene (gold), and all other loci (green). Incorrect predictions are annotated with the predicted (top) and “correct” (bottom) gene. See also related Figure S7 and Tables S6 and S7.

Comment in

References

    1. Arijs I, Li K, Toedter G, Quintens R, Van Lommel L, Van Steen K, Leemans P, De Hertogh G, Lemaire K, Ferrante M, et al. (2009). Mucosal gene signatures to predict response to infliximab in patients with ulcerative colitis. Gut 58, 1612–1619. - PubMed
    1. Atreya R, Zimmer M, Bartsch B, Waldner MJ, Atreya I, Neumann H, Hildner K, Hoffman A, Kiesslich R, Rink AD, et al. (2011). Antibodies against tumor necrosis factor (TNF) induce T-cell apoptosis in patients with inflammatory bowel diseases via TNF receptor 2 and intestinal CD14(+) macrophages. Gastroenterology 141, 2026–2038. - PubMed
    1. Attanasio J, and Wherry EJ (2016). Costimulatory and Coinhibitory Receptor Pathways in Infectious Disease. Immunity 44, 1052–1068. - PMC - PubMed
    1. Bastian M, Heymann S, and Jacomy M (2009). Gephi: An Open Source Software for Exploring and Manipulating Networks.
    1. Benjamini Y, and Hochberg Y (1995). Controlling the False Discovery Rate: A Practical and Powerful Approach to Multiple Testing. Journal of the Royal Statistical Society Series B (Methodological) 57, 289–300.

Publication types

MeSH terms