. 2019 Oct 15:1721:146345.
doi: 10.1016/j.brainres.2019.146345. Epub 2019 Jul 23.

Somatic mosaicism of sex chromosomes in the blood and brain

Affiliations

Somatic mosaicism of sex chromosomes in the blood and brain

Emma J Graham et al. Brain Res. .

Abstract

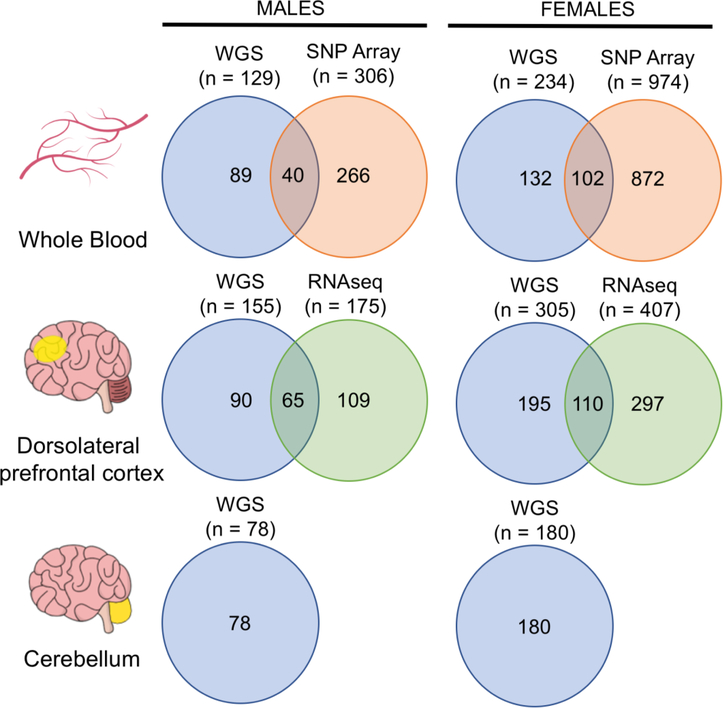
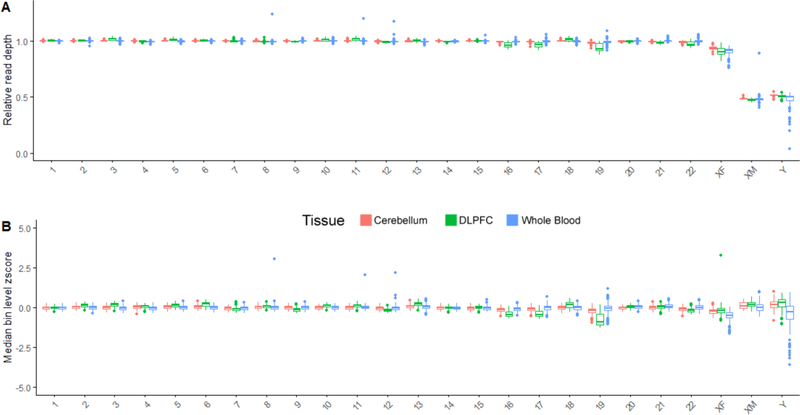
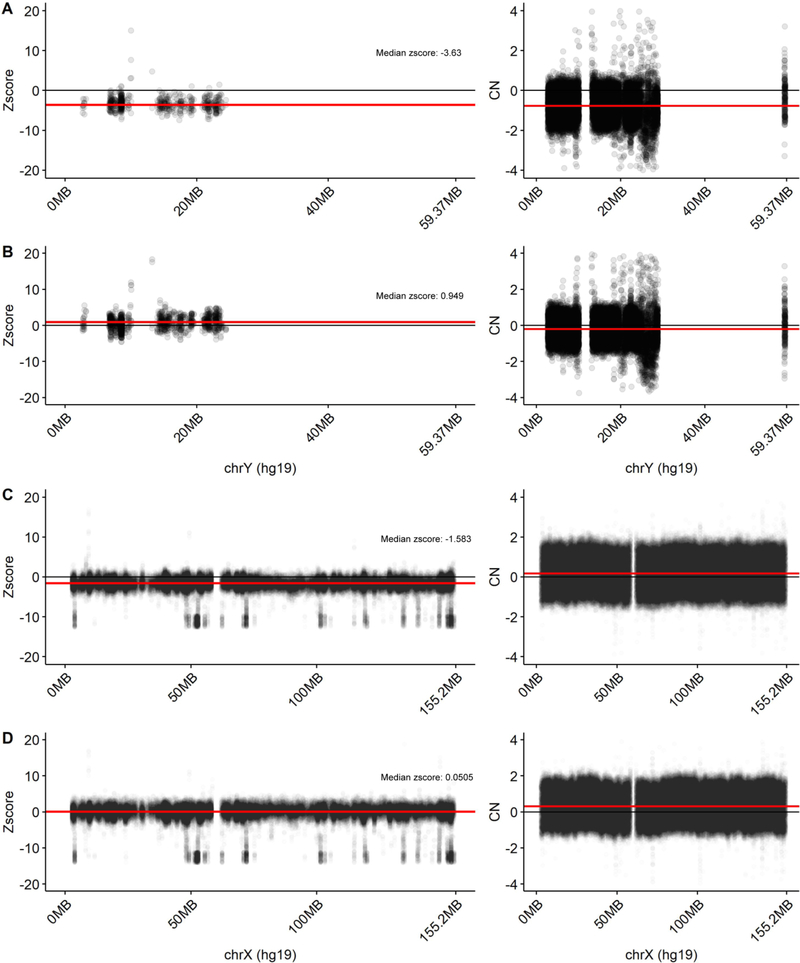
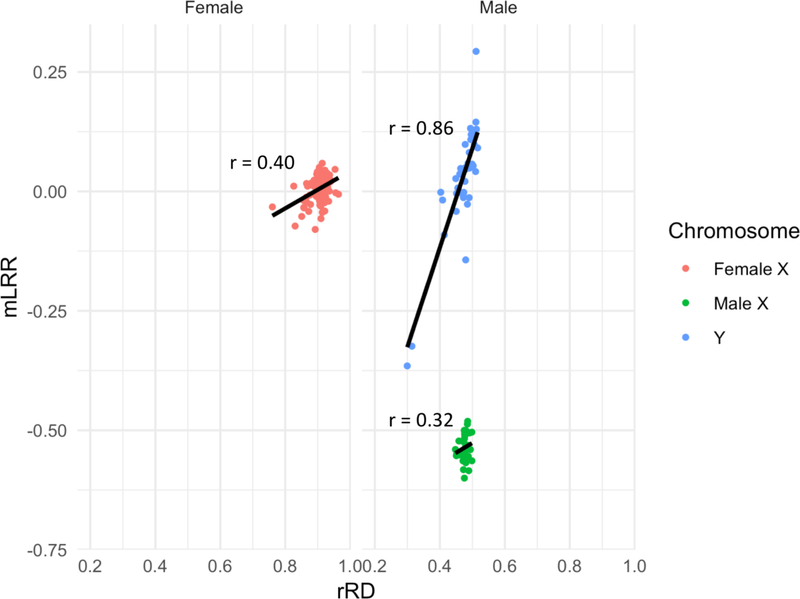
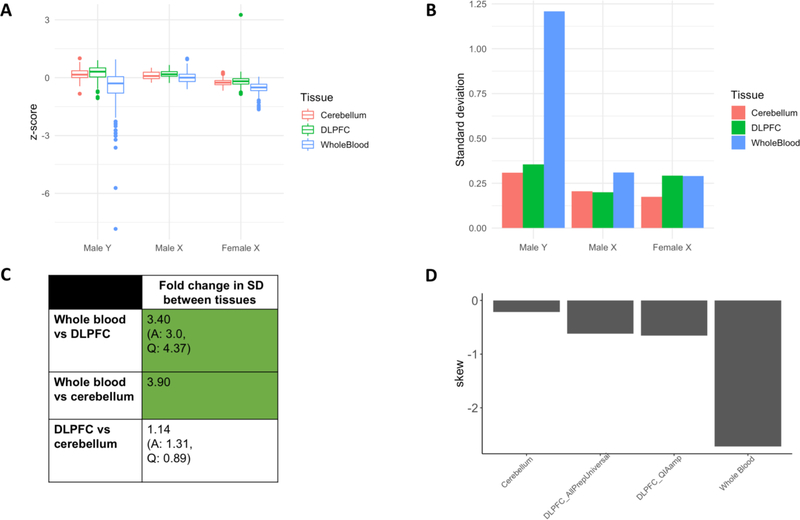
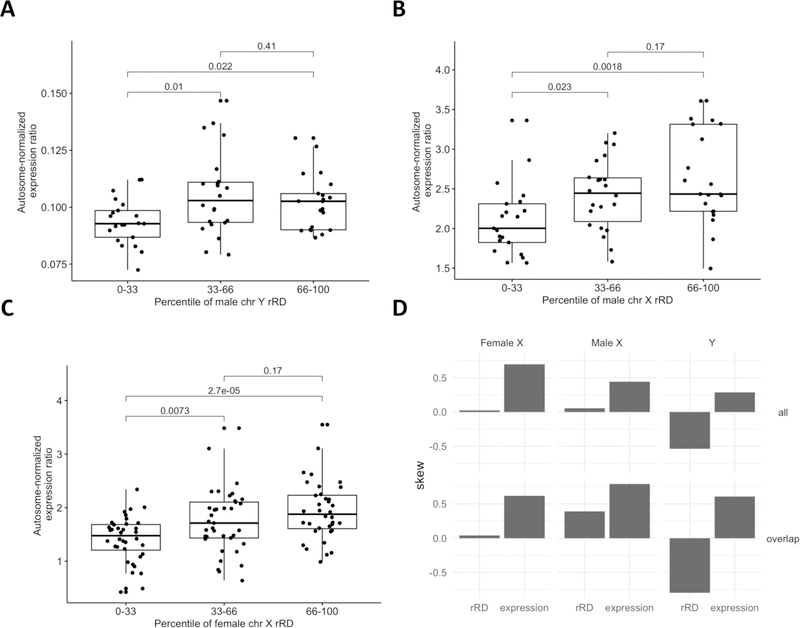
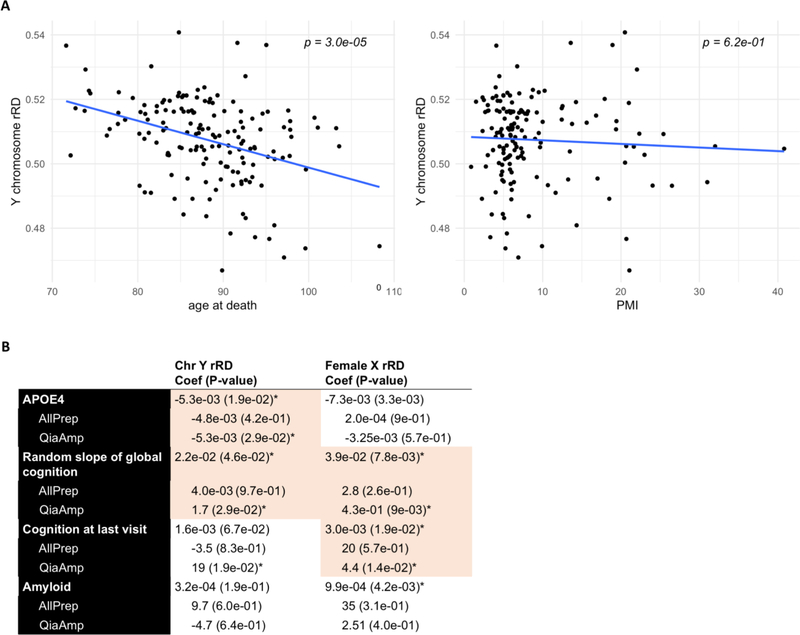
In the blood, mosaic somatic aneuploidy (mSA) of all chromosomes has been found to be associated with adverse health outcomes, including hematological cancer. Sex chromosome mSA in the blood has been found to occur at a higher rate than autosomal mSA. Mosaic loss of the Y chromosome is the most common copy number alteration in males, and has been found to be associated with Alzheimer's disease (AD) in blood lymphocytes. mSA of the sex chromosomes has also been identified in the brain; however, little is known about its frequency across individuals. Using WGS data from 362 males and 719 females from the ROSMAP cohort, we quantified the relative rate of sex chromosome mSA in the dorsolateral prefrontal cortex (DLPFC), cerebellum and whole blood. To ascertain the functionality of observed sex chromosome mosaicism in the DLPFC, we examined its correlation with chromosome X and Y gene expression as well as neuropathological and clinical characteristics of AD and cognitive ageing. In males, we found that mSA of the Y chromosome occurs more frequently in blood than in the DLPFC or cerebellum. In the DLPFC, the presence of at least one APOE4 allele was associated with a reduction in read depth of the Y chromosome (p = 1.9e-02). In the female DLPFC, a reduction in chromosome X read depth was associated with reduced cognition at the last clinical visit and faster rate of cognitive decline (p = 7.8e-03; p = 1.9e-02). mSA of all sex chromosomes in the DLPFC were associated with aggregate measures of gene expression, implying functional impact. Our results provide insight into the relative rate of mSA between tissues and suggest that Y and female X chromosome read depth in the DLPFC is modestly associated with late AD risk factors and cognitive pathologies.

Keywords: Alzheimer's disease; Aneuploidy; Sex differences; Somatic mosaicism; Whole genome sequencing.


Figures

Figure 1:
Figure 1:. Overview of ROSMAP study data.
Whole blood samples from males and females were analyzed through WGS (males = 129, females = 234) and Affymetrix Genotype Array 6.0 (males = 306, females = 974). Data from both WGS and SNP array was available for 40 males and 102 females. Samples from the dorsolateral prefrontal cortex (males = 155, females = 305) and cerebellum (males = 78, females = 180) were analyzed through WGS. RNA sequencing (RNA-seq) was performed on DLPFC samples from 175 males and 407 females. Joint WGS and RNA-seq profiling data from the DLPFC was available in 65 males and 110 females.
Figure 2:
Figure 2:. Schematic depicting z-normalization procedure for sex chromosomes in a single sample.
Z-normalization was performed to adjust for technical artifacts due to the use of different DNA extraction kits in different tissues. 1) First, raw read counts in the autosomes were binned into irregularly sized, non-contiguous bins defined as high mappability regions by the Genome In a Bottle (GIAB) consortium. Sex chromosomes were binned into continuous 998bp bins along the non-PAR1 and PAR2 regions. 2) All bins with a mean ENCODE CRG mappability score less than 0.9 and GC content greater than 45 and less than 55 percent were removed. 3) All remaining 1–3kbp bins in the autosomes were isolated and 4) used to form a sample-specific reference distribution of expected count in 1–3kbp bins. 5) In each sex chromosome, per-bin read depth was z-normalized using the mean and standard deviation of the reference distribution. For haploid chromosomes, the mean and standard deviation were multiplied by 0.5. The median per-bin z-score in each chromosome was considered the z-score for that chromosome (referred to as “z-score”).
Figure 3:
Figure 3:. Estimation of chromosomal content in three tissues across 1081 individuals using WGS.
Each point in the boxplot is a single individual. A) Relative read depth (rRD) in each chromosome across different tissues. rRD was defined as the ratio of the median read depth along high mappability regions that passed filtering criteria (see Methods section 2.4) in each chromosome and the median whole genome read depth. Depicted data includes both male (n = 363) and female (n = 719) samples that originates from whole blood (males = 129, females = 234), DLPFC (males = 155, females = 305) and cerebellar (males = 78, females = 180) tissues. As expected, the normalized read depth for diploid chromosomes are approximately centered at 1, and haploid chromosomes are approximately centered at 0.5. B) Median bin-level z-score for each chromosome, as calculated by the pipeline depicted in Figure 2. The same individuals are profiled in A and B. Briefly, bins between 1–3kb in size along each chromosome were z-normalized to a reference distribution of all 1–3kb bins in the autosomes. In the male haploid sex chromosomes, to account for differences in expected read depth and variation, z-normalization was performed using 0.5 times the mean and standard deviation of the reference distribution. As expected, the z-score distribution is approximately centered at 0 for all chromosomes.
Figure 4.
Figure 4.. Identification of copy number variants (CNVs) across the X and Y chromosome using HMMcopy.
To ensure that estimates of rRD and z-score for a specific individual were not confounded by the presence of sub-chromosomal CNVs, we used HMMcopy to identify CNVs in our sample. No CNVs were detected in any sample. The X and Y chromosome bin-level z-score and copy number (HMMcopy) profile are provided. The package QCDNAseq was used to normalize the expression data prior to input to HMMcopy. A) Z-score and QCDNAseq normalized copy numbers for the sample with the lowest median z-score in the blood in the Y chromosome. B) Z-score and QCDNAseq normalized copy numbers for the sample with the highest median z-score in the blood in the Y chromosome. C) Z-score and QCDNAseq normalized copy numbers for the sample with the highest median z-score in the blood in the X chromosome. D) Z-score and QCDNAseq normalized copy numbers (input to HMMcopy) for the sample with the lowest median z-score in the blood in the X chromosome. Each point represents the z-score/CN value of a bin. The red line represents the per-sample median of z-score/CN values across the entire chromosome. The black line demarcates a z-score/CN value of zero. The red line demarcates the median z-score/CN value in each sample.
Figure 5:
Figure 5:. Correlation between median Log R ratios (mLRR) and relative read depth (rRD) measurements of the X and Y chromosome in males and females.
In order to assess the validity of the rRD metric, we assessed its correlation with HapMap-normalized mLRR values from the Affymetrix genotyping array 6.0 on the Y chromosome and X chromosome in 41 male and 102 female individuals. mLRR values for the male X chromosome are lower than those for the female because males and females were analyzed in the same Affymetrix workflow and the haploid males will have lower mLRR-X values than the diploid females.
Figure 6:
Figure 6:. Relative rate and direction (hypoploidy vs hyperploidy) of chromosome Y mSA in whole blood, DLPFC and cerebellar tissues.
A) z-score distribution for the male X, female X and male Y chromosomes as measured in whole blood, DLPFC and cerebellum. B) SD of z-score distributions in A. These values were used to compute the fold change differences in C. C) Fold change in SD between tissues for the Y chromosome (FC = larger SD/smaller SD). Green shading indicates that the FC in SD between tissues was larger than the maximum SD differences attributable to extraction kit alone (referred to as FC threshold, Supplemental Figure 4B). Standard deviation in Y chromosomal content is 3.40-fold (plus or minus 2.34) higher in whole blood than in DLPFC, and 3.9-fold (plus or minus 2.34) higher than in the cerebellum. D) Skew of Y chromosome z-score distribution in whole blood, DLPFC and cerebellum. In the Y chromosome, a greater negative skew is observed in the blood than in the brain. Because distributions varied by extraction kit, we present the skew of both the AllPrepUniversal and QIAamp samples separately.
Figure 7:
Figure 7:. Relationship between sex chromosome rRD and proportion of gene expression attributable to that chromosome.
A, B, C) Here, rRD was used instead of z-score because rRD exhibits improved overall correlation with mLRR. Further, a single DNA extraction kit (QIAamp) was used to extract both the WGS and RNAseq data, therefore negating the need for kit-specific correction. Briefly, a measure of the proportion of gene expression attributable to the sex chromosomes was defined as the ratio of the median of the top 20 highly expressed genes on the sex chromosome in question (or top 13 on the Y) to the median of the top 440 highly expressed genes across all autosomes (20 from each autosome, see Methods, section 2.7.1). An increase in total amount of a sex chromosome in the sample would be expected to lead to an increase in the proportion of that chromosome’s gene expression relative to the autosomes. After correcting for RIN score, PMI and RNA sequencing batch, correlation between rRD and Y expression ratio and X expression ratio was observed in the male Y and female X chromosomes (Y chr: r = 0.29, p = 2.42e-02, female X chr: r = 0.36, p =1.2e-04; male X chr: r = 0.23, p = 6.5e-02). P-values from ANOVA are shown on graphs for ease of visualization. D) Distribution in skew across all WGS and RNAseq data. “all” signifies the skew in all available data for each data type, not just those individuals common to WGS and RNA-seq analyses. “Common” signifies the skew in the data common to both WGS and RNA-seq analyses. In the female and male X chromosomes, positive skew is observed at both the RNA and DNA level. In contrast, in the Y chromosome, conflicting skew is observed at the DNA and RNA level.
Figure 8.
Figure 8.. Associations between neuropathological and clinical markers of ageing and AD and chromosome Y/female chromosome X mSA.
A) Association between rRD in the Y chromosome with age and PMI (controlling for extraction kit). Y chromosome rRD was significantly negatively correlated with age (p = 2.92e-05), but not with PMI. B) A linear model was used to assess the relationship between rRD and APOE4 status, slope of global cognition, cognition at last visit and amyloid content, subsetting by extraction kit and controlling for age at death and PMI. Because extraction kit was known to influence the rRD distribution, we performed two separate analyses with clinical data: one analysis that included extraction kit as a covariate in a linear model (referred to as “combined” model), and another that treated each extraction kit as a separate dataset (“single” model). A criteria for considering the correlations identified in the combined analysis as internally valid was that in the single model, the direction of correlation was concordant between the two extraction kits and statistical significance was reached in at least one kit. Associations that meet both criteria are shaded red. Asterisks signify significance at p < 0.05.

References

    1. Arendt T, Bruckner ML, Mosch B, Losche A, 2010. Selective cell death of hyperploid neurons in Alzheimer’s disease. Am J Pathol. 177 pp. 15–20 - PMC - PubMed
    1. Arendt T, Bruckner MK, Losche A, 2015. Regional mosaic genomic heterogeneity in the elderly and in Alzheimer’s disease as a correlate of neuronal vulnerability. Acta Neuropathol. 130 pp. 501–510 - PubMed
    1. Bennett DA, Buchman AS, Boyle PA, Barnes LL, Wilson RS, Schneider JA, 2018. Religious Orders Study and Rush Memory and Aging Project. J. Alzheimer’s Dis. doi:10.3233/JAD-179939 - DOI - PMC - PubMed
    1. Berletch B, Yang F, Xu J, Carrel L, Disteche CM, 2011. Genes that escape from X inactivation. 130(2). pp 237–45. - PMC - PubMed
    1. Boeras DI, Granic A, Padmanabhan J, Crespo NC, Rojiani AM, Potter H, 2008. Alzheimer’s presenilin 1 causes chromosome missegregation and aneuploidy. Neurobiol Aging. 29 pp. 319–328 - PMC - PubMed

Publication types