

PTPRM, a candidate tumor suppressor gene in small intestinal neuroendocrine tumors
- PMID: 31349215
- PMCID: PMC6687034
- DOI: 10.1530/EC-19-0279
PTPRM, a candidate tumor suppressor gene in small intestinal neuroendocrine tumors
Abstract
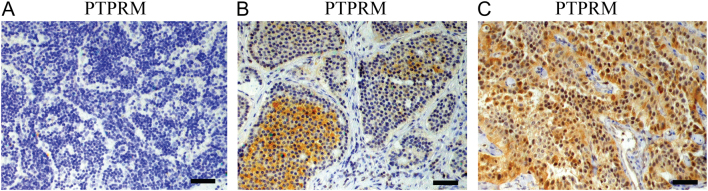
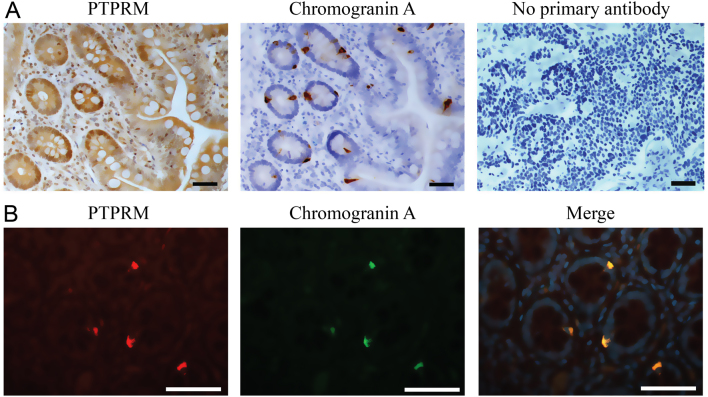
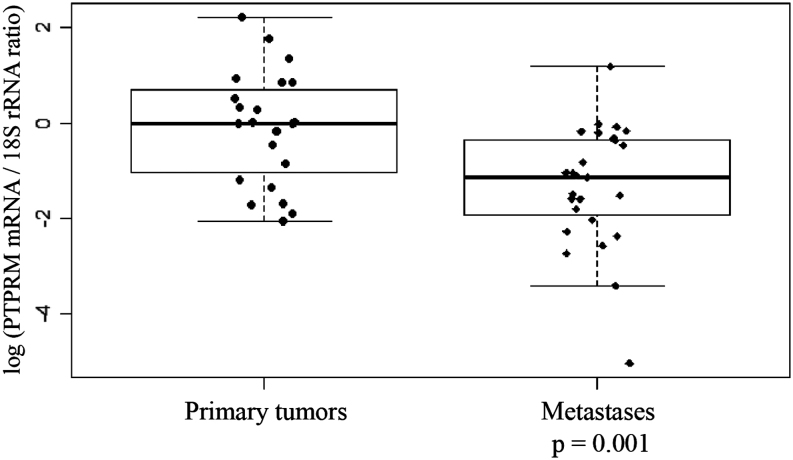
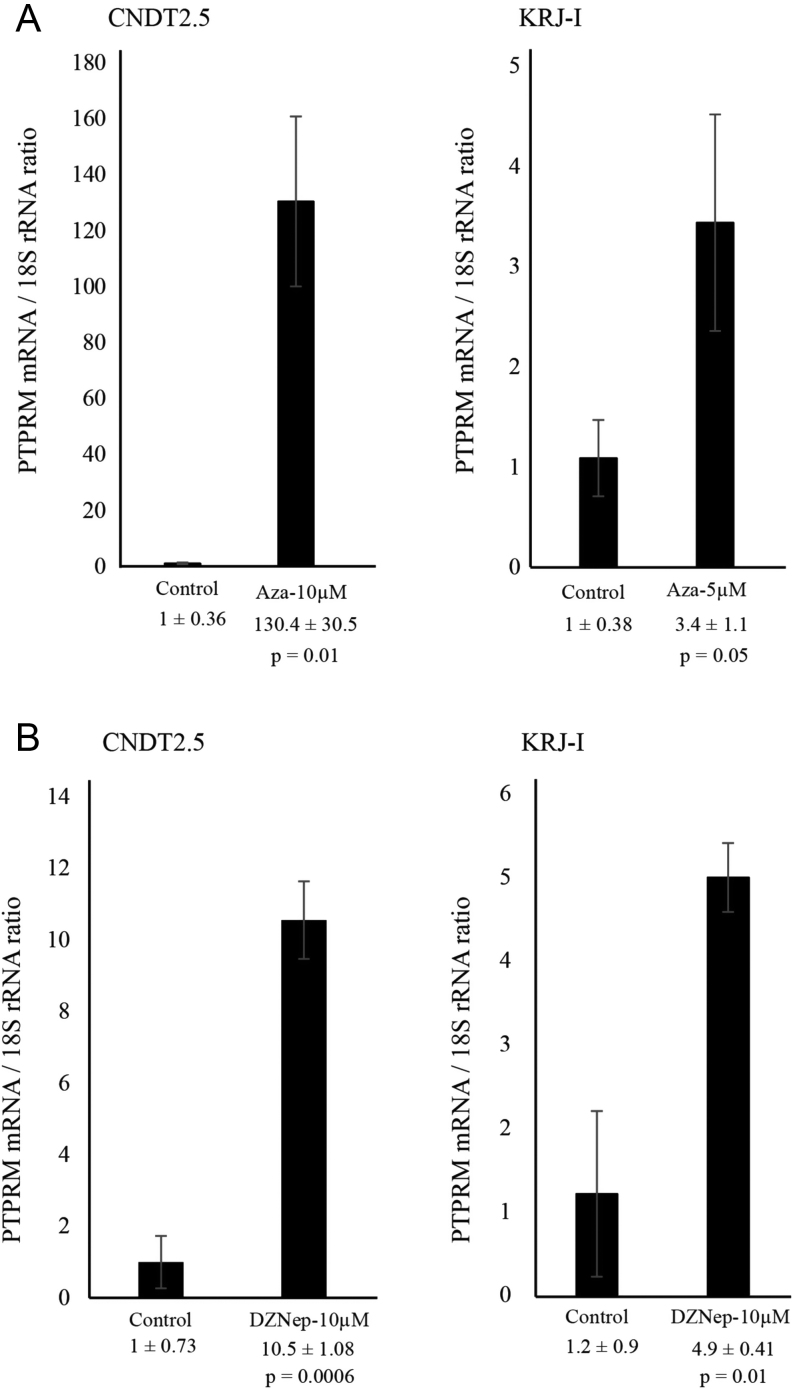
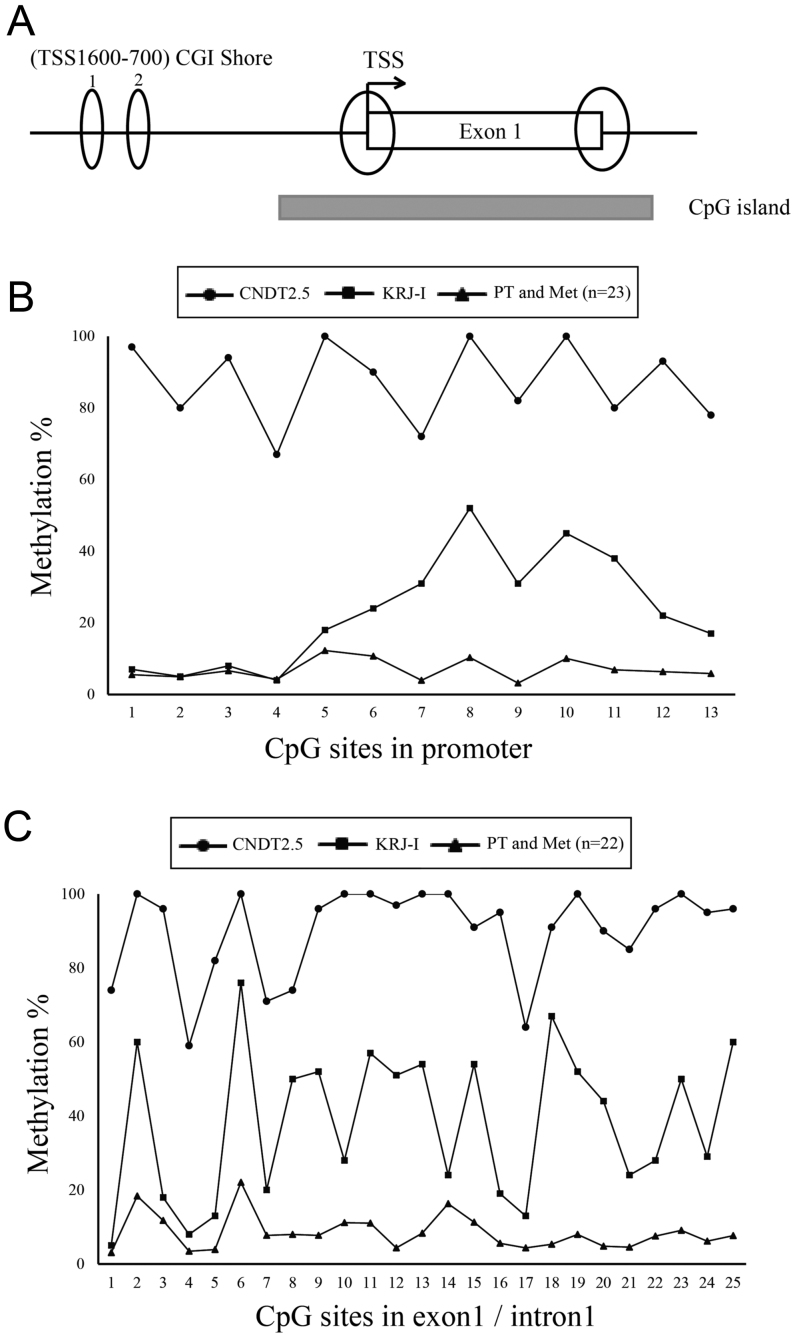
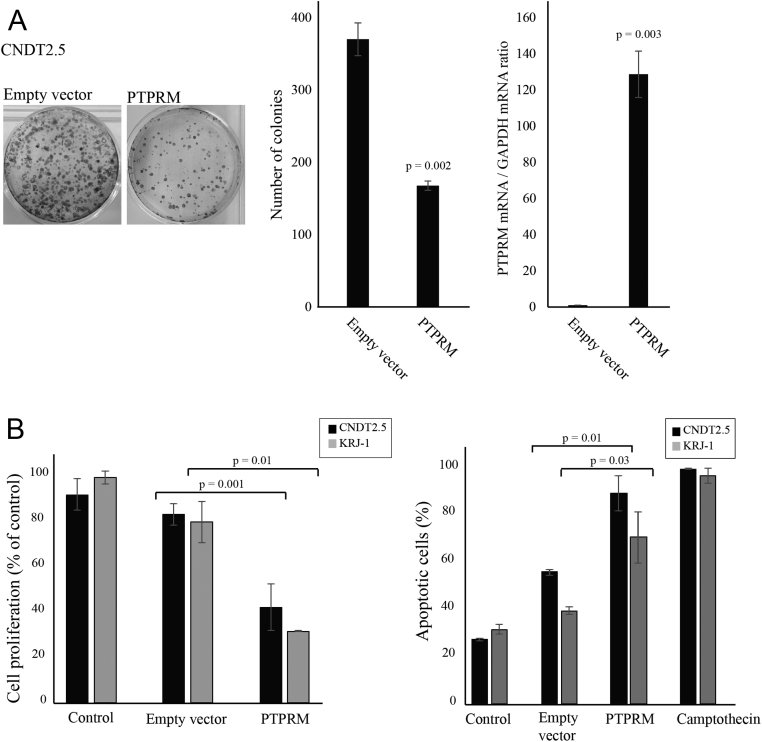
Small intestinal neuroendocrine tumors (SI-NETs) are small, slow growing neoplasms with loss of one copy of chromosome 18 as a common event. Frequently mutated genes on chromosome 18 or elsewhere have not been found so far. The aim of this study was to investigate a possible tumor suppressor role of the transmembrane receptor type tyrosine phosphatase PTPµ (PTPRM at 18p11) in SI-NETs. Immunohistochemistry, quantitative RT-PCR, colony formation assay and quantitative CpG methylation analysis by pyrosequencing were performed. Undetectable/very low levels of PTPRM or aberrant pattern of immunostaining, with both negative and positive areas, were detected in the majority of tumors (33/40), and a significantly reduced mRNA expression in metastases compared to primary tumors was observed. Both the DNA methylation inhibitor 5-aza-2'-deoxycytidine and the S-adenosylhomocysteine hydrolase inhibitor 3-deazaneplanocin A (DZNep) induced PTPRM expression in CNDT2.5 and KRJ-I SI-NET cells. CpG methylation of upstream regulatory regions, the promoter region and the exon 1/intron 1 boundary was detected by pyrosequencing analysis of the two cell lines and not in the analyzed SI-NETs. Overexpression of PTPRM in the SI-NET cell lines reduced cell growth and cell proliferation and induced apoptosis. The tyrosine phosphatase activity of PTPRM was not involved in cell growth inhibition. The results support a role for PTPRM as a dysregulated candidate tumor suppressor gene in SI-NETs and further analyses of the involved mechanisms are warranted.
Keywords: DNA methylation; PTPRM; SI-NETs; epigenetic; neuroendocrine tumors.
Figures

Similar articles
-
TCEB3C a putative tumor suppressor gene of small intestinal neuroendocrine tumors.Endocr Relat Cancer. 2014 Feb 27;21(2):275-84. doi: 10.1530/ERC-13-0419. Print 2014 Apr. Endocr Relat Cancer. 2014. PMID: 24351681
-
Decrease of 5-hydroxymethylcytosine and TET1 with nuclear exclusion of TET2 in small intestinal neuroendocrine tumors.BMC Cancer. 2018 Jul 25;18(1):764. doi: 10.1186/s12885-018-4579-z. BMC Cancer. 2018. PMID: 30045709 Free PMC article.
-
A plausible role for actin gamma smooth muscle 2 (ACTG2) in small intestinal neuroendocrine tumorigenesis.BMC Endocr Disord. 2016 Apr 23;16:19. doi: 10.1186/s12902-016-0100-3. BMC Endocr Disord. 2016. PMID: 27107594 Free PMC article.
-
Genetics and epigenetics in small intestinal neuroendocrine tumours.J Intern Med. 2016 Dec;280(6):584-594. doi: 10.1111/joim.12526. Epub 2016 Jun 16. J Intern Med. 2016. PMID: 27306880 Review.
-
Gene methylation in gastric cancer.Clin Chim Acta. 2013 Sep 23;424:53-65. doi: 10.1016/j.cca.2013.05.002. Epub 2013 May 10. Clin Chim Acta. 2013. PMID: 23669186 Review.
Cited by
-
Role of protein tyrosine phosphatase receptor type M in epithelial ovarian cancer progression.J Ovarian Res. 2023 Jul 4;16(1):131. doi: 10.1186/s13048-023-01220-3. J Ovarian Res. 2023. PMID: 37403117 Free PMC article.
-
Characterization of Poorly Cohesive and Signet Ring Cell Carcinomas and Identification of PTPRM as a Diagnostic Marker.Cancers (Basel). 2022 May 19;14(10):2502. doi: 10.3390/cancers14102502. Cancers (Basel). 2022. PMID: 35626106 Free PMC article.
-
High expression of PTPRM predicts poor prognosis and promotes tumor growth and lymph node metastasis in cervical cancer.Cell Death Dis. 2020 Aug 11;11(8):687. doi: 10.1038/s41419-020-02826-x. Cell Death Dis. 2020. PMID: 32826853 Free PMC article.
-
Identification of proline-rich protein 11 as a major regulator in mouse spermatogonia maintenance via an increase in BMI1 protein stability.Mol Biol Rep. 2022 Oct;49(10):9555-9564. doi: 10.1007/s11033-022-07846-8. Epub 2022 Aug 18. Mol Biol Rep. 2022. PMID: 35980531
-
Whole-Genome Resequencing to Study Brucellosis Susceptibility in Sheep.Front Genet. 2021 Jul 8;12:653927. doi: 10.3389/fgene.2021.653927. eCollection 2021. Front Genet. 2021. PMID: 34306007 Free PMC article.
References
-
- Zhang HY, Rumilla KM, Jin L, Nakamura N, Stilling GA, Ruebel KH, Hobday TJ, Erlichman C, Erickson LA, Lloyd RV. Association of DNA methylation and epigenetic inactivation of RASSF1A and beta-catenin with metastasis in small bowel carcinoid tumors. Endocrine 2006. 30 . (10.1007/s12020-006-0008-1) - DOI - PubMed
LinkOut - more resources
Full Text Sources
Other Literature Sources
