

MetaInsight: An interactive web-based tool for analyzing, interrogating, and visualizing network meta-analyses using R-shiny and netmeta
- PMID: 31349391
- PMCID: PMC6973101
- DOI: 10.1002/jrsm.1373
MetaInsight: An interactive web-based tool for analyzing, interrogating, and visualizing network meta-analyses using R-shiny and netmeta
Abstract
Background: Network meta-analysis (NMA) is a powerful analysis method used to identify the best treatments for a condition and is used extensively by health care decision makers. Although software routines exist for conducting NMA, they require considerable statistical programming expertise to use, which limits the number of researchers able to conduct such analyses.
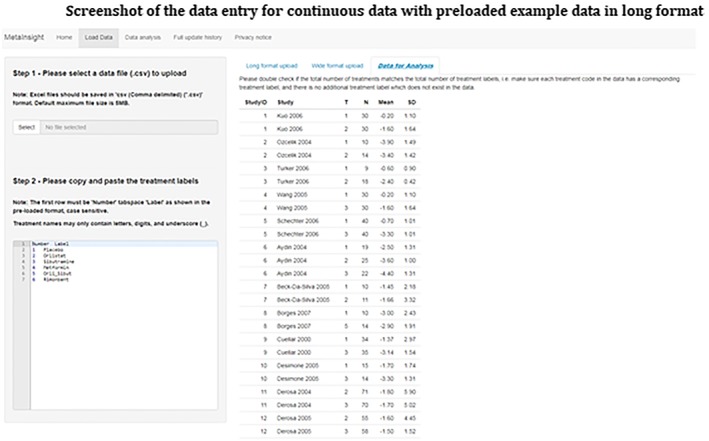
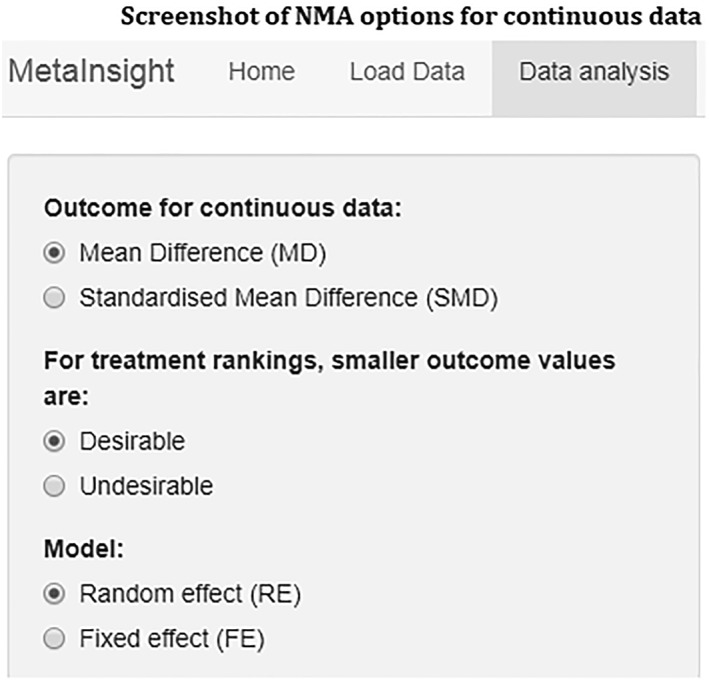
Objectives: To develop a web-based tool allowing users with only standard internet browser software to be able to conduct NMAs using an intuitive "point and click" interface and present the results using visual plots.
Methods: Using the existing netmeta and Shiny packages for R to conduct the analyses, and to develop the user interface, we created the MetaInsight tool which is freely available to use via the web.
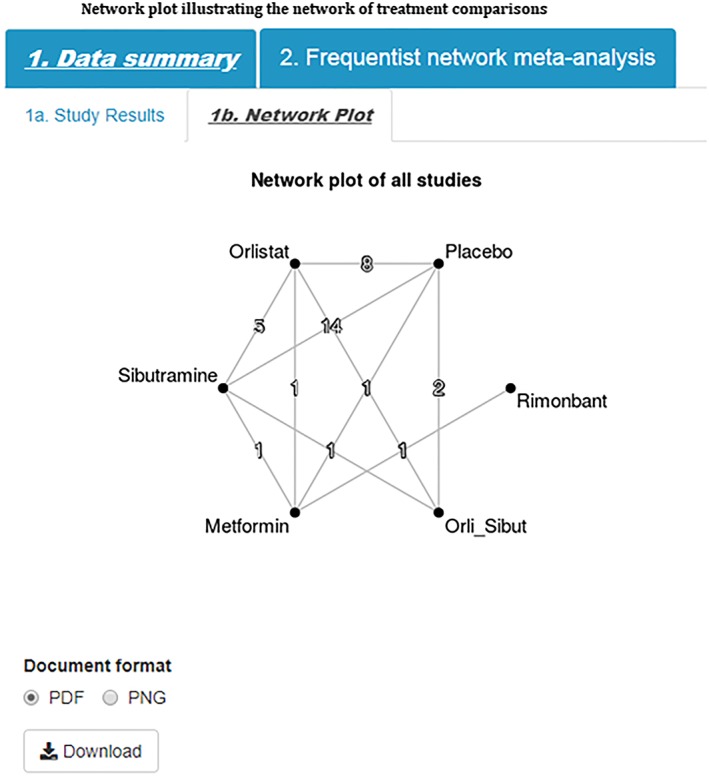
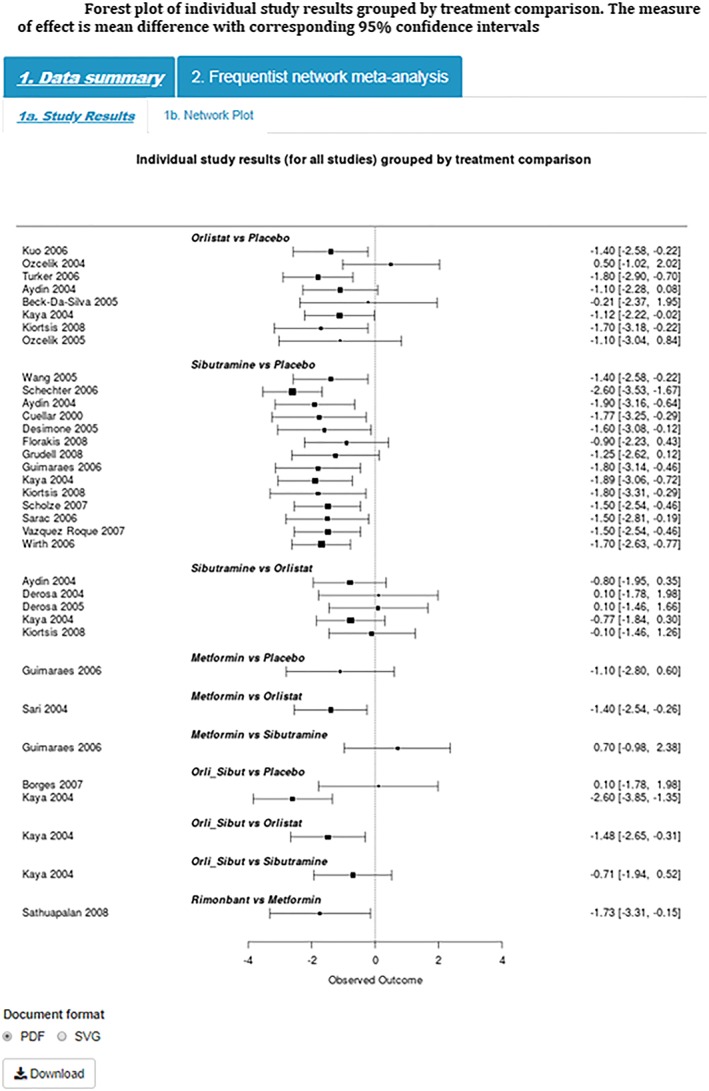
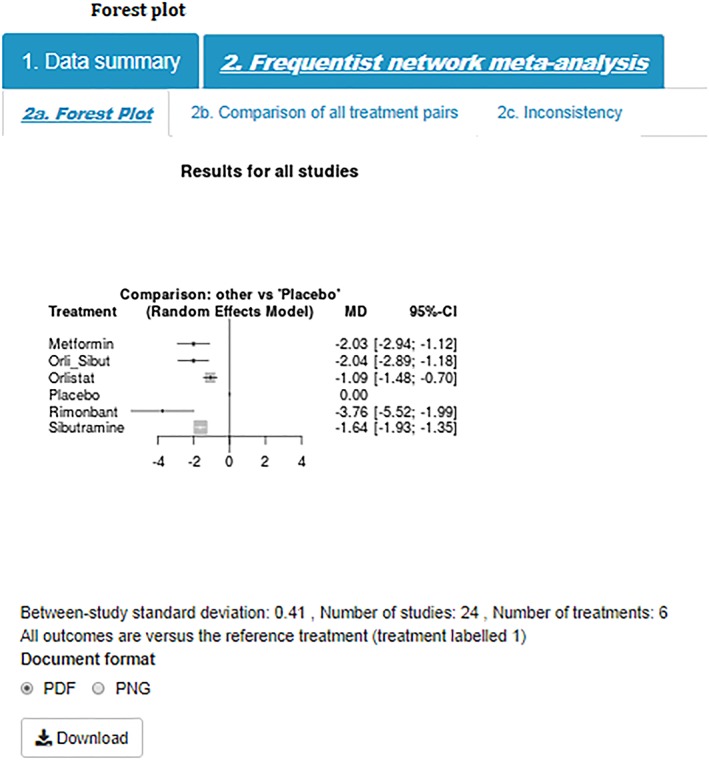
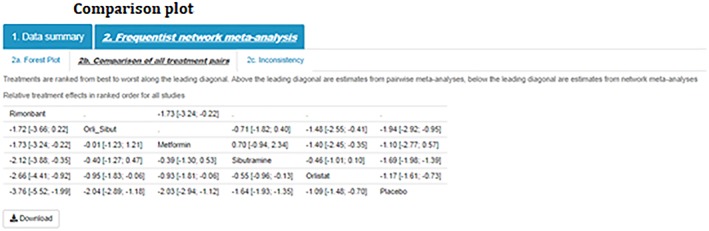
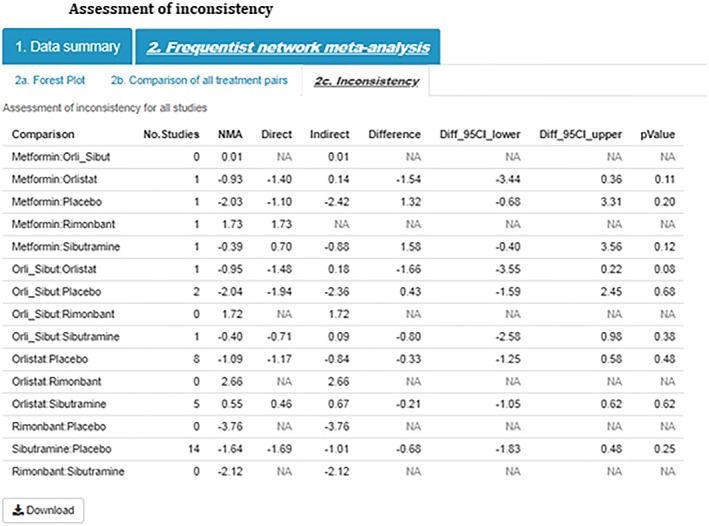
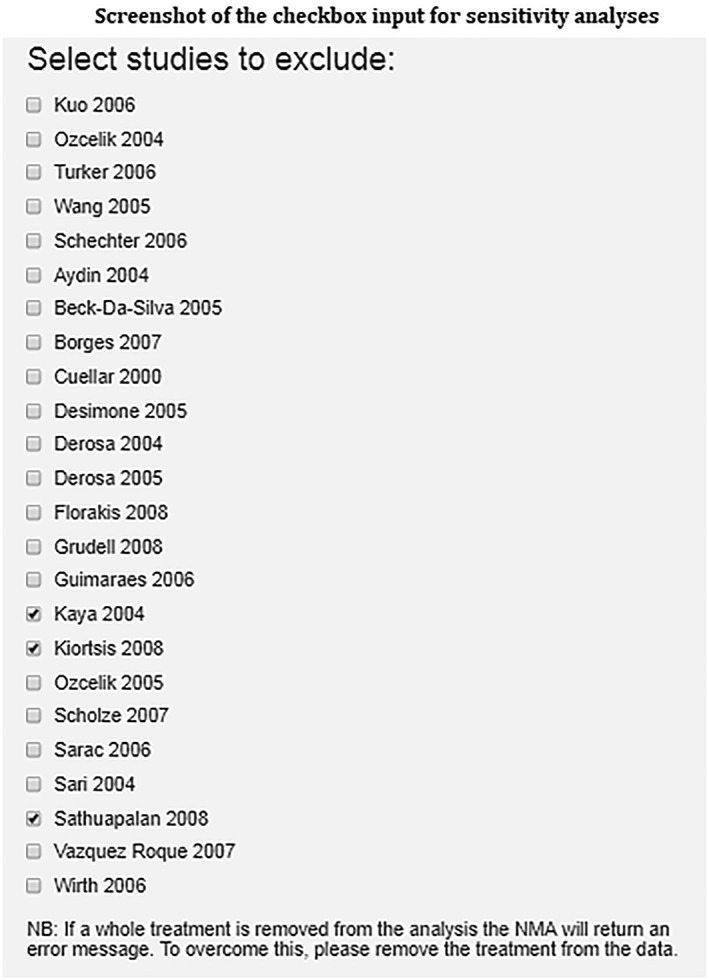
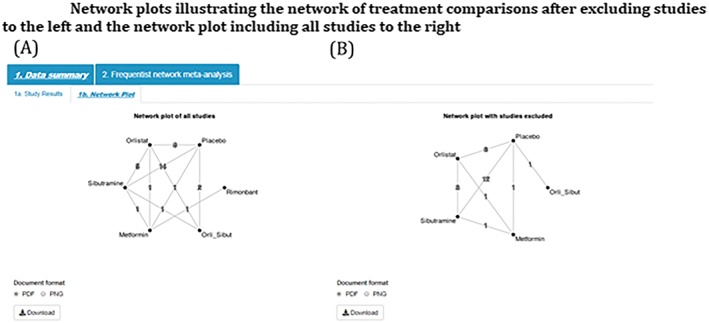
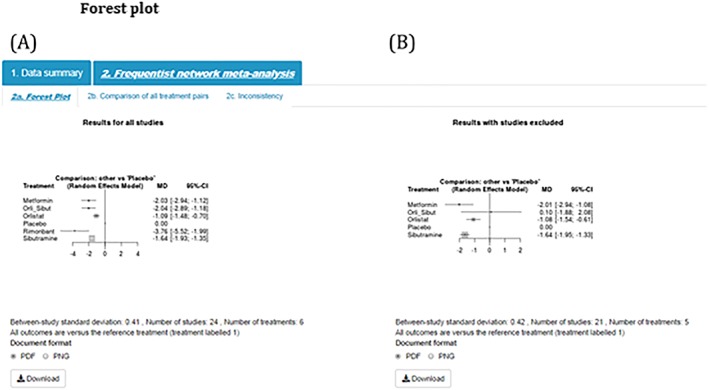
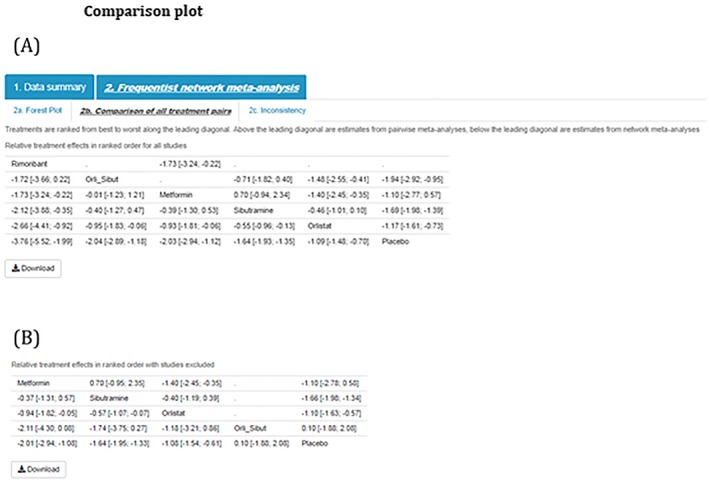
Results: A package was created for conducting NMA which satisfied our objectives, and this is described, and its application demonstrated, using an illustrative example.
Conclusions: We believe that many researchers will find our package helpful for facilitating NMA as well as allowing decision makers to scrutinize presented results visually and in real time. This will impact on the relevance of statistical analyses for health care decision making and sustainably increase capacity by empowering informed nonspecialists to be able to conduct more clinically relevant reviews. It is also hoped that others will be inspired to create similar tools for other advanced specialist analyses methods using the freely available technologies we have adopted.
© 2019 The Authors. Research Synthesis Methods published by John Wiley & Sons Ltd.
Conflict of interest statement
The author reported no conflict of interest.
Figures
References
-
- Jansen JP, Fleurence R, Devine B, et al. Interpreting indirect treatment comparisons and network meta‐analysis for health‐care decision making: report of the ISPOR Task Force on Indirect Treatment Comparisons Good Research Practices: part 1. Value Health. 2011;14(4):417‐428. - PubMed
-
- Lumley T. Network meta‐analysis for indirect treatment comparisons. Stat Med. 2002;21(16):2313‐2324. - PubMed
-
- Lunn DJ, Thomas A, Best N, Spiegelhalter D. WinBUGS—a Bayesian modelling framework: concepts, structure, and extensibility. Stat Comput. 2000;10(4):325‐337.
MeSH terms
Grants and funding
LinkOut - more resources
Full Text Sources