

Bronchoalveolar Lavage Fluid from COPD Patients Reveals More Compounds Associated with Disease than Matched Plasma
- PMID: 31349744
- PMCID: PMC6724137
- DOI: 10.3390/metabo9080157
Bronchoalveolar Lavage Fluid from COPD Patients Reveals More Compounds Associated with Disease than Matched Plasma
Abstract
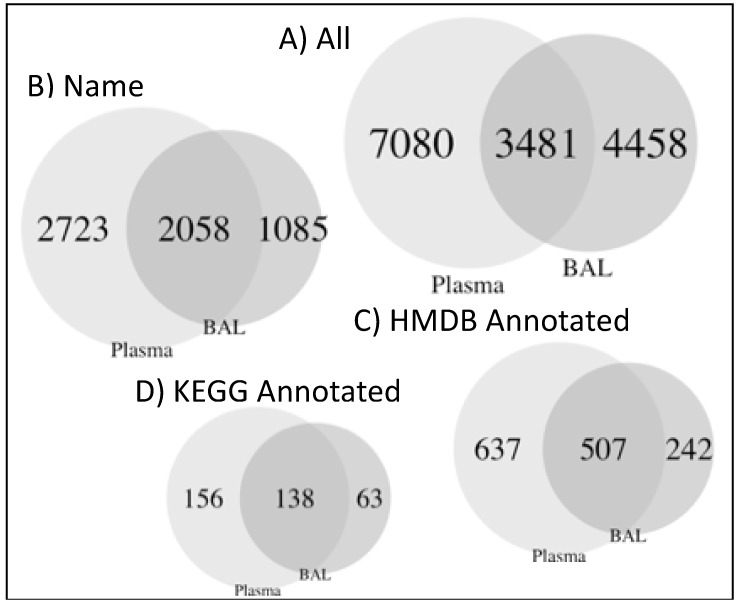
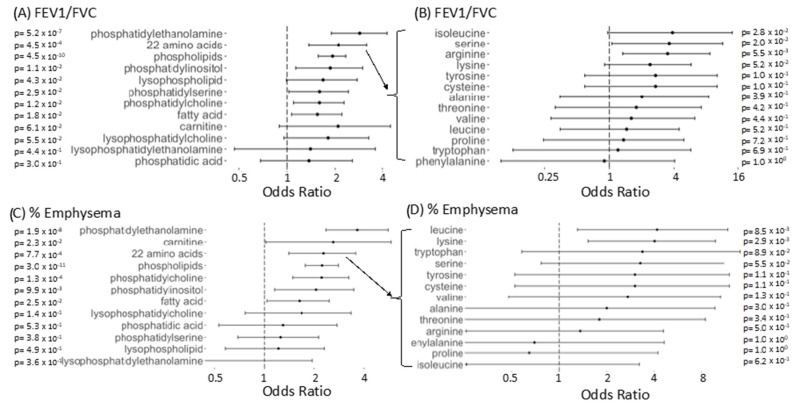
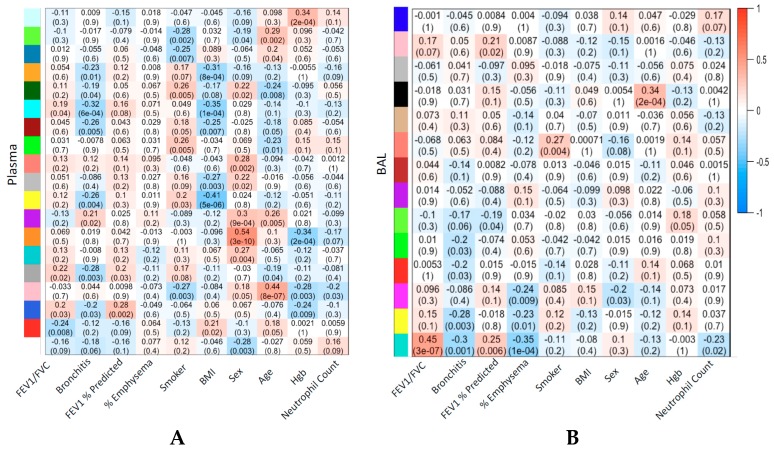
Smoking causes chronic obstructive pulmonary disease (COPD). Though recent studies identified a COPD metabolomic signature in blood, no large studies examine the metabolome in bronchoalveolar lavage (BAL) fluid, a more direct representation of lung cell metabolism. We performed untargeted liquid chromatography-mass spectrometry (LC-MS) on BAL and matched plasma from 115 subjects from the SPIROMICS cohort. Regression was performed with COPD phenotypes as the outcome and metabolites as the predictor, adjusted for clinical covariates and false discovery rate. Weighted gene co-expression network analysis (WGCNA) grouped metabolites into modules which were then associated with phenotypes. K-means clustering grouped similar subjects. We detected 7939 and 10,561 compounds in BAL and paired plasma samples, respectively. FEV1/FVC (Forced Expiratory Volume in One Second/Forced Vital Capacity) ratio, emphysema, FEV1 % predicted, and COPD exacerbations associated with 1230, 792, eight, and one BAL compounds, respectively. Only two plasma compounds associated with a COPD phenotype (emphysema). Three BAL co-expression modules associated with FEV1/FVC and emphysema. K-means BAL metabolomic signature clustering identified two groups, one with more airway obstruction (34% of subjects, median FEV1/FVC 0.67), one with less (66% of subjects, median FEV1/FVC 0.77; p < 2 × 10⁻⁴). Associations between metabolites and COPD phenotypes are more robustly represented in BAL compared to plasma.
Keywords: BAL; BALF; COPD; LC–MS; bronchoalveolar lavage; emphysema; mass spectrometry; metabolomics; plasma.
Conflict of interest statement
Stephen Rennard is an employee of AstraZeneca. Other authors have no conflicts of interest to declare. The funders had no role in the design of the study; in the collection, analyses, or interpretation of data; in the writing of the manuscript, or in the decision to publish the results.
Figures
References
-
- Haenen S., Clynen E., Nemery B., Hoet P.H.M., Vanoirbeek J.A.J. Biomarker discovery in asthma and COPD: Application of proteomics techniques in human and mice. EuPA Open Proteom. 2014;4:101–112. doi: 10.1016/j.euprot.2014.04.008. - DOI
Grants and funding
- HHSN268200900019C/HL/NHLBI NIH HHS/United States
- R01 HL137995/HL/NHLBI NIH HHS/United States
- U01 HL089897/HL/NHLBI NIH HHS/United States
- HHSN268200900015C/HL/NHLBI NIH HHS/United States
- HHSN268200900016C/HL/NHLBI NIH HHS/United States
- I01 CX000911/CX/CSRD VA/United States
- HHSN268200900013C/HL/NHLBI NIH HHS/United States
- HHSN268200900014C/HL/NHLBI NIH HHS/United States
- K24 HL137013/HL/NHLBI NIH HHS/United States
- R01 HL125583/HL/NHLBI NIH HHS/United States
- U01 HL089856/HL/NHLBI NIH HHS/United States
- U01 HL137880/HL/NHLBI NIH HHS/United States
- P20 HL113445/HL/NHLBI NIH HHS/United States
- HHSN268200900018C/HL/NHLBI NIH HHS/United States
- HHSN268200900017C/HL/NHLBI NIH HHS/United States
- HHSN268200900020C/HL/NHLBI NIH HHS/United States
LinkOut - more resources
Full Text Sources
Medical
Molecular Biology Databases
