. 2019 Sep;18(18):2307-2322.
doi: 10.1080/15384101.2019.1646068. Epub 2019 Jul 26.

The NEDD8-activating enzyme inhibitor MLN4924 induces DNA damage in Ph+ leukemia and sensitizes for ABL kinase inhibitors

Affiliations

The NEDD8-activating enzyme inhibitor MLN4924 induces DNA damage in Ph+ leukemia and sensitizes for ABL kinase inhibitors

Mahnoush Bahjat et al. Cell Cycle. 2019 Sep.

Abstract

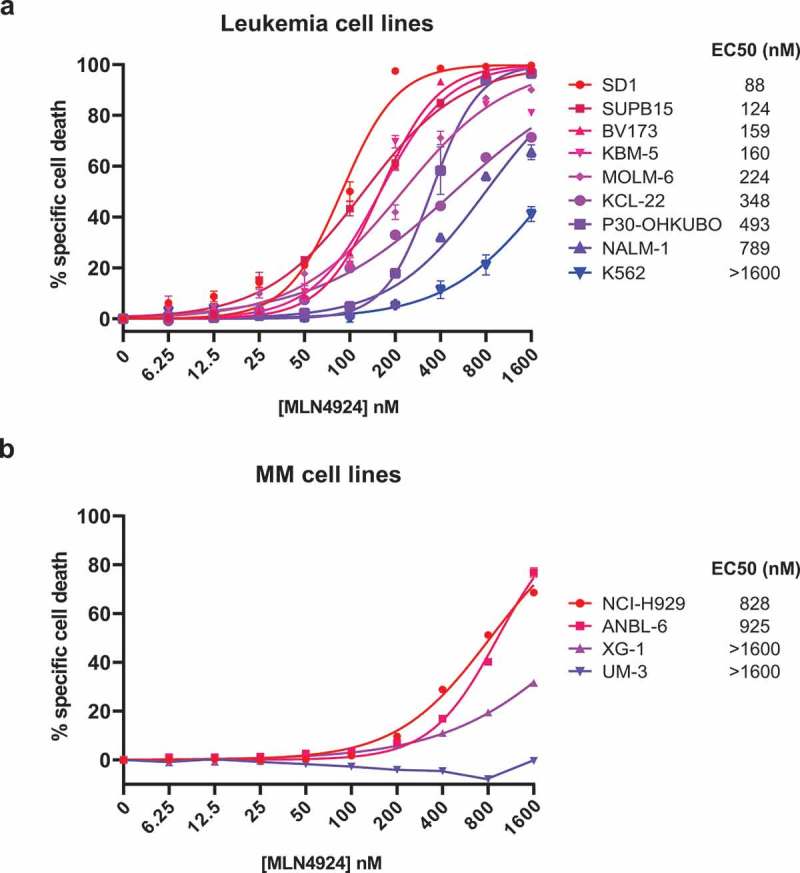
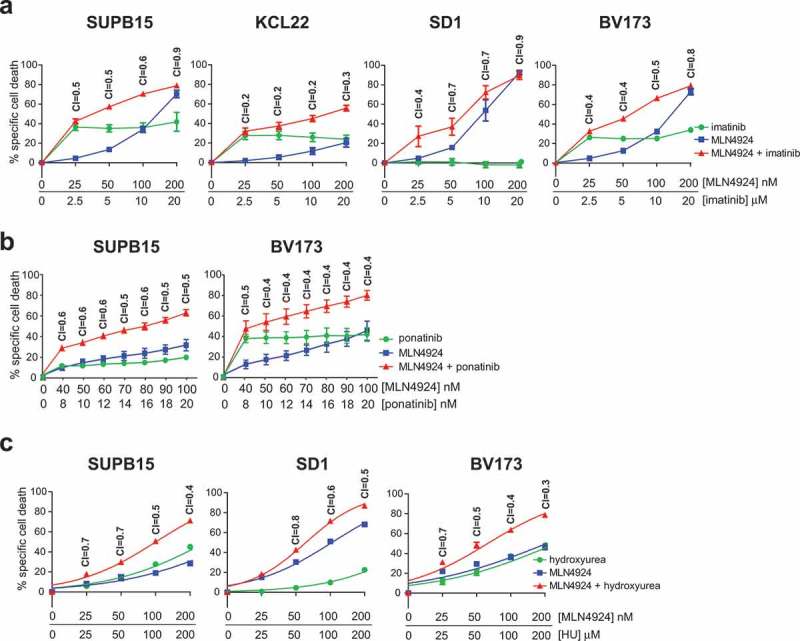
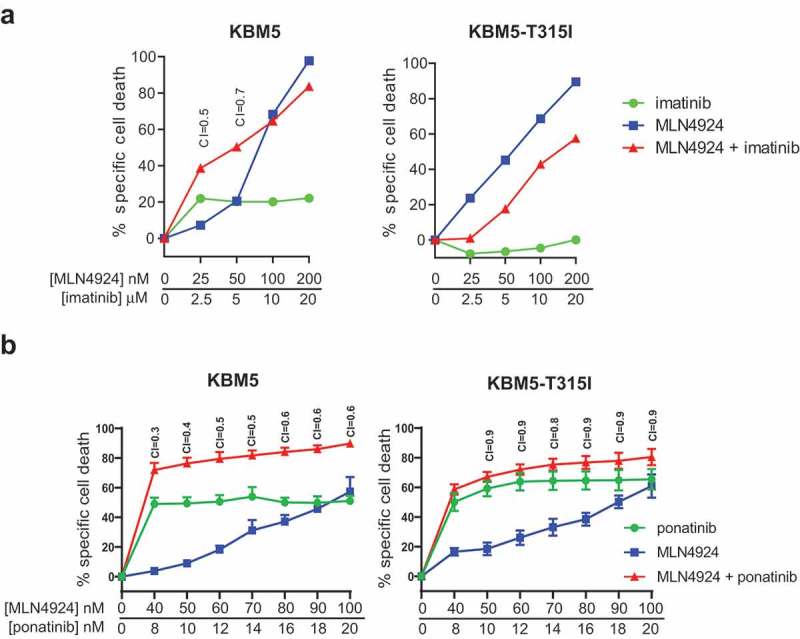
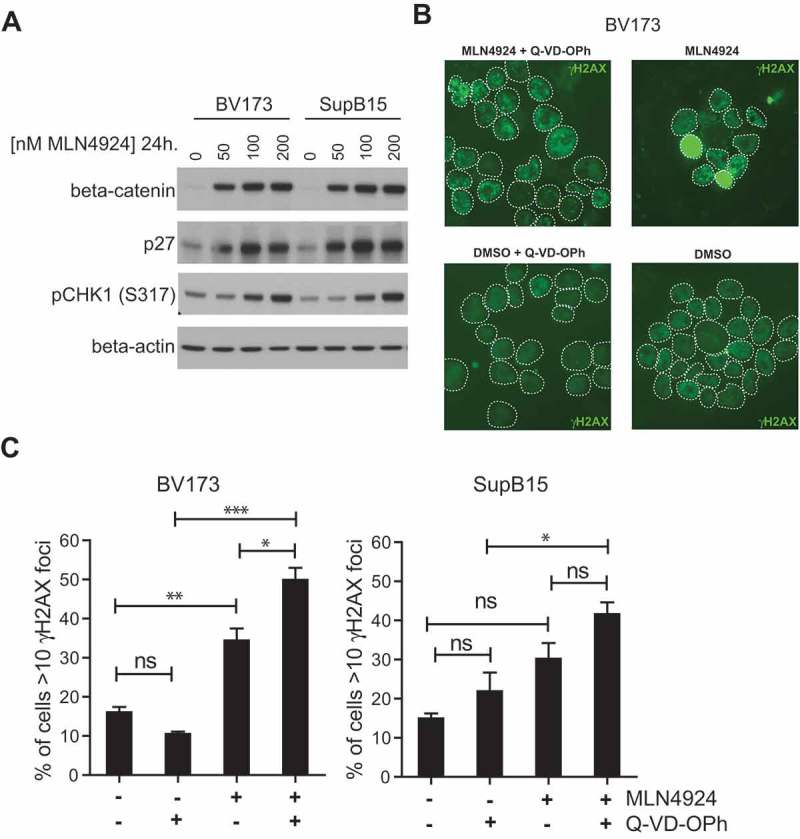
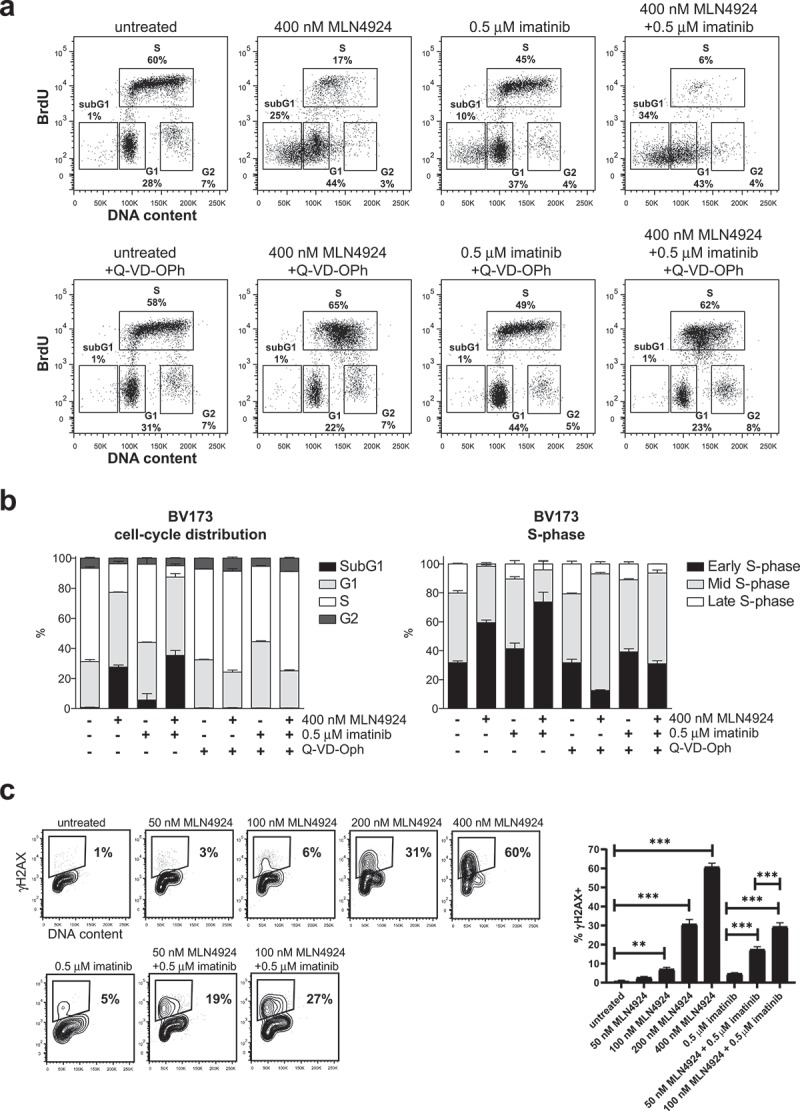
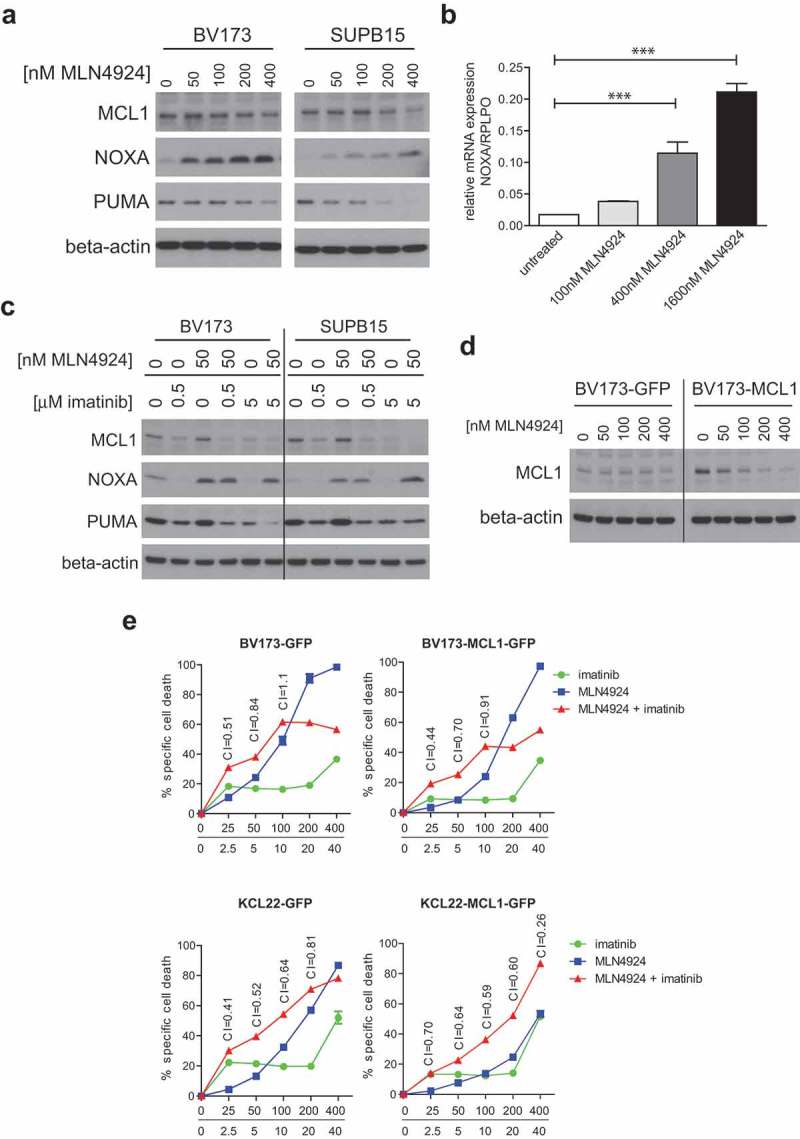
The BCR-ABL1 fusion gene is the driver oncogene in chronic myeloid leukemia (CML) and Philadelphia-chromosome positive (Ph+) acute lymphoblastic leukemia (ALL). The introduction of tyrosine kinase inhibitors (TKIs) targeting the ABL kinase (such as imatinib) has dramatically improved survival of CML and Ph+ ALL patients. However, primary and acquired resistance to TKIs remains a clinical challenge. Ph+ leukemia patients who achieve a complete cytogenetic (CCR) or deep molecular response (MR) (≥4.5log reduction in BCR-ABL1 transcripts) represent long-term survivors. Thus, the fast and early eradication of leukemic cells predicts MR and is the prime clinical goal for these patients. We show here that the first-in-class inhibitor of the Nedd8-activating enzyme (NAE1) MLN4924 effectively induced caspase-dependent apoptosis in Ph+ leukemia cells, and sensitized leukemic cells for ABL tyrosine kinase inhibitors (TKI) and hydroxyurea (HU). We demonstrate that MLN4924 induced DNA damage in Ph+ leukemia cells by provoking the activation of an intra S-phase checkpoint, which was enhanced by imatinib co-treatment. The combination of MLN4924 and imatinib furthermore triggered a dramatic shift in the expression of MCL1 and NOXA. Our data offers a clear rationale to explore the clinical activity of MLN4924 (alone and in combination with ABL TKI) in Ph+ leukemia patients.

Keywords: DNA damage; Neddylation; Ph+ leukemia.


Figures

Figure 1.
Figure 1.
MLN4924 effectively induces cell death in Ph+ leukemia cells. In vitro MLN4924-sensitivity of B-ALL cell lines (a) and MM cell lines (b). Cells were treated for 3 days with the indicated concentrations of MLN4924, cell death was determined by 7-AAD staining and flow-cytometry, and specific cell death was calculated as indicated in the materials and methods section. Three independent experiments were performed and cultures were done in quadruplicate, means ± SEM are shown. EC50 values were calculated by non-linear regression.
Figure 2.
Figure 2.
MLN4924 synergizes with imatinib and HU for the induction of cell death in Ph+ leukemia cells. (a) Ph+ leukemia cell lines were treated for 3 days with various concentrations of MLN4924 and imatinib at a fixed ratio of 1:100. Three independent experiments were performed, cultures were done in quadruplicate, means ± SEM are shown. (b) SUP15 and BV173 cells were treated for 3 days with indicated concentrations of MLN4924 and ponatinib at a fixed ratio of 5:1. Three independent experiments were performed, cultures were done in triplicate, means ± SEM of a representative experiment are shown. (c) Ph+ leukemia cell lines were treated overnight with various concentrations of MLN4924 and HU at a fixed ratio of 1:1000, as indicated. Three independent experiments were performed, cultures were performed in quadruplicate, means ± SEM are shown. Combination index (CI) values are given for each relevant data point.
Figure 3.
Figure 3.
ABL T315I-mutant imatinib resistant Ph+ leukemia cells are sensitive for MLN4924. (a) MLN4924 and imatinib synergize to induce cell death in the Ph+ leukemia cell line KBM5, but not in the imatinib-resistant KBM5 ABL T315I-mutant subline. (b) MLN4924 and ponatinib synergize to induce cell death in both the KBM5 and the KBM5 ABL T315I-mutant subline. Cells were treated for for 3 days with various concentrations of MLN4924 and ponatinib at a fixed ratio of 5:1. Percent specific cell death is shown. Means ± SEM of representative of three independent experiments of triplicate cultures are shown. Combination index (CI) values are given for each relevant data point.
Figure 4.
Figure 4.
MLN4924 stabilizes β-catenin and p27, activates the cell-cycle checkpoint protein CHK1 and induces DNA damage in Ph+ leukemia cells. (a) Immunoblot analysis for β-catenin, p27 and phospho-CHK1 (ser317) levels in BV173 and SUPB15 Ph+ leukemia cells treated for 24 hours with MLN4924 at indicated concentrations. The β-catenin blot was used to control for loading. (b) Immunofluorescent γH2AX staining in BV173 cells treated overnight with DMSO (vehicle) or 400 nM MLN4924, with our without Q-VD-OPh. (c) Bar graphs showing percent of cells with >10 γH2AX foci in BV173 and SUPB15 treated as indicated. For each condition, at least 6 non-overlapping images were captured with a 40x magnification objective and scored manually (on average approximately 120 cells per condition). Means ± SEM are shown. Asterisks indicate statistically significant differences (*p < 0.05; ** p < 0.01, *** p < 0.001, One-way ANOVA).
Figure 5.
Figure 5.
Activation of the intra S-phase cell-cycle checkpoint is responsible for the induction of cell death in MLN4924-treated Ph+ leukemia cells. (a) BrdU-incorporation and cell-cycle analysis of BV173 cells treated overnight with 400 nM MLN4924, 0.5 μM imatinib, or the combination of both (upper panels), and in combination with Q-VD-OPh treatment (lower panels). Percent of cells within the gates are indicated. (b) Bargraph depicting the percent of BV173 cells in the different cell-cycle stages, treated as indicated (left panel), and the percent of cells in early-, mid-, and late-S-phase (determined within S-phase gate), treated as indicated (right panel). Means ± SEM of three independent experiments are shown (c) MLN4924 induces DNA damage in late G1-/early S-phase cells. BV173 cells were overnight exposed to various concentrations of MLN4924 and imatinib as indicated. Intranuclear γH2AX was assessed and plotted against DNA content. Percent γH2AX+ cells are indicated. Bargraph depicts the means ± SEM of percentages of γH2AX+ cells of three independent experiments. Asterisks indicate statistically significant differences (** p < 0.01, *** p < 0.001, One-way ANOVA).
Figure 6.
Figure 6.
MLN4924 and imatinib treatment alters the MLC1/NOXA balance in Ph+ leukemia cells. (a) Immunoblotting analysis of MCL1, NOXA, and PUMA protein expression in BV173 and SUPB15 cells overnight exposed to various concentrations of MLN4924. Beta-actin blotting was used to control for loading. (b) Quantitative RT-PCR analysis of NOXA expression in BV173 cells overnight exposed to various concentrations of MLN4924. The ratio of NOXA/RPLPO (housekeeping gene) expression is depicted. Means ± SEM of three independent experiments are shown, PCRs were performed in triplicate (*** p < 0.001, One-way ANOVA, Dunn’s post-test). (c) Immunoblot analysis of MCL1, NOXA and PUMA protein levels in BV173 and SUPB15 cells treated overnight with MLN4924 and imatinib, at the indicated concentrations. β-catenin- blotting was used to control for loading. (d) Immunoblot analysis of MCL1 protein expression in BV173 cells transduced with empty vector (BV173-GFP) or with retroviral MCL1 overexpression construct (BV173-MCL1). Cells were treated overnight with various concentrations of MLN4924 as indicated. Beta-actin blotting was used to control for loading. (e) MCL1 overexpression diminishes the sensitivity for MLN4924 and imatinib but does not abrogate synergy. BV173-MCL1 and BV173-GFP cells (upper panels) and KCL22-MCL1 and KCL22-GFP (lower panels) were treated for 3 days with various concentrations of MLN4924 and imatinib at a fixed ratio of 1:100, CI values for relevant data point are indicated. Means ± SEM of percent specific cell death are depicted in the graphs.

References

    1. Moorman AV, Harrison CJ, Buck GAN, et al. Karyotype is an independent prognostic factor in adult acute lymphoblastic leukemia (ALL): analysis of cytogenetic data from patients treated on the medical research council (MRC) UKALLXII/Eastern cooperative oncology group (ECOG) 2993 trial. Blood. 2007;109:3189–3197. - PubMed
    1. Mullighan CG. Molecular genetics of B-precursor acute lymphoblastic leukemia. J Clin Invest. 2012;122:3407–3415. - PMC - PubMed
    1. Ben-Neriah Y, Daley GQ, Mes-Masson AM, et al. The chronic myelogenous leukemia-specific P210 protein is the product of the bcr/abl hybrid gene. Science. 1986;233:212–214. - PubMed
    1. Van Etten RA, Jackson P, Baltimore D.. The mouse type IV c-abl gene product is a nuclear protein, and activation of transforming ability is associated with cytoplasmic localization. Cell. 1989;58:669–678. - PubMed
    1. Shuai K, Halpern J, Ten Hoeve J, et al. Constitutive activation of STAT5 by the BCR-ABL oncogene in chronic myelogenous leukemia. Oncogene. 1996;13:247–254. - PubMed

Publication types

MeSH terms