. 2019 Aug 6;117(3):553-562.
doi: 10.1016/j.bpj.2019.06.025. Epub 2019 Jul 2.

Unusual Organization of I-BAR Proteins on Tubular and Vesicular Membranes

Affiliations

Unusual Organization of I-BAR Proteins on Tubular and Vesicular Membranes

Zack Jarin et al. Biophys J. .

Abstract

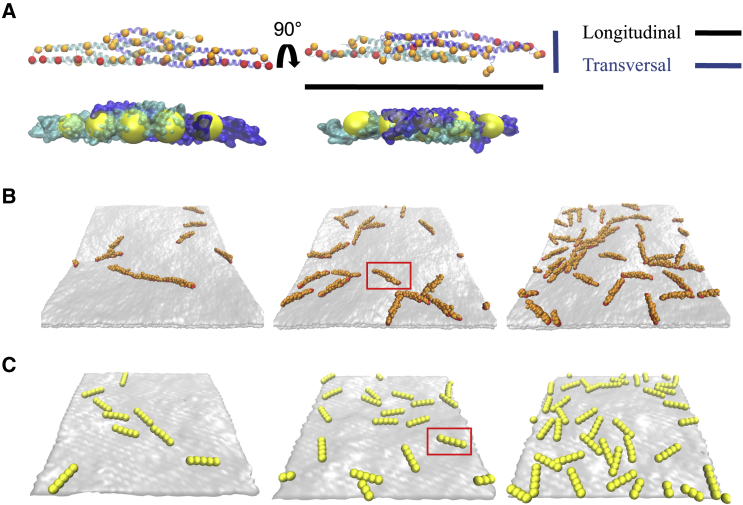
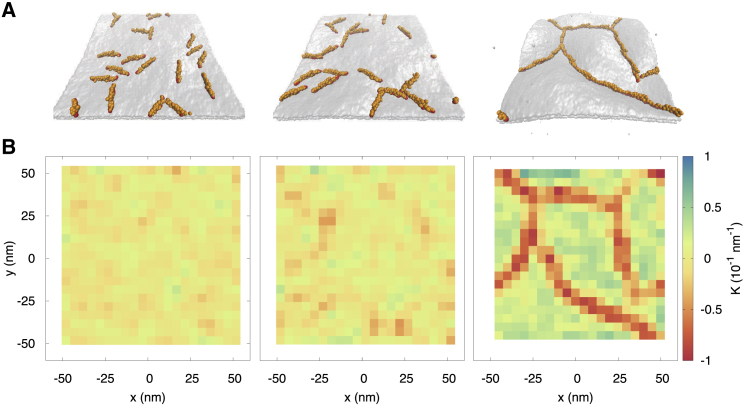
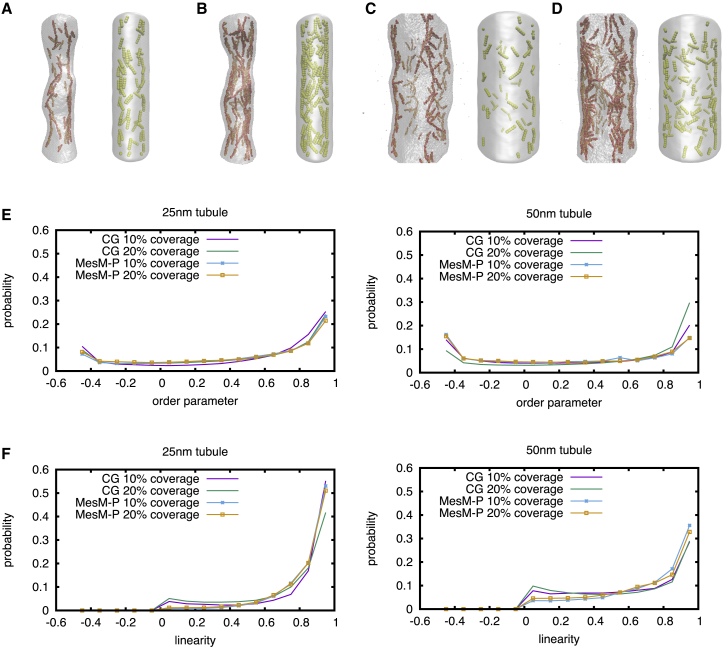
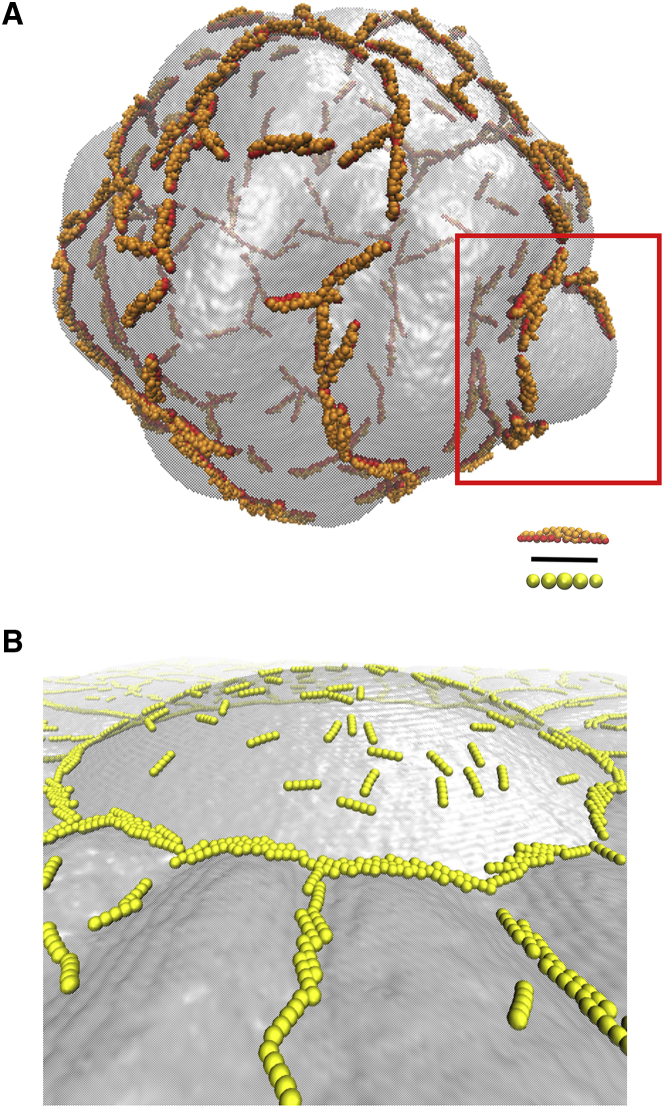
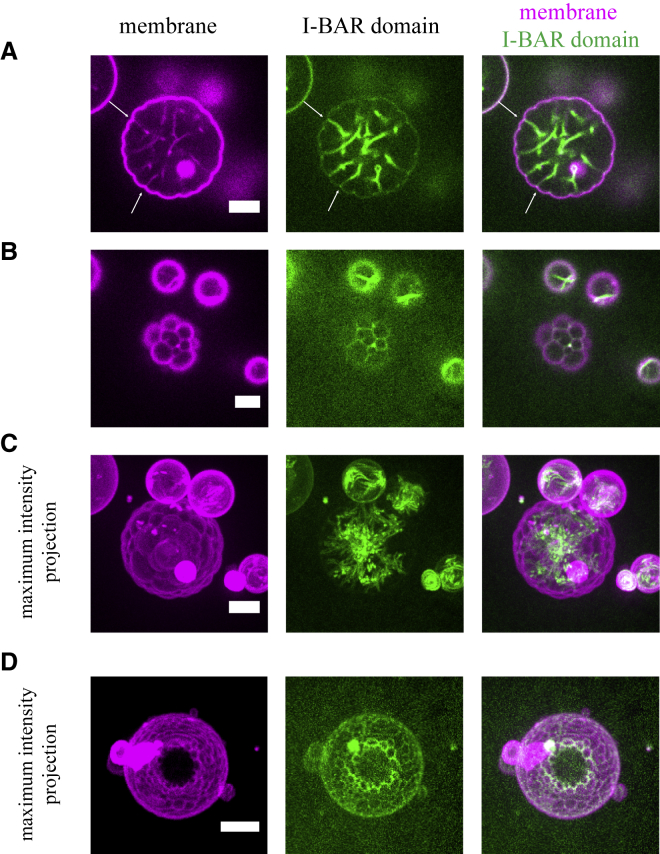
Protein-mediated membrane remodeling is a ubiquitous and critical process for proper cellular function. Inverse Bin/Amphiphysin/Rvs (I-BAR) domains drive local membrane deformation as a precursor to large-scale membrane remodeling. We employ a multiscale approach to provide the molecular mechanism of unusual I-BAR domain-driven membrane remodeling at a low protein surface concentration with near-atomistic detail. We generate a bottom-up coarse-grained model that demonstrates similar membrane-bound I-BAR domain aggregation behavior as our recent Mesoscopic Membrane with Explicit Proteins model. Together, these models bridge several length scales and reveal an aggregation behavior of I-BAR domains. We find that at low surface coverage (i.e., low bound protein density), I-BAR domains form transient, tip-to-tip strings on periodic flat membrane sheets. Inside of lipid bilayer tubules, we find linear aggregates parallel to the axis of the tubule. Finally, we find that I-BAR domains form tip-to-tip aggregates around the edges of membrane domes. These results are supported by in vitro experiments showing low curvature bulges surrounded by I-BAR domains on giant unilamellar vesicles. Overall, our models reveal new I-BAR domain aggregation behavior in membrane tubules and on the surface of vesicles at low surface concentration that add insight into how I-BAR domain proteins may contribute to certain aspects of membrane remodeling in cells.


Figures

Figure 1
Figure 1
Side-by-side image of CG and MesM-P models, snapshots of flat sheet configurations. (A) Shown are the side (left) and top (right) view of an overlay of CG I-BAR domain (orange, red) and the secondary structure of each monomer (cyan and blue) and an overlay of MesM-P I-BAR domain (yellow) and a space filling representation of each monomer. The attractive and excluded volume CG beads colored in red and orange, respectively, are shown, along with the definition of the longitudinal and transversal dimensions of the I-BAR domain. (B) Shown is a snapshot of 5, 10, and 20% coverage of a 100 nm by 100 nm flat sheet with single I-BAR domain highlighted with a red box. (C) Shown are MesM-P snapshots of 5, 10, and 20% coverage of a 100 nm by 100 nm with a single I-BAR domain highlighted with a red box. To see this figure in color, go online.
Figure 2
Figure 2
Effect of I-BAR-lipid interaction strength on local membrane curvature generation at 10% coverage. (A) Shown are snapshots of CG model with increasing interaction strength between attractive I-BAR CG beads and lipid head bead. From left to right: the strengths increase from 0.5, 1.0, to 1.5 kcal/mol. (B) Mean curvature was calculated as a function of the position on the membrane for the snapshots in (A). To see this figure in color, go online.
Figure 3
Figure 3
Tubule snapshots and time series of ordering with the z axis. (A) Shown is 10% and (B) 20% coverage in a periodic ∼25-nm radius tubules and (C) 10% and (D) 20% surface coverage in a ∼50-nm radius tubule (left CG snapshots, right MesM-P snapshots). (E) Shown is a normalized histogram of order parameter for various bound densities and tubule radii. (F) Shown is a normalized histogram of cosine of the angle formed by a single protein and the z axis for various bound densities and tubule radii. To see this figure in color, go online.
Figure 4
Figure 4
Curved membrane snapshots. (A) Shown is CG organization on a 200-nm diameter vesicle at ∼10% coverage. In the red box, liner aggregates of I-BAR domain organized around the base of a membrane bulge are shown. (B) Shown is MesM-P organization around a ∼325-nm diameter dome at ∼10% coverage. Black scale bar represents 15 nm. To see this figure in color, go online.
Figure 5
Figure 5
IRSp53 I-BAR domain induced flower-like GUV membranes. (A and B) Shown are the representative confocal images of a GUV in the presence of IRSp53 I-BAR domain. Confocal images were taken at the equator of the GUV (A) and at the top of the GUV (B). Arrows in (A) indicate some membrane indentations. (C) Maximal intensity projection of the same GUV is shown in (A) and (B). (D) Maximal intensity projection of a flower-like GUV in the presence of IRSp53 I-BAR domain is shown. Protein concentrations are as follows: (AC) 0.02 μM (70% unlabeled and 30% AX488-labeled I-BAR domain) and (D) 0.1 μM AX488-labeled I-BAR domain. Scale bars, 5 μm. To see this figure in color, go online.

References

    1. McMahon H.T., Gallop J.L. Membrane curvature and mechanisms of dynamic cell membrane remodelling. Nature. 2005;438:590–596. - PubMed
    1. Frost A., Unger V.M., De Camilli P. The BAR domain superfamily: membrane-molding macromolecules. Cell. 2009;137:191–196. - PMC - PubMed
    1. Simunovic M., Voth G.A., Bassereau P. When physics takes over: BAR proteins and membrane curvature. Trends Cell Biol. 2015;25:780–792. - PMC - PubMed
    1. Millard T.H., Bompard G., Fütterer K. Structural basis of filopodia formation induced by the IRSp53/MIM homology domain of human IRSp53. EMBO J. 2005;24:240–250. - PMC - PubMed
    1. Mattila P.K., Lappalainen P. Filopodia: molecular architecture and cellular functions. Nat. Rev. Mol. Cell Biol. 2008;9:446–454. - PubMed

Publication types

LinkOut - more resources