. 2019 Aug 20;51(2):324-336.e5.
doi: 10.1016/j.immuni.2019.06.013. Epub 2019 Jul 23.

Protein Amounts of the MYC Transcription Factor Determine Germinal Center B Cell Division Capacity

Affiliations

Protein Amounts of the MYC Transcription Factor Determine Germinal Center B Cell Division Capacity

Shlomo Finkin et al. Immunity. .

Abstract

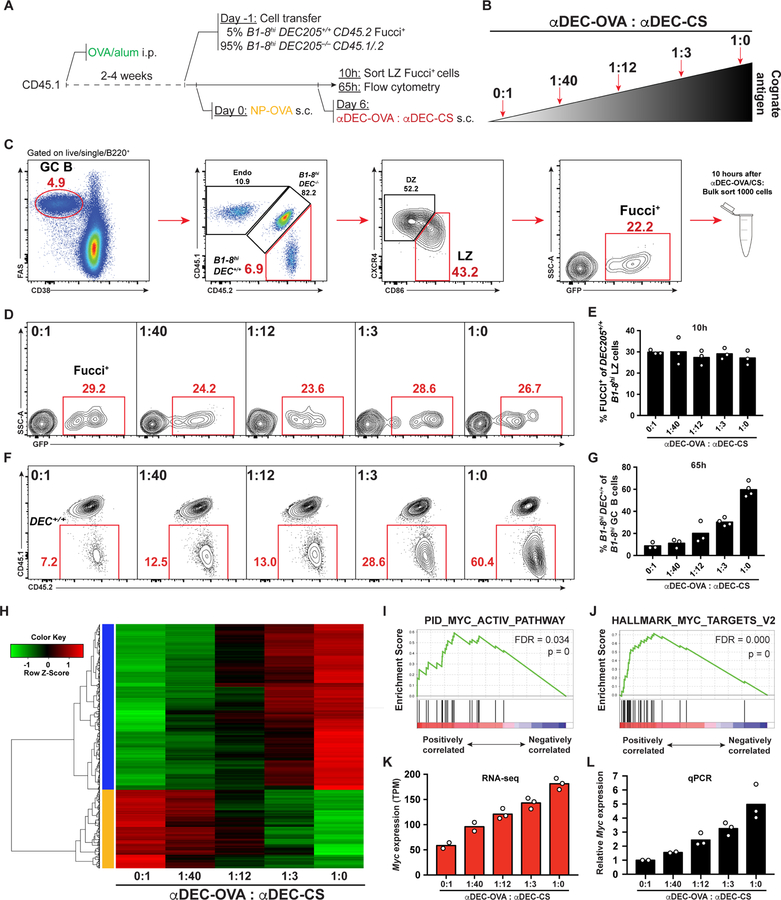
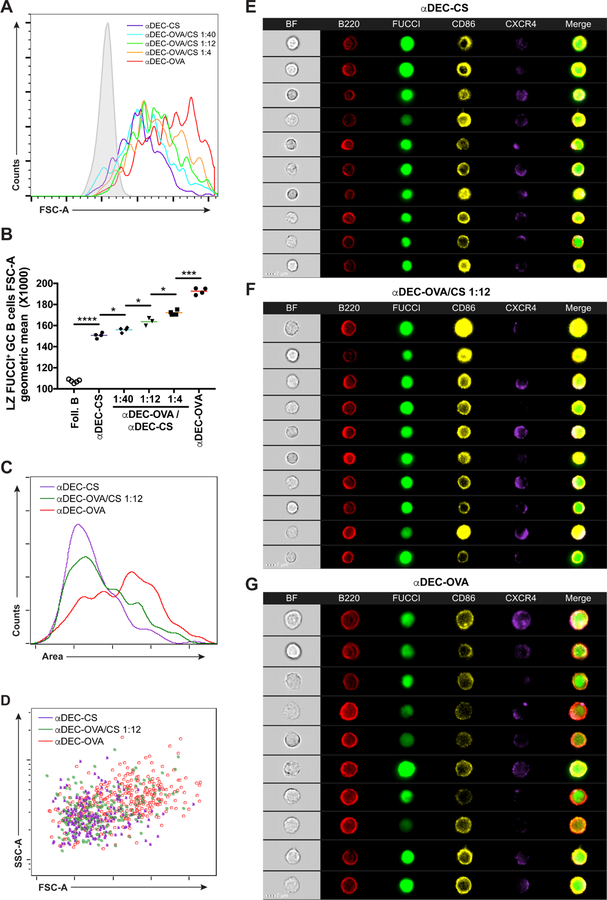
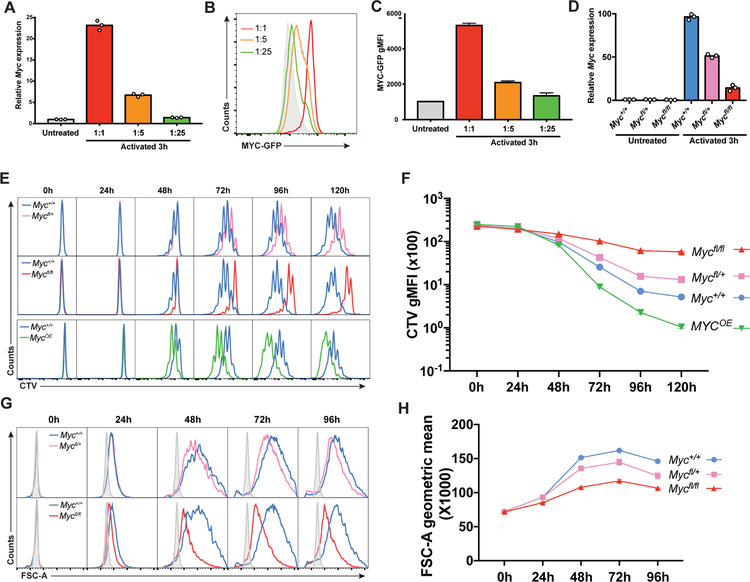
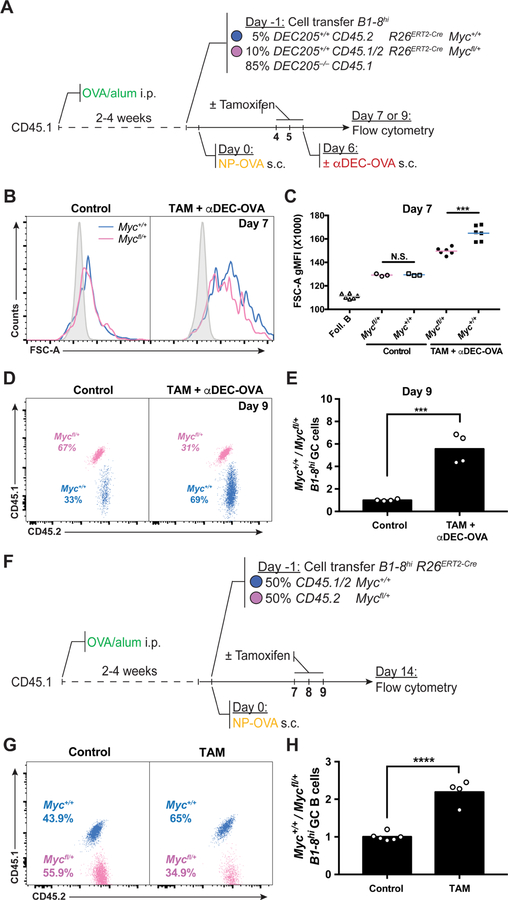
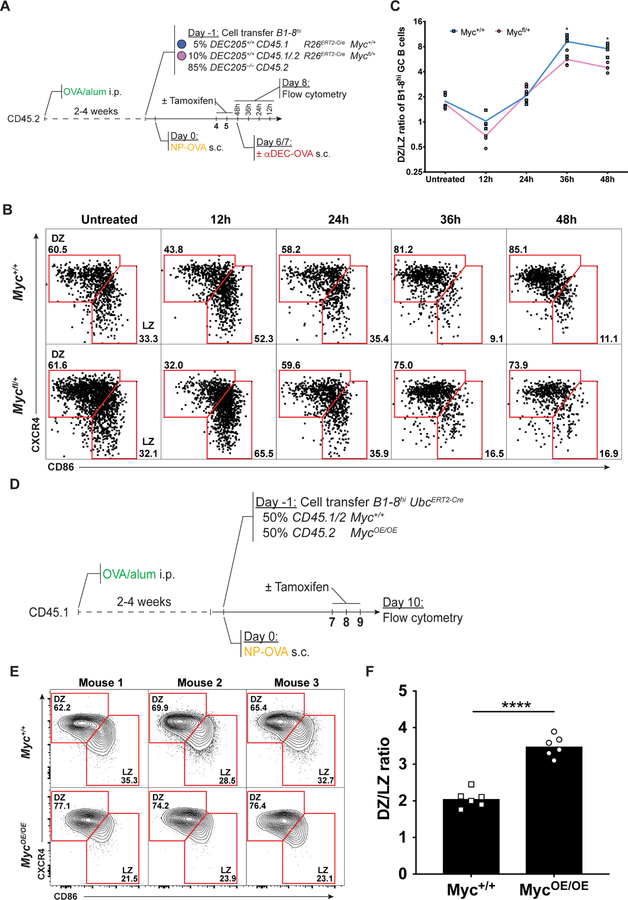
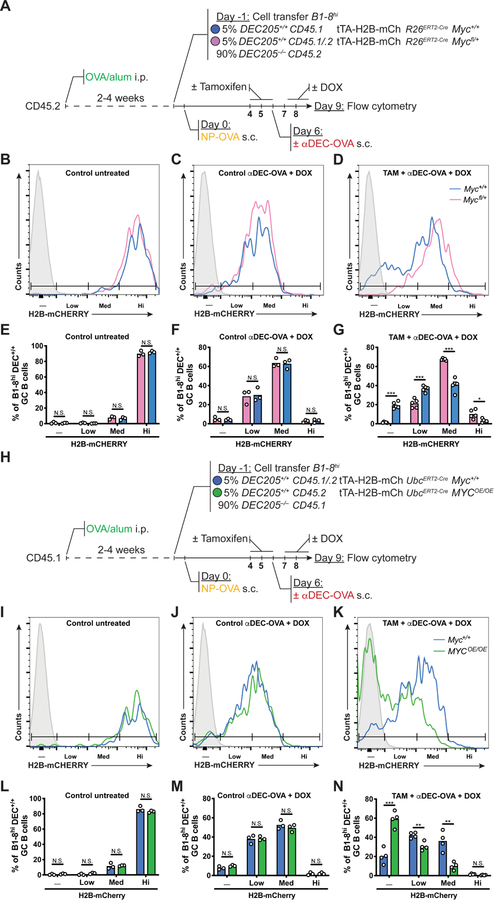
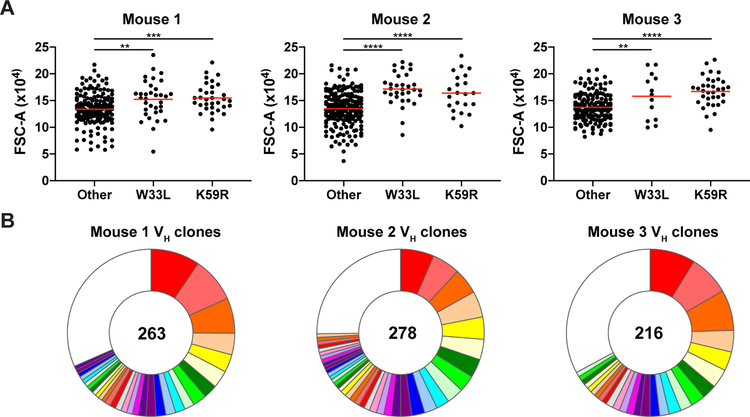
High-affinity B cell selection in the germinal center (GC) is governed by signals delivered by follicular helper T (Tfh) cells to B cells. Selected B cells undergo clonal expansion and affinity maturation in the GC dark zone in direct proportion to the amount of antigen they capture and present to Tfh cells in the light zone. Here, we examined the mechanisms whereby Tfh cells program the number of GC B cell divisions. Gene expression analysis revealed that Tfh cells induce Myc expression in light-zone B cells in direct proportion to antigen capture. Conditional Myc haplo-insufficiency or overexpression combined with cell division tracking showed that MYC expression produces a metabolic reservoir in selected light-zone B cells that is proportional to the number of cell divisions in the dark zone. Thus, MYC constitutes the GC B cell division timer that when deregulated leads to emergence of B cell lymphoma.

Keywords: B cell; MYC; antibody; cell cycle; cell size; germinal center.


Conflict of interest statement

Competing interests

The authors declare no competing interests.

Figures

Figure 1.
Figure 1.. MYC pathway activation in GC B cells is proportional to T cell help.
(A-C) Schematic representation and gating strategy. Endo = Endogenous. (D) Representative GC B cells 10 hours after αDEC-OVA/CS treatment. (E) Quantification of (D) Each symbol represents 12 mice pooled to one group in three independent experiments. (F) Representative flow cytometry results showing percentage of B1–8hiDEC205+/+ among total B1–8hi GC B cells 65 hours after treatment with different amounts of αDEC-OVA (top left). Numbers in red indicate percentage of events in that gate. (G) Quantification of (F). Each symbol represents one mouse. Graph summarizes the results from 3–4 mice per group pooled from 3 independent experiments. (H) Heatmap and hierarchical clustering of proportionally increased or decreased genes expressed by LZ B1–8hiDEC205+/+Fucci+ GC B cells that were used for Gene Set Enrichment Analysis. (I and J) Gene Set Enrichment Plots for MYC pathway activated genes from pathway gene sets (I) and hallmark gene sets (J). FDR = False Discovery Rate. p = p-value. (K) Myc expression determined by RNA sequencing shown as Transcripts Per Million (TPM). (L) Real time PCR quantification of Myc expression performed on RNA from the same samples used for RNA sequencing. Results show the combined data from three independent experiments (see STAR Methods). See also Figure S1.
Figure 2.
Figure 2.. GC B cell size is proportional to MYC expression.
(A) Histogram shows representative forward scatter of LZ Fucci+ GC B cells 30 hours after graded αDEC-OVA administration. Solid grey represents follicular B cells. (B) Quantification of (A). Each symbol represents one mouse. Graph summarizes the results from 3 – 4 mice per treatment in two independent experiments. (C and D) Histogram (C) and dot plot (D) representation of LZ B1–8hiDEC205+/+Fucci+ GC B cells size by ImageStream analysis. Graph summarizes the results from 5 combined mice per treatment in two independent experiments. (E-G) ImageStream galleries showing LZ B1–8hiDEC205+/+Fucci+ GC B cells analyzed 30 hours after αDEC-CS (E), αDEC-OVA/CS 1:12 (F) or αDEC-OVA (G) injection. Scale bar = 7 μm. Two-tailed unpaired student’s t test was used in (B). *p < 0.05. ***p < 0.001 ****p < 0.0001. See also Figure S2.
Figure 3.
Figure 3.. MYC expression is proportional to the magnitude of Tfh signals in vitro.
(A to C) Quantification of Myc mRNA by real time PCR (A) or of MYC-GFP protein by flow cytometry (B and C) after graded activation of wild type B cells with IL-4, IL-21, αCD40 and αCD180 either undiluted or diluted 1:5 or 1:25. Solid grey represents MYC-GFP cells. Graph shows one representative experiment with three technical repeats of two independent experiments. (D) Quantification of Myc mRNA by real time PCR in B cells extracted from spleens of the indicated R26ERT2-Cre mice, cultured in the presence of 4-OHT for 12 hours and activated for 3 hours with IL-4, αCD40 and αCD180. (E) Histograms show CTV dye dilution by spleen B cells cultured for the indicated times with IL-4, IL-21, αCD40 and αIgM and 4-OHT. Blue = Myc+/+, pink = Mycfl/+, red = Mycfl/fl and green = R26StopFLMYC (MYCOE/+). (F) Quantification of (E). (G) Histograms show size for cells treated as in (E). Solid grey represents unactivated B cells. (H) Quantification of (G). Histograms and graphs in (E) to (H) show one representative experiment with three technical repeats of each time point and condition in two independent experiments. Error bars represent SEM. See also Figure S3.
Figure 4.
Figure 4.. MYC proportionally regulates GC B cell expansion.
(A) Schematic representation of the experimental protocol for (B-E). (B) Representative histograms showing forward scatter of B1–8hiR26ERT2-CreDEC205+/+ GC B cells from Myc+/+ (blue) and Mycfl/+ (pink) mice without (left panel) or with (right panel) αDEC-OVA and tamoxifen administration 7 days after NP-OVA boost. Solid grey represents follicular B cells. (C) Quantification of (B). Each symbol represents one mouse. Summary of results from 3–6 mice in three independent experiments. (D) Representative dot plot showing the percentage of adoptively transferred B1–8hiR26ERT2-CreMyc+/+ and B1–8hiR26ERT2-CreMycfl/+ GC B cells in untreated control (left panel) or tamoxifen and αDEC-OVA (right panel) treated mice 9 days after NP-OVA boost. (E) Quantification of (D). Graph shows fold change of B1–8hiR26ERT2-CreMyc+/+ divided by B1–8hiR26ERT2-CreMycfl/+ in individual mice normalized to the average of the same in the control group. Summary of results from 4 – 6 mice in three independent experiments. (F) Schematic representation of the experimental protocol for (G) and (H). (G and H) Representative dot plots showing Percentage (G) and ratio (H, fold change over input) of GC B cells from the indicated mice 7 days after the first tamoxifen treatment. Each symbol represents one mouse. Data represents 3–6 mice in three independent experiments. Unpaired two-tailed student’s t test. N.S.: p > 0.05 (not statistically significant); ***p < 0.001 ****p < 0.0001. See also Figure S4 and Figure S5.
Figure 5.
Figure 5.. MYC expression correlates with DZ residence time.
(A) Schematic representation of the experimental protocol for (B) and (C). (B) Representative Dot plots show DZ/LZ distribution of Myc+/+ (top) and Mycfl/+ (bottom) B1–8hiR26ERT2-CreDEC205+/+ GC B cells in mice treated with tamoxifen at the indicated time points after αDEC-OVA injection. (C) Quantification of (B). Summary of results from 4 mice in two experiments. (D) Schematic representation of the experimental protocol for (E) and (F). (E) Representative contour plots of DZ/LZ distribution of Myc+/+ (top) and MycOE/OE (bottom) B1–8hiUbcERT2-CreDEC205+/+ GC B cells. (F) Quantification of (E). Summary of results from 3–6 mice in two experiments. Unpaired two-tailed student’s t test. *p < 0.05, ****p < 0.0001. See also Figure S6.
Figure 6.
Figure 6.. MYC is both necessary and sufficient for GC B cell division.
(A) Schematic representation of the experimental protocol for (B-G). (B-D) Representative histograms show H2B-mCherry fluorescence among B1–8hiR26ERT2-CreMyc+/+tTA–H2B– mCh (blue) and B1–8hR26ERT2-CreMycfl/+tTA–H2B–mCh (pink) GC B cells in mice treated as indicated. (E-G) Quantification of (B-D). Control mice in (B) and (E) are untreated with TAM, αDEC-OVA and DOX. Summary of results from 3–6 mice in two independent experiments. Mean percentage of H2B-mCherry negative, low, medium or high B1–8hiR26ERT2-CreMyc+/+tTA–H2B–mCh and B1–8hiR26ERT2-CreMycfl/+tTA–H2B–mCh GC B cells. (H) Schematic representation of the experimental protocol for (I-N). (I-K) Representative histograms show H2B-mCherry fluorescence among B1–8hiUbcERT2-CreMyc+/+tTA–H2B–mCh (blue) and B1–8hiUbcERT2-CreR26StopFLMYC tTA–H2B–mCh (MycOE/OE, green) GC B cells in mice treated as indicated. (L-N) Quantification of (I-K). Control mice in (I) and (L) are untreated with TAM, αDEC-OVA and DOX. Summary of results from 3–5 mice in two independent experiments. Mean percentage of H2B-mCherry negative, low, medium or high B1–8hiUbcERT2-CreMyc+/+tTA–H2B–mCh and B1–8hiUbcERT2-CreR26StopFLMYC tTA–H2B–mCh GC B cells. Solid grey represents non-fluorescent cells. DOX = Doxycyclin hyclate. Unpaired two-tailed student’s t test. N.S.: p > 0.05 (not statistically significant); *p < 0.05, **p < 0.01, ***p < 0.001.
Figure 7.
Figure 7.. Correlation between affinity and size of selected LZ B cells in polyclonal GCs.
(A) Forward scatter of individual l+ Fucci+ LZ GC B cells carrying the affinity-enhancing mutations VH186.2 W33L+ or K59R+ or those that do not 10 days after immunization with NP-OVA (see STAR Methods). Red bars indicate mean. Summary of three independent repeats of the experiment, with 1–2 mice each. **p < 0.01, ***p < 0.001, ****p < 0.0001, Unpaired two-tailed student’s t test. (B) Pie charts showing clonal composition of VH sequences for each mouse. Colored slices represent expanded clones, white slice represents singles. Total number of sequences analyzed for each mouse is shown in center. See also Figure S7.

References

    1. Adams JM, Gerondakis S, Webb E, Corcoran LM, and Cory S (1983). Cellular myc oncogene is altered by chromosome translocation to an immunoglobulin locus in murine plasmacytomas and is rearranged similarly in human Burkitt lymphomas. Proc Natl Acad Sci U S A 80, 1982–1986. - PMC - PubMed
    1. Aiba Y, Kometani K, Hamadate M, Moriyama S, Sakaue-Sawano A, Tomura M, Luche H, Fehling HJ, Casellas R, Kanagawa O, et al. (2010). Preferential localization of IgG memory B cells adjacent to contracted germinal centers. Proc Natl Acad Sci U S A 107, 12192–12197. - PMC - PubMed
    1. Allen CD, Ansel KM, Low C, Lesley R, Tamamura H, Fujii N, and Cyster JG (2004). Germinal center dark and light zone organization is mediated by CXCR4 and CXCR5. Nat Immunol 5, 943–952. - PubMed
    1. Allen CD, Okada T, Tang HL, and Cyster JG (2007). Imaging of germinal center selection events during affinity maturation. Science 315, 528–531. - PubMed
    1. Allen D, Simon T, Sablitzky F, Rajewsky K, and Cumano A (1988). Antibody engineering for the analysis of affinity maturation of an anti-hapten response. EMBO J 7, 1995–2001. - PMC - PubMed

Publication types

LinkOut - more resources