. 2019 Jul 26;4(37):eaaw6693.
doi: 10.1126/sciimmunol.aaw6693.

Alveolar macrophages generate a noncanonical NRF2-driven transcriptional response to Mycobacterium tuberculosis in vivo

Affiliations

Alveolar macrophages generate a noncanonical NRF2-driven transcriptional response to Mycobacterium tuberculosis in vivo

Alissa C Rothchild et al. Sci Immunol. .

Abstract

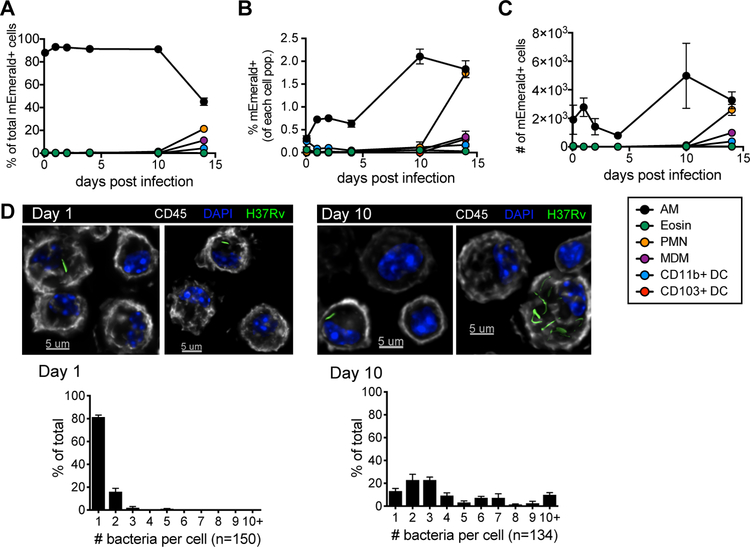
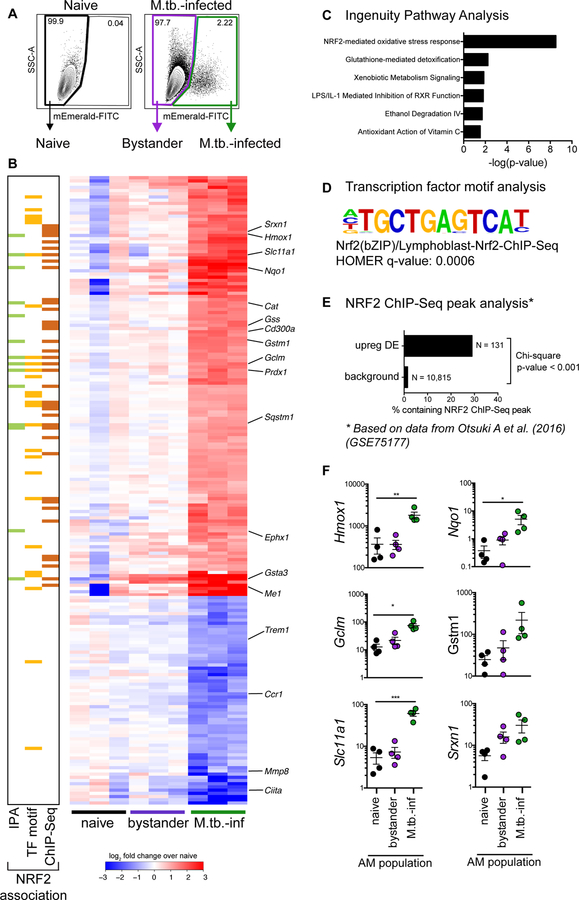
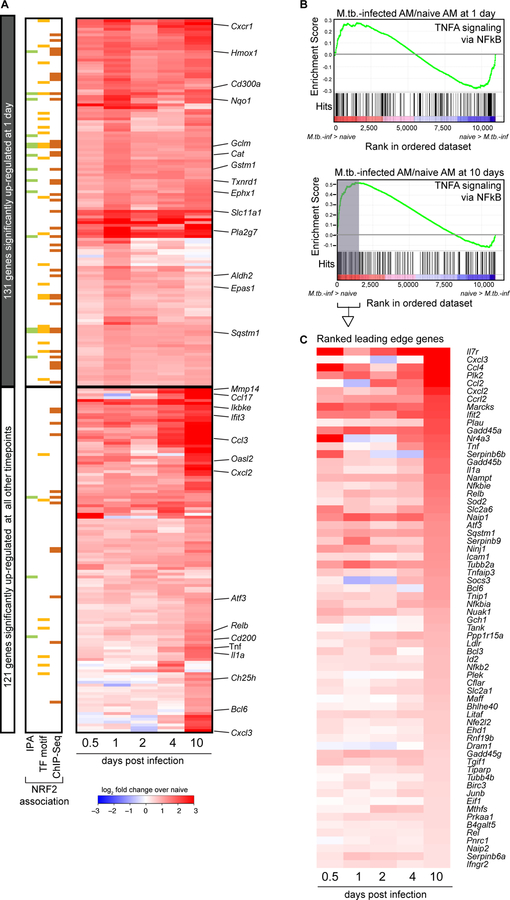
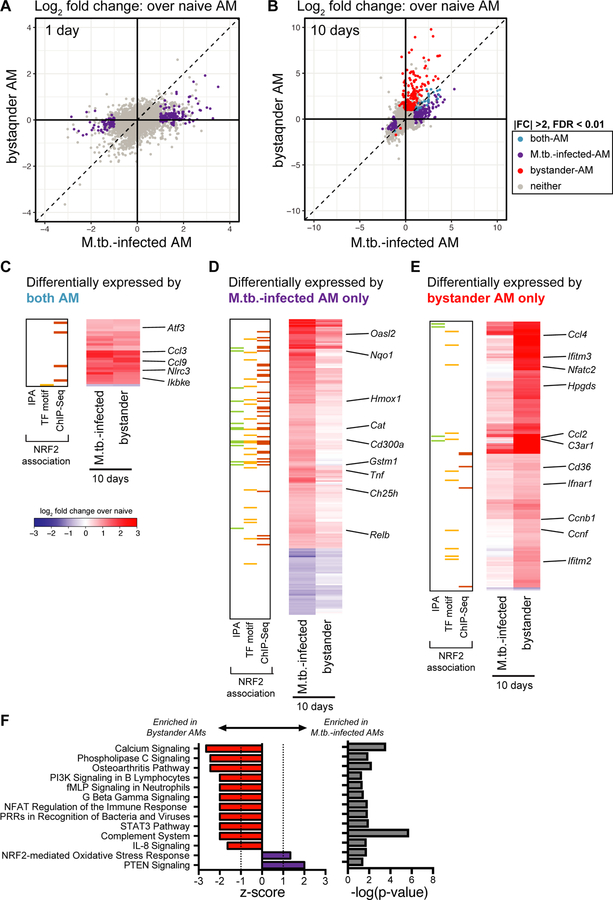
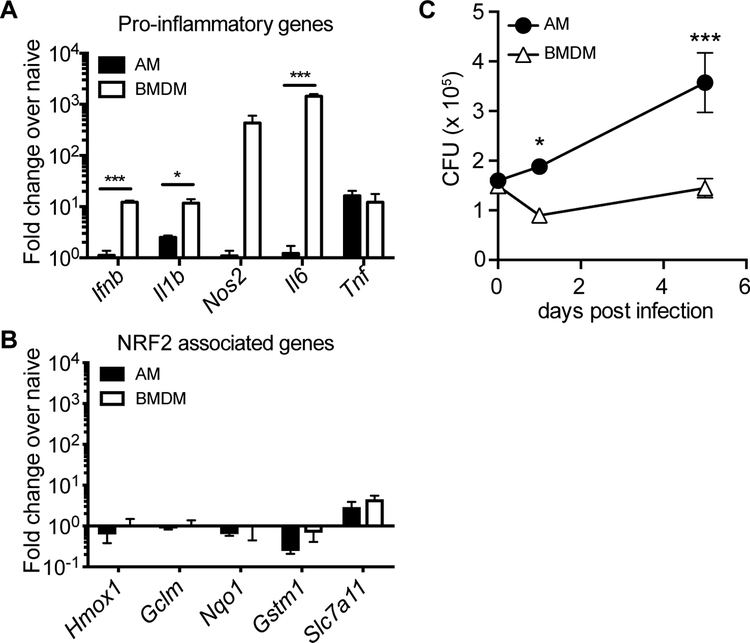
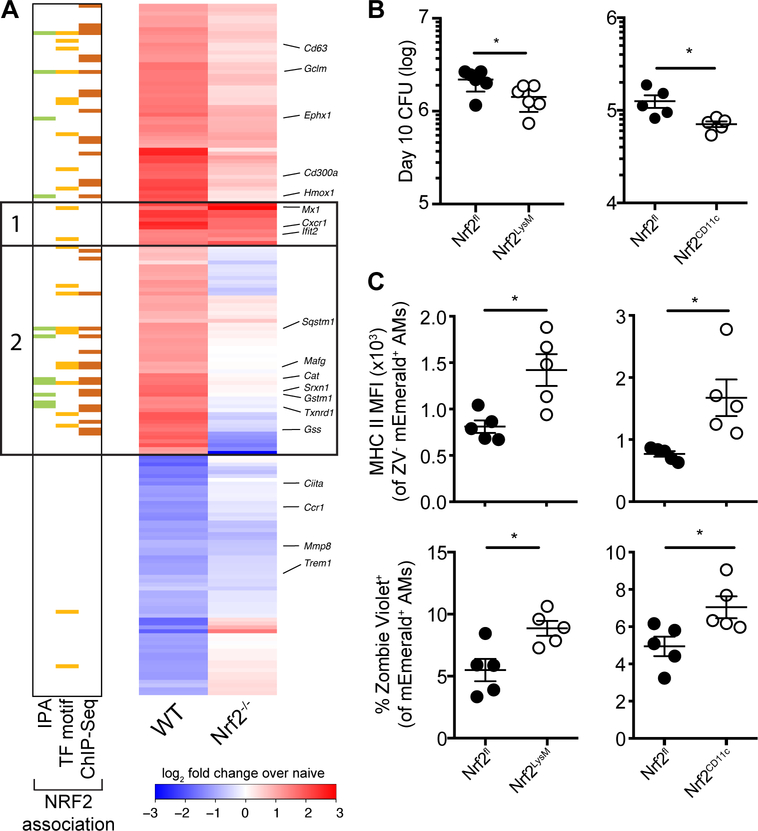
Alveolar macrophages (AMs) are the first cells to be infected during Mycobacterium tuberculosis (M.tb.) infection. Thus, the AM response to infection is the first of many steps leading to initiation of the adaptive immune response required for efficient control of infection. A hallmark of M.tb. infection is the slow initiation of the adaptive response, yet the mechanisms responsible for this are largely unknown. To study the initial AM response to infection, we developed a system to identify, sort, and analyze M.tb.-infected AMs from the lung within the first 10 days of infection. In contrast to what has been previously described using in vitro systems, M.tb.-infected AMs up-regulate a cell-protective antioxidant transcriptional signature that is dependent on the lung environment but not bacterial virulence. Computational approaches including pathway analysis and transcription factor motif enrichment analysis identify NRF2 as a master regulator of the response. Using knockout mouse models, we demonstrate that NRF2 drives expression of the cell-protective signature in AMs and impairs the control of early bacterial growth. AMs up-regulate a substantial pro-inflammatory response to M.tb. infection only 10 days after infection, yet comparisons with bystander AMs from the same infected animals demonstrate that M.tb.-infected AMs generate a less robust inflammatory response than the uninfected cells around them. Our findings demonstrate that the initial macrophage response to M.tb. in the lung is far less inflammatory than has previously been described by in vitro systems and may impede the overall host response to infection.


Conflict of interest statement

Competing interests: The authors declare that they have no competing interests.

Figures

Figure 1:
Figure 1:. Alveolar macrophages provide a replication niche for M.tb. through the first 10 days of infection.
(A) % of total mEmerald+ cells, (B) % mEmerald+ for each cell population, and (C) total number of mEmerald+ cells in the lung between 2 hours and 14 days after high dose aerosol infection with mEmerald-tagged H37Rv (n = 3 mice/time point). (D) Microscopy of BAL samples 1 and 10 days after high dose aerosol infection with mEmerald-tagged H37Rv and quantitation of bacteria per AM (n = 3 replicates/time point, each replicate was pooled from 3 mice). Abbreviations: AM = alveolar macrophages, PMN = neutrophils, Eosin = eosinophils, MDM = myeloid-derived macrophages, DC = dendritic cells. Data are presented as mean ± SEM. Data is representative of 2 independent experiments.
Figure 2:
Figure 2:. M.tb.-infected alveolar macrophages up-regulate an NRF2-associated antioxidant gene signature.
(A) Gating scheme to sort naïve, bystander, and M.tb.-infected AMs from bronchoalveolar lavage (BAL) samples after high dose aerosol infection with mEmerald-tagged H37Rv. (B) Heatmap of gene expression (log2 fold change over average of naïve AMs) for 196 differentially expressed genes between naïve and M.tb.-infected AMs (Filtering criteria: average CPM >1, |fold change| > 2 and FDR < 0.01, Benjamini-Hochberg calculated). Columns are independent experiments (pooled mice) and rows are genes. Genes called out are known NRF2 target genes of interest as well as downregulated pro-inflammatory genes. Colored bars to the left indicate NRF2 association as determined by 3 different methods: (C) Ingenuity Pathway Analysis, (D) transcription factor promoter binding motif enrichment analysis (HOMER), and (E) ChIP-seq peak analysis. (F) RT-qPCR validation of NRF2 associated genes for naïve, bystander and M.tb.-infected AMs 24 hours post-infection. Values are relative to Ef1a. Data is presented from 3 independent experiments with one-way ANOVA with Dunnett’s post-test *p < 0.05, **p < 0.01, ***p < 0.001.
Figure 3:
Figure 3:. Up-regulation of the NRF2-associated signature does not require virulent M.tb. infection.
(A) Heatmap of log2 fold change gene expression over average of naïve AMs for H37Rv-infected, ΔRD1-infected, and bead-positive AMs 24 hours after treatment. Columns represent averages of 3 independent experiments. Rows represent 196 DE genes described in Figure 2. Colored bars to the left indicate NRF2 association as described in Figure 2. (B, C) Scatterplots comparing gene expression values (log2 fold change over average of naïve AMs) for H37Rv-infected versus ΔRD1-infected AMs (B) or H37Rv-infected versus bead-positive AMs (C) 24 hours post-infection with significant differentially expressed genes highlighted (average CPM >1, |fold change| > 2 and FDR < 0.01, Benjamini-Hochberg calculated). Data is presented from 3 independent experiments.
Figure 4:
Figure 4:. M.tb.-infected alveolar macrophages induce both NRF2-associated and pro-inflammatory responses 10 days after infection.
(A) Heatmap of gene expression (log2 fold change over naïve AMs) for 252 genes up-regulated in M.tb.-infected AMs compared to naïve AMs for at least one out of five time points (Filtering criteria: average CPM >1, |fold change| > 2 and FDR < 0.01, Benjamini-Hochberg calculated). Top 131 genes are significantly up-regulated in M.tb.-infected AMs at 1 day post-infection. Bottom 121 genes are not significantly up-regulated in M.tb.-infected AMs at 1 day post-infection. Colored bars indicate NRF2 association as described in Figure 2. (B, C) Gene set enrichment analysis and top 50 ranked leading edge genes in the “TNFA signaling via NFkB” pathway for M.tb.-infected AMs at 10 days post-infection. Data is presented from 3 independent experiments per time point.
Figure 5:
Figure 5:. Bystander AMs express a unique transcriptional signature 10 days after infection.
(A, B) Scatterplots comparing gene expression values (log2 fold change over average of naïve AMs) for H37Rv-infected versus bystander AMs at 1 day (A) and 10 days (B) post-infection with significant differentially expressed genes highlighted (|fold change| > 2 and FDR < 0.01, Benjamini-Hochberg calculated). Data is presented from 3 independent experiments. (C, D, E) Heatmaps of log2 fold change gene expression at 10 days over average of naïve AMs. Colored bars indicate NRF2 association as described in Figure 2. (C) 28 genes differentially expressed by both bystander and M.tb.-infected AMs. (D) 200 genes differentially expressed only by M.tb.-infected AMs. (E) 177 genes differentially expressed only by bystander AMs. Columns represent the average of three independent experiments. Genes of interest noted to the right. (F) Ingenuity Pathway Analysis comparing gene expression from bystander AMs and M.tb.-infected AMs. Canonical pathways with |z-scores| >1 and p-values < 0.05 were reported.
Figure 6:
Figure 6:. The alveolar macrophage response to M.tb. is driven by both cell type and environment.
In vitro H37Rv infection of AMs and BMDMs. (A) RT-qPCR gene expression analysis of pro-inflammatory genes 8 hours post-infection. (B) RT-qPCR analysis of NRF2-associated genes 8 hours post-infection. (C) Colony forming unit (CFU) assay to measure bacterial burden in each cell type over 5 days. Data is representative of 3 independent experiments with three technical replicates each. Multiple t-tests with Holm-Sidak correction. *p<0.05, ***p < 0.001
Figure 7:
Figure 7:. Modulation of NRF2 activity alters macrophage response and control of M.tb.
(A) Heatmap of gene expression (log2 fold change over average of respective naïve AMs) for WT (first column) and Nrf2−/− (second column) M.tb.-infected AMs, averaged from at least two independent experiments. Rows depict all genes that are differentially expressed between naïve and M.tb. infected WT AMs, as shown in Fig 2B (181 genes expressed out of original 196 gene list). Groups 1 and 2 are defined in the text. Colored bars indicate NRF2 association as described in Figure 2. (B) Lung bacterial burden measured by CFU assay at 10 days post-infection with low dose H37Rv from Nrf2LysM, Nrf2CD11c and their respective Nrf2fl littermate controls. (C) MHC II MFI of Zombie Violet M.tb.-infected AMs (top) and % dead (Zombie Violet+) of M.tb.-infected AMs (bottom) as measured by flow cytometry at 10 days post-infection with high dose mEmerald-H37Rv from Nrf2LysM, Nrf2CD11c and their respective Nrf2fl littermate controls. Data is presented from 2 independent experiments (A) or representative of 2 independent experiments with 5 mice/group (B-C). Two-tailed unpaired Student’s t-test * p< 0.05, ** p < 0.01.

References

    1. Reid MJA, Arinaminpathy N, Bloom A, Bloom BR, Boehme C, Chaisson R, Chin DP, Churchyard G, Cox H, Ditiu L, Dybul M, Farrar J, Fauci AS, Fekadu E, Fujiwara PI, Hallett TB, Hanson CL, Harrington M, Herbert N, Hopewell PC, Ikeda C, Jamison DT, Khan AJ, Koek I, Krishnan N, Motsoaledi A, Pai M, Raviglione MC, Sharman A, Small PM, Swaminathan S, Temesgen Z, Vassall A, Venkatesan N, van Weezenbeek K, Yamey G, Agins BD, Alexandru S, Andrews JR, Beyeler N, Bivol S, Brigden G, Cattamanchi A, Cazabon D, Crudu V, Daftary A, Dewan P, Doepel LK, Eisinger RW, Fan V, Fewer S, Furin J, Goldhaber-Fiebert JD, Gomez GB, Graham SM, Gupta D, Kamene M, Khaparde S, Mailu EW, Masini EO, McHugh L, Mitchell E, Moon S, Osberg M, Pande T, Prince L, Rade K, Rao R, Remme M, Seddon JA, Selwyn C, Shete P, Sachdeva KS, Stallworthy G, Vesga JF, Vilc V, Goosby EP, Building a tuberculosis-free world: The Lancet Commission on tuberculosis. Lancet 393, 1331–1384 (2019). - PubMed
    1. Cohen SB, Gern BH, Delahaye JL, Adams KN, Plumlee CR, Winkler JK, Sherman DR, Gerner MY, Urdahl KB, Alveolar Macrophages Provide an Early Mycobacterium tuberculosis Niche and Initiate Dissemination. Cell Host Microbe 24, 439–446 e434 (2018). - PMC - PubMed
    1. Urdahl KB, Understanding and overcoming the barriers to T cell-mediated immunity against tuberculosis. Semin Immunol 26, 578–587 (2014). - PMC - PubMed
    1. Wolf AJ, Desvignes L, Linas B, Banaiee N, Tamura T, Takatsu K, Ernst JD, Initiation of the adaptive immune response to Mycobacterium tuberculosis depends on antigen production in the local lymph node, not the lungs. J Exp Med 205, 105–115 (2008). - PMC - PubMed
    1. Wolf AJ, Linas B, Trevejo-Nunez GJ, Kincaid E, Tamura T, Takatsu K, Ernst JD, Mycobacterium tuberculosis infects dendritic cells with high frequency and impairs their function in vivo. J Immunol 179, 2509–2519 (2007). - PubMed

Publication types

Substances