. 2019 Jul 26;12(7):dmm038083.
doi: 10.1242/dmm.038083.

Modelling the MYC-driven normal-to-tumour switch in breast cancer

Affiliations

Modelling the MYC-driven normal-to-tumour switch in breast cancer

Corey Lourenco et al. Dis Model Mech. .

Abstract

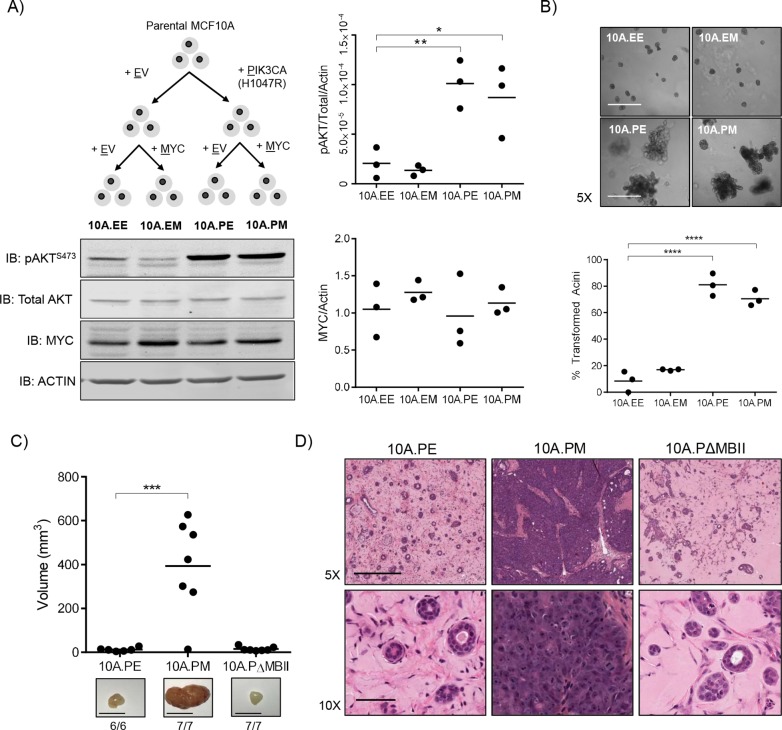
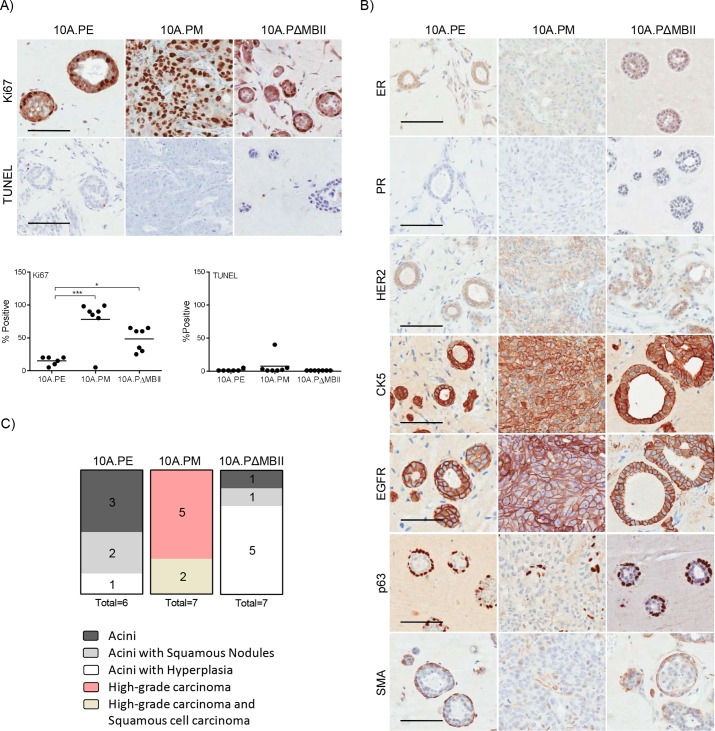
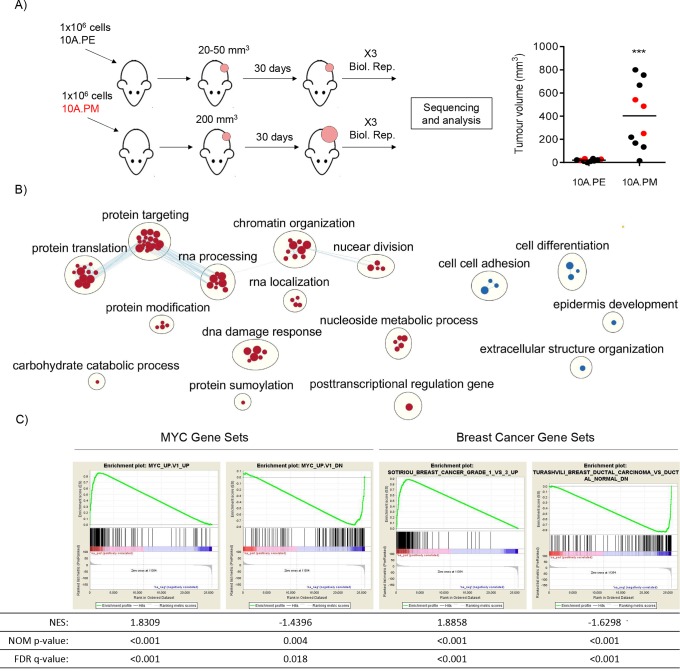
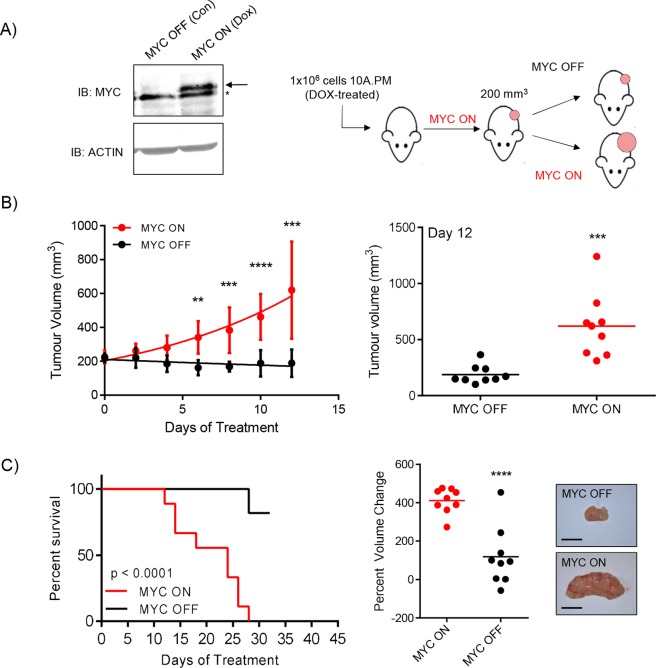
The potent MYC oncoprotein is deregulated in many human cancers, including breast carcinoma, and is associated with aggressive disease. To understand the mechanisms and vulnerabilities of MYC-driven breast cancer, we have generated an in vivo model that mimics human disease in response to MYC deregulation. MCF10A cells ectopically expressing a common breast cancer mutation in the phosphoinositide 3 kinase pathway (PIK3CAH1047R) led to the development of organised acinar structures in mice. Expressing both PIK3CAH1047R and deregulated MYC led to the development of invasive ductal carcinoma. Therefore, the deregulation of MYC expression in this setting creates a MYC-dependent normal-to-tumour switch that can be measured in vivo These MYC-driven tumours exhibit classic hallmarks of human breast cancer at both the pathological and molecular level. Moreover, tumour growth is dependent upon sustained deregulated MYC expression, further demonstrating addiction to this potent oncogene and regulator of gene transcription. We therefore provide a MYC-dependent model of breast cancer, which can be used to assay invivo tumour signalling pathways, proliferation and transformation from normal breast acini to invasive breast carcinoma. We anticipate that this novel MYC-driven transformation model will be a useful research tool to better understand the oncogenic function of MYC and for the identification of therapeutic vulnerabilities.

Keywords: Breast cancer; Cancer model; Driver oncogene; MYC; Microenvironment; PI3K.


Conflict of interest statement

Competing interestsThe authors declare no competing or financial interests.

Figures

Fig. 1.
Fig. 1.
In vivo transformation of MCF10A cells is dependent on active PI3K signalling, deregulated MYC and the conserved MBII region. (A) Schematic overview of the generation of an isogenic panel of MCF10A cell lines. Immunoblotting was performed against pAKTS473, total AKT, MYC and actin and quantified using ImageJ (n=3). One-way ANOVA with Bonferroni post-test for multiple testing. **P≤0.01, *P≤0.05. (B) The MCF10A isogenic panel cultured in Matrigel for 12 days. Images were acquired on day 12 and quantified based on an assessment of acinar circularity and size. Individual mean values from three biological replicates are shown; ****P≤0.0001, one-way ANOVA with Bonferroni post-test for multiple testing. Scale bars: 500 μm. (C) Individual tumour volume measurements from 10A.PE (n=6), 10A.PM (n=7) and 10A.PΔMBII (n=7) xenografts 49 days after injection. Representative images and take rate (mass formed/mouse injected) is indicated below each image. Scale bar: 0.5 cm. ***P≤0.001, one-way ANOVA with Bonferroni post-test for multiple testing. (D) Histology samples from xenografts in (C) stained with H&E. Representative images are shown. Scale bar for 5× images: 50 μm. Scale bar for 10× images: 500 μm.
Fig. 2.
Fig. 2.
Deregulated MYC transforms breast acini into invasive breast carcinoma in vivo. (A) Tumours harvested in Figure 1C were stained (above) for Ki67 and TUNEL and were quantified (below) for the degree of Ki67 and TUNEL staining. Individual quantifications per tumour are shown; *P≤0.05, ***P≤0.001, one-way ANOVA with Bonferroni post-test for multiple testing. Scale bar: 100 μm. (B) Tumours harvested in Figure 1C were stained for ER, PR, HER2, CK5, EGFR, p63 and SMA by the Pathology Research Program Laboratory. (C) A pathology report was produced for each tumour using a combination of H&E, as shown in Figure 1D, and IHC markers used in this study. Scale bar: 100 μm.
Fig. 3.
Fig. 3.
10A.PM tumours have MYC and invasive breast cancer expression signatures. (A) Female NOD-SCID mice were injected with 10A.PE or 10A.PM cells and allowed to form tumours (left). For RNA-seq analysis, 10A.PE growths (n=3) and actively growing10A.PM tumours (n=3) were harvested (right, indicated in red). ***P≤0.001, unpaired, two-tailed t-test. (B) Changes in gene expression, relative to 10A.PE xenografts, were ranked and tested for enrichment in GO Biological Process gene sets. The 10A.PM upregulated or downregulated genes that were significantly enriched in a GO Biological Process gene set are represented as red or blue circles, respectively (all data are provided in Table S2). Edges represent the number of overlapping genes within each gene set and node size represents the number of genes within a single gene set. Finally, clusters of gene sets and annotations were created using clusterMaker2 and AutoAnnotate Cytoscape applications. Data has been filtered (for visualisation) to show highest/lowest enriched GO processes (Reimand et al., 2019). (C) The gene expression data were analyzed by GSEA with MYC and IDC signature data sets. Gene sets used are labelled on the top of each enrichment plot (all data is provided in Table S2). NES, normalised enrichment score (the enrichment score for the gene set after it has been normalised across analysed gene sets). NOM P-value, the statistical significance of the enrichment score. The nominal P-value is not adjusted for gene set size or multiple hypothesis testing and, therefore, is of limited use in comparing gene sets. FDR q-value, false discovery rate (i.e. the estimated probability that the normalised enrichment score represents a false-positive finding).
Fig. 4.
Fig. 4.
Constitutive expression of deregulated MYC is required for tumour growth. (A) With the addition of 1 μg/ml doxycycline (DOX) in vitro, ectopic MYC is expressed (MYC ON). The arrow indicates ectopic MYC; the asterisk indicates endogenous MYC. A total of 1×10⁶ cells were injected into female NOD-SCID mice (n=18) and given DOX-treated water (100 μg/ml) to induce MYC expression. Tumours were allowed to grow until 200 mm3, at which point the animals were randomised into MYC ON (n=9) or MYC OFF (n=9) groups. (B) Individual mean values from all measured tumours (nine per group) during the initial 12 day treatment period are shown (left) and individual tumour volumes from day 12 (final day with all animals present) are also shown (right); **P≤0.01, ***P≤0.001, ****P≤0.0001, unpaired, two-tailed t-test. Error bars represent s.d. (C) Left, tumours were measured until the mice reached a humane end point of 1000 mm3 or until they had received treatment for 1 month. Time to humane end point was plotted as percentage survival; ****P≤0.0001, log-rank test. Middle, percent volume changes for each tumour after the entire course of treatment are reported. ****P≤0.0001, unpaired, two-tailed t-test. Right, representative images are shown. Scale bars: 1 cm.

References

    1. Boxer R. B., Jang J. W., Sintasath L. and Chodosh L. A. (2004). Lack of sustained regression of c-MYC-induced mammary adenocarcinomas following brief or prolonged MYC inactivation. Cancer Cell 6, 577-586. 10.1016/j.ccr.2004.10.013 - DOI - PubMed
    1. Campeau E., Ruhl V. E., Rodier F., Smith C. L., Rahmberg B. L., Fuss J. O., Campisi J., Yaswen P., Cooper P. K. and Kaufman P. D. (2009). A versatile viral system for expression and depletion of proteins in mammalian cells. PLoS ONE 4, e6529 10.1371/journal.pone.0006529 - DOI - PMC - PubMed
    1. Chen Y. and Olopade O. I. (2008). MYC in breast tumor progression. Expert Rev. Anticancer Ther. 8, 1689-1698. 10.1586/14737140.8.10.1689 - DOI - PMC - PubMed
    1. Conway T., Wazny J., Bromage A., Tymms M., Sooraj D., Williams E. D. and Beresford-Smith B. (2012). Xenome—a tool for classifying reads from xenograft samples. Bioinformatics 28, i172-i178. 10.1093/bioinformatics/bts236 - DOI - PMC - PubMed
    1. Debnath J., Muthuswamy S. K. and Brugge J. S. (2003). Morphogenesis and oncogenesis of MCF-10A mammary epithelial acini grown in three-dimensional basement membrane cultures. Methods 30, 256-268. 10.1016/S1046-2023(03)00032-X - DOI - PubMed

Publication types

Grants and funding