. 2019 Aug 13;3(15):2272-2285.
doi: 10.1182/bloodadvances.2019000605.

Differences in Steap3 expression are a mechanism of genetic variation of RBC storage and oxidative damage in mice

Affiliations

Differences in Steap3 expression are a mechanism of genetic variation of RBC storage and oxidative damage in mice

Heather L Howie et al. Blood Adv. .

Abstract

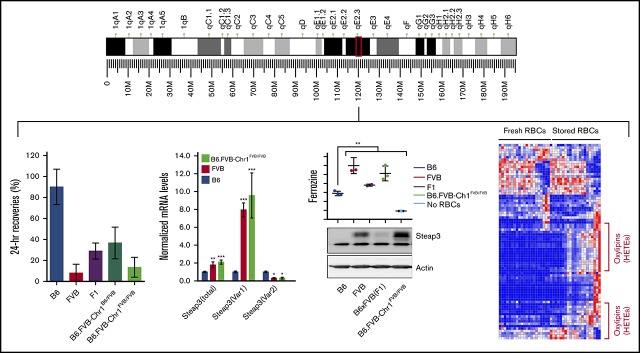
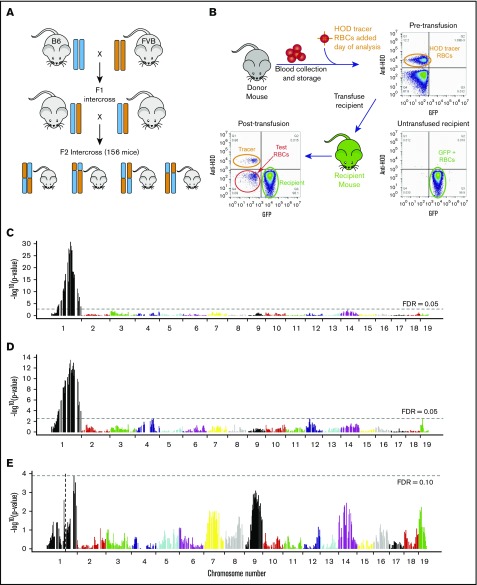
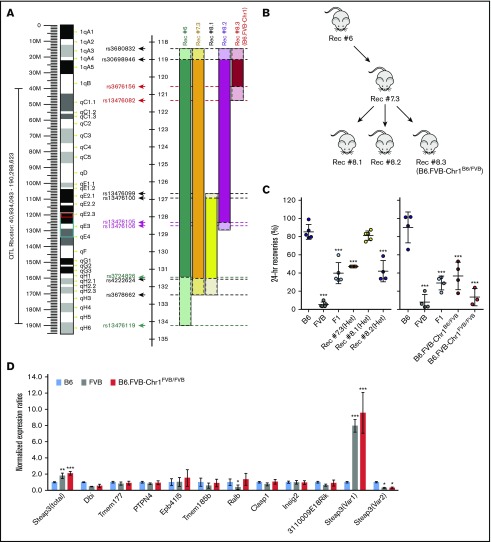
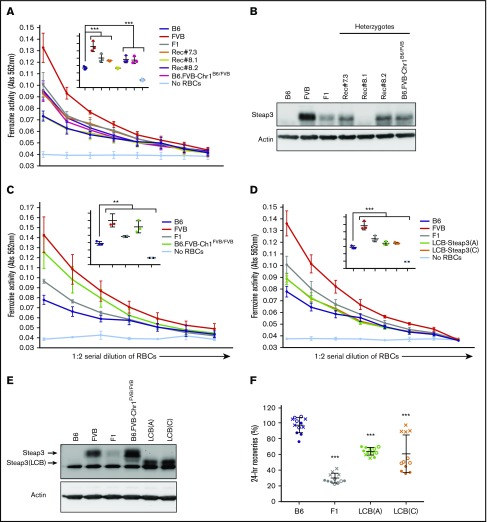
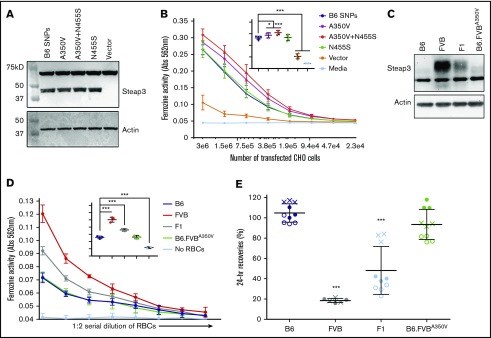
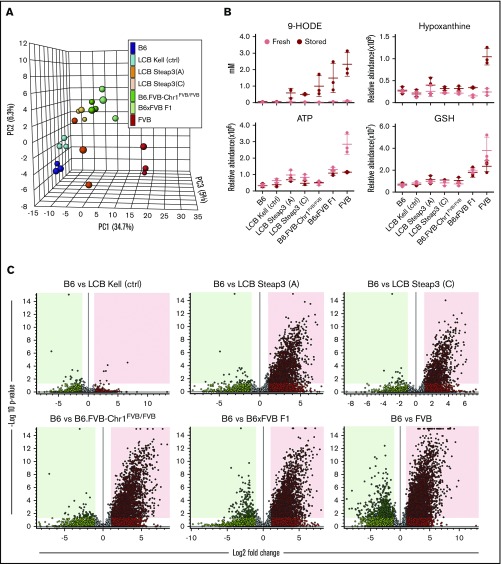
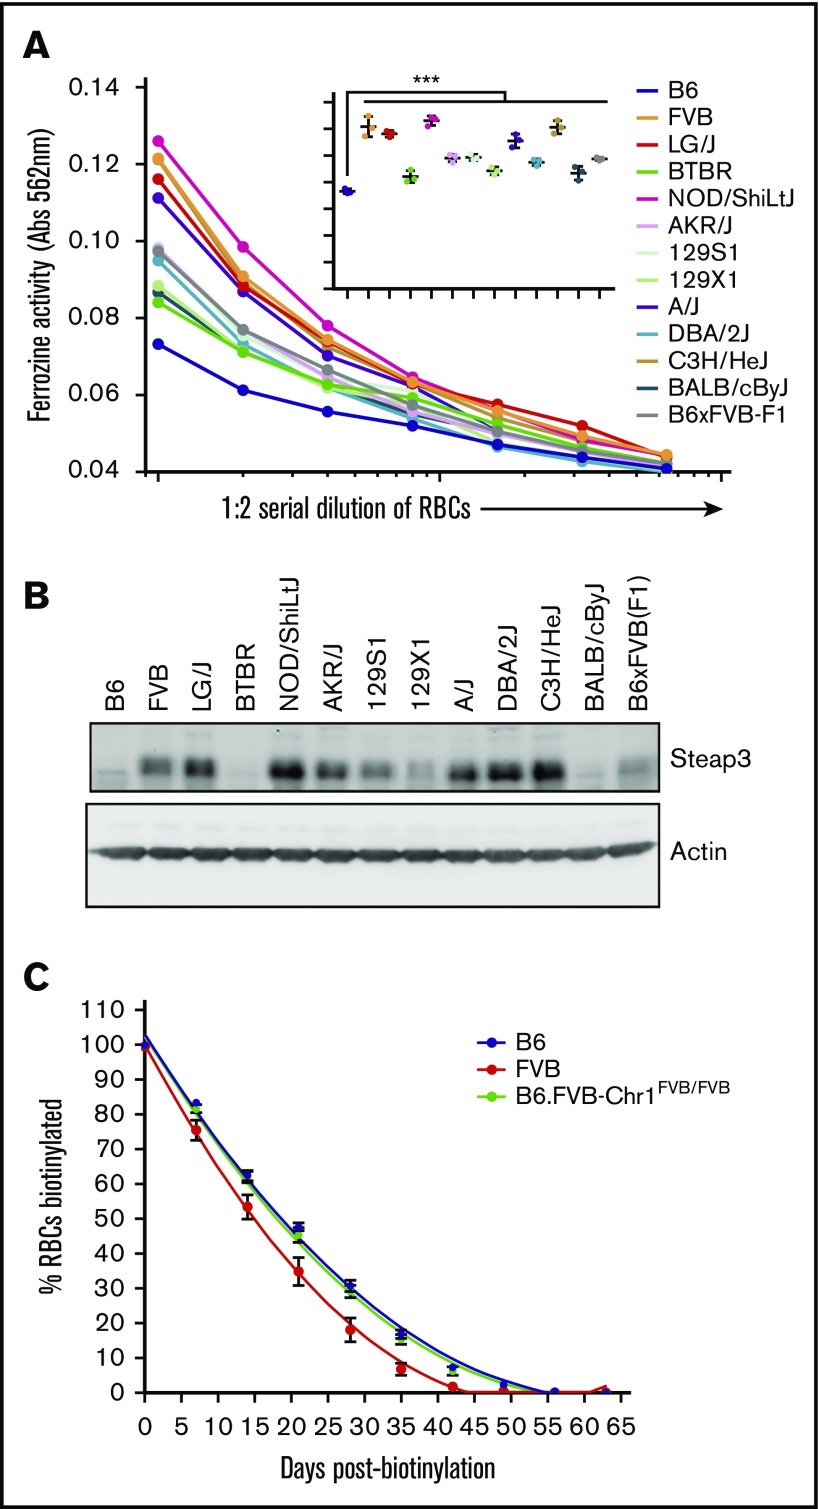
Red blood cells (RBCs) are the most numerous cell type in the body and serve a vital purpose of delivering oxygen to essentially all tissues. In addition to the central role of RBCs in health and disease, RBC storage is a requirement for the >90 million units of RBC transfusions given to millions of recipients each year, worldwide. It is well known that there is genetic donor-to-donor variability in how human RBCs store, rendering blood a nonstandardized therapeutic with a wide range of biological properties from unit to unit, by the time it is transfused. As with humans, genetic variation exists in how murine RBCs, from different strains of mice, store and perform after transfusion. The genetic mechanisms for variation, in humans and mice, both remain obscure. Combining advanced metabolomics, genetics, and molecular and cellular biology approaches, we identify genetic variation in six-transmembrane epithelial antigen of prostate 3 (Steap3) expression as a critical and previously unrecognized mechanism of oxidative damage of RBCs during storage. Increased levels of Steap3 result in degradation of cellular membrane through lipid peroxidation, leading to failure of RBC homeostasis and hemolysis/clearance of RBCs. This article is the first report of a role of Steap3 in mature RBCs; it defines a new mechanism of redox biology in RBCs with a substantial effect upon RBC function and provides a novel mechanistic determinant of genetic variation of RBC storage.


Conflict of interest statement

Conflict-of-interest disclosure: Bloodworks NW has filed a patent on using Steap3 as a predictor of RBC storage. J.C.Z. and K.d.W. are inventors on this application (US20170276665A1). The remaining authors declare no competing financial interests.

Figures

None
Graphical abstract
Figure 1.
Figure 1.
QTL mapping of Rbcstor1 and Rbcstor2. (A) B6 mice were crossed with FVB mice to generate an F1 generation. F1 mice were then interbred to generate an F2 generation. A total of 156 F2 mice were analyzed for their genetic backgrounds (SNP-based genotyping) and tested for RBC storage biology both by determining posttransfusion recoveries (depicted in panel B) and by high-resolution metabolomics (detailed in Table 1). (B) Twenty-four–hour recovery of stored RBCs was determined for each individual F2 mouse as depicted. Donor RBCs were stored for 7 days, spiked with a fresh HOD RBC tracer population, and then transfused into GFP mice with a B6xFVB F1 genetic background. Representative flow cytometry plots are shown. (C) QTL analysis using 24-hour recovery as a quantitative phenotype identified a single region of high significance over a broad range of chromosome 1, termed Rbcstor1. (D) QTL analysis using spontaneous hemolysis in the storage tube as a quantitative phenotype identified a single region of high significance over a broad range of chromosome 1, termed Rbcstor2. (E) QTL using 24-hour recovery as a phenotype on the subset of F2 mice containing the same allelotypes at Rbcstor1 did not identify any other contributing QTL. Likewise, taking a similar approach with spontaneous hemolysis and Rbcstor2, no additional contributing QTL was identified (data not shown). FDR, false discovery rate.
Figure 2.
Figure 2.
Phenotype and genotype-guided backcrossing based mapping and generation of congenic mice. (A) Left: map of murine chromosome 1. The black bracket indicates the boundaries of Rbcstor1, the turquoise box indicates the boundaries of the sixth-generation mouse, and the red box indicates the minimal region containing genetic elements sufficient to confer the poor RBC storage phenotype on a B6 background. Right: pictoral representation of the recombinants obtained in generations 6 to 8 of backcrossing, including the SNPs that define these boundaries (supplemental Table 1). (B) Pedigrees of congenic generations 6 to 8 are shown. (C) Twenty-four–hour recoveries of RBCs stored for 7 days. Left and right panels reflect separate experiments, respectively, each with its own B6, FVB, and F1 controls. These data represent means ± standard deviation (SD) from a representative experiment (n = 3-5 mice per group). These data have been replicated in at least 3 experiments. Statistics calculated using 1-way ANOVA with a Bonferroni post hoc analysis. A significant difference from B6 is indicated by ***P < .0001. (D) Quantitative real-time PCR of each of the gene products contained within the mapped genetic region on chromosome 1. Quantitative real-time PCR was performed on EPs isolated by fluorescence-activated cell sorting from each mouse strain using prevalidated TaqMan assays for each of the 20 genes. Amplification was observed for 10 of the 20 genes. Data shown represent the combined means and SD of expression levels (normalized to expression in B6) from 3 independent experiments. Statistics were calculated by using 2-way ANOVA with a Bonferroni post hoc analysis. A significant difference from B6 is indicated by the following: *P < .05, **P < .005, ***P < .0001.
Figure 3.
Figure 3.
Levels and effects of Steap3 expression on RBCs. (A,C-D). Ferrireductase activity in RBCs as measured by using ferrozine as an indicator of conversion of Fe3+ to Fe2+. Data shown represent combined means from 3 independent experiments (n = 2-4 mice per group, per experiment). Statistics were calculated by using 2-way ANOVA with a Bonferroni post hoc analysis. At the highest concentration of RBCs tested (inset panel in each graph), ferrozine activity of B6 was significantly lower than all other samples (P < .0001) except Rec#8.1 for panel A; ferrozine activity of B6 was significantly lower than all other samples (**P < .005 for F1 and P < .0001 for FVB, B6.FVB-Chr1FVB/FVB) for panel C; and ferrozine activity of B6 was significantly lower than all other samples (P < .0001) for panel D. (B,E) Western blot of RBC ghosts using an anti-Steap3 antibody. After development, membranes were stripped and re-probed with anti-Actin as a control for loading and transfer. (F) Twenty-four–hour recoveries of RBCs stored for 7 days. These data represent combined means and SD from 3 independent experiments (experiment 1 data are shown as a solid circle, experiment 2 data are shown as a hollow circle, and experiment 3 data are shown as an X). Statistics were calculated by using 1-way ANOVA with a Bonferroni post hoc analysis. A significant difference from B6 is indicated by ***P < .0001.
Figure 4.
Figure 4.
Effects of Steap3 nonsynonymous polymorphisms between B6 and FVB strains. Western blot of CHO cell lysates from cells transiently expressing recombinant Steap3 variants (A) or RBC ghosts (C). Blots were probed by using an anti-Steap3 antibody; after development, membranes were stripped and re-probed with anti-actin as a control for loading and transfer. (B) Ferrireductase activity in transfected CHO cells as measured by using ferrozine as an indicator of conversion of Fe3+ to Fe2+. Data shown represent combined means from 5 independent experiments. Statistics were calculated by using 2-way ANOVA with a Bonferroni post hoc analysis. At the highest concentration of CHO cells tested (inset panel), ferrozine activity of the transfected B6 Steap3 variant was significantly lower than A350V (*P < .01) and A350V+N455S (***P < .0001) but not different from N455S by itself. (D) Ferrireductase activity in RBCs as measured by using ferrozine as an indicator of conversion of Fe3+ to Fe2+. Data shown represent combined means from 3 independent experiments (n = 2-4 mice per group, per experiment). Statistics were calculated by using 2-way ANOVA with a Bonferroni post hoc analysis. At the highest concentration of RBCs tested (inset panel), ferrozine activity of B6 was not different from B6.FVB-A350V. (E) Twenty-four–hour recoveries of RBCs stored for 7 days. These data represent combined means and SD from 3 independent experiments (experiment 1 data are shown as a solid circle, experiment 2 data are shown as a hollow circle, and experiment 3 data are shown as an X). Statistics were calculated by using 1-way ANOVA with a Bonferroni post hoc analysis. A significant difference from B6 is indicated by ***P < .0001.
Figure 5.
Figure 5.
Statistical analysis of metabolic clustering and carry forward with congenic and Steap3 transgenic mice. (A) Principle component analysis of 3 separate experiments for each of the indicated mouse strains. (B) Examples of analytes that carry forward (eg, 9-HODE) and those that do not (eg, hypoxanthine, adenosine triphosphate (ATP), and glutathione (GSH). (C) Volcano plots showing the metabolomics of stored RBCs from experimental strains compared with B6, depicting the general extent of clustering of statistically significant analytes that carry forward into congenic and Steap3 transgenic strains.
Figure 6.
Figure 6.
General correlation of Steap3 to RBC storage across strains and in vivo RBC life span. (A) Ferrireductase activity in RBCs as measured by using ferrozine as an indicator of Fe2+. Data shown represent combined means from 3 independent experiments (n = 2-4 mice per group, per experiment). Statistics were calculated by using 2-way ANOVA with a Bonferroni post hoc analysis. At the highest concentration of RBCs tested (inset graph), ferrozine activity of B6 is significantly lower than all other strains tested (***P < .0001). (B) Western blot of RBC ghosts using an anti-Steap3 antibody. After development, membranes were stripped and re-probed with anti-actin as a control for loading and transfer. (C) RBC life span determination by in vivo biotinylation. These data represent means ± SD from a representative experiment (n = 5 mice per group). These data have been replicated in at least 3 experiments.

References

    1. Kanias T, Lanteri MC, Page GP, et al. Ethnicity, sex, and age are determinants of red blood cell storage and stress hemolysis: results of the REDS-III RBC-Omics study. Blood Adv. 2017;1(15):1132-1141. - PMC - PubMed
    1. Dumont LJ, AuBuchon JP. Evaluation of proposed FDA criteria for the evaluation of radiolabeled red cell recovery trials. Transfusion. 2008;48(6):1053-1060. - PubMed
    1. Hod EA, Francis RO, Spitalnik SL. Red blood cell storage lesion-induced adverse effects: more smoke; is there fire? Anesth Analg. 2017;124(6):1752-1754. - PMC - PubMed
    1. van ’t Erve TJ, Doskey CM, Wagner BA, et al. Heritability of glutathione and related metabolites in stored red blood cells. Free Radic Biol Med. 2014;76:107-113. - PMC - PubMed
    1. van ’t Erve TJ, Wagner BA, Martin SM, et al. The heritability of metabolite concentrations in stored human red blood cells. Transfusion. 2014;54(8):2055-2063. - PMC - PubMed

Publication types