Clinical Trial
. 2019 Oct 7;216(10):2253-2264.
doi: 10.1084/jem.20190896. Epub 2019 Jul 26.

Combination of quadruplex qPCR and next-generation sequencing for qualitative and quantitative analysis of the HIV-1 latent reservoir

Affiliations
Clinical Trial

Combination of quadruplex qPCR and next-generation sequencing for qualitative and quantitative analysis of the HIV-1 latent reservoir

Christian Gaebler et al. J Exp Med. .

Abstract

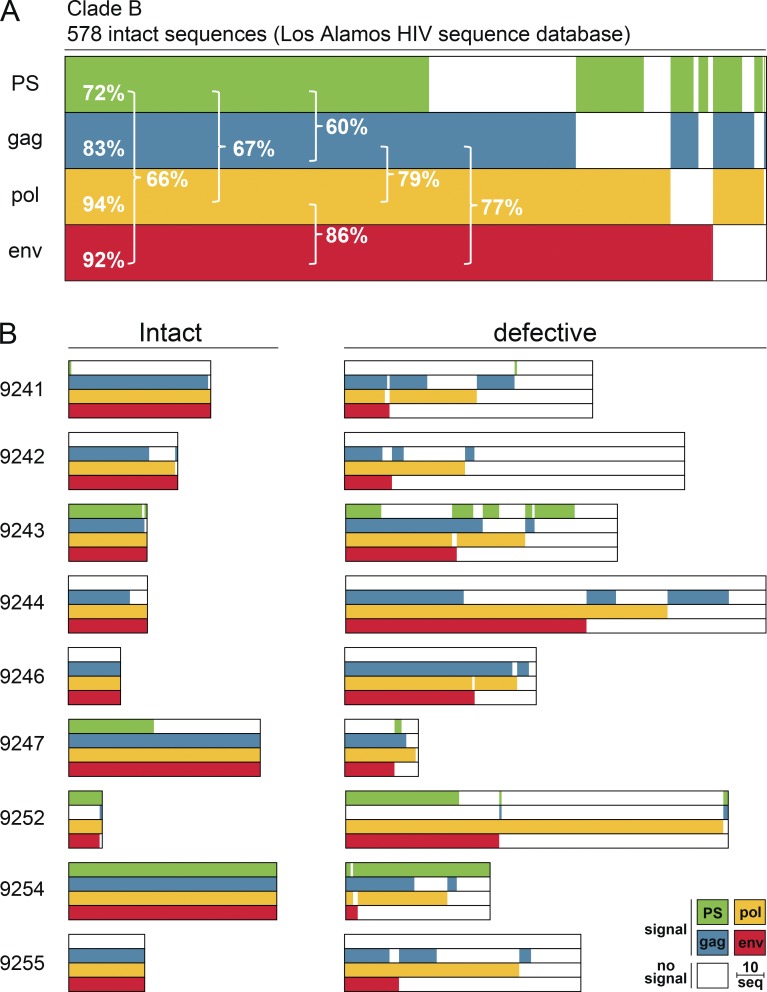
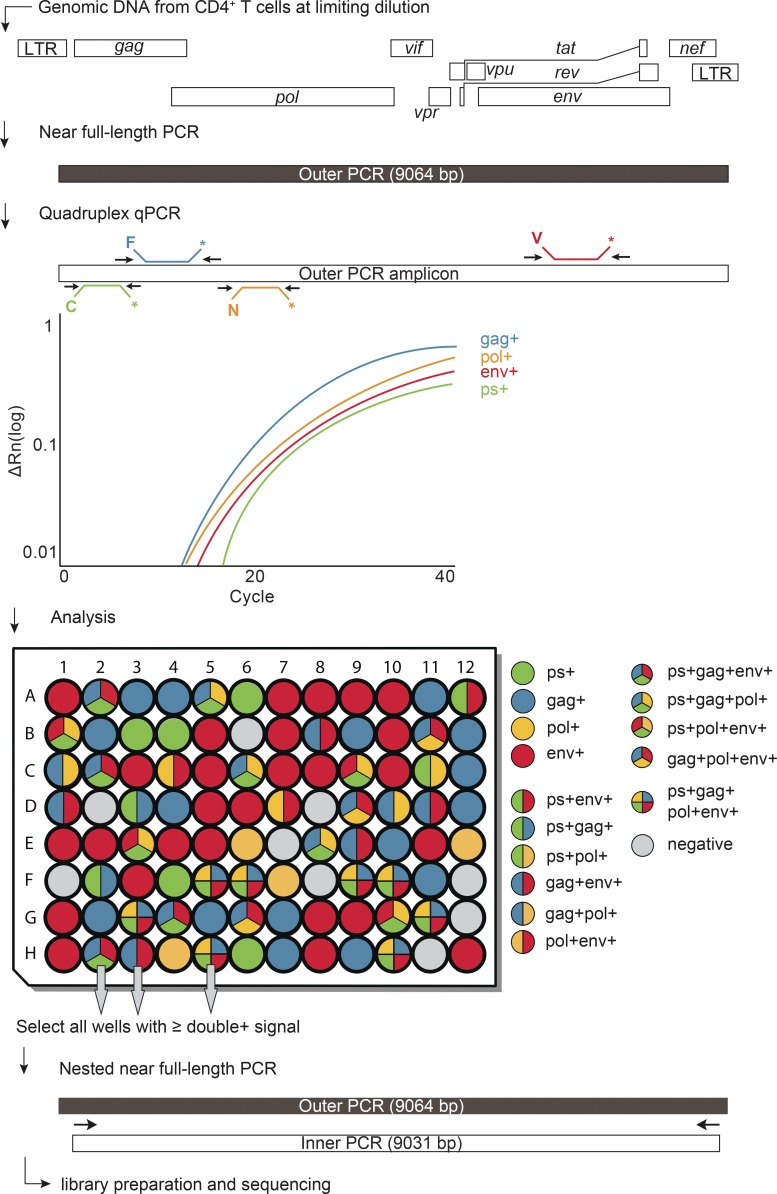
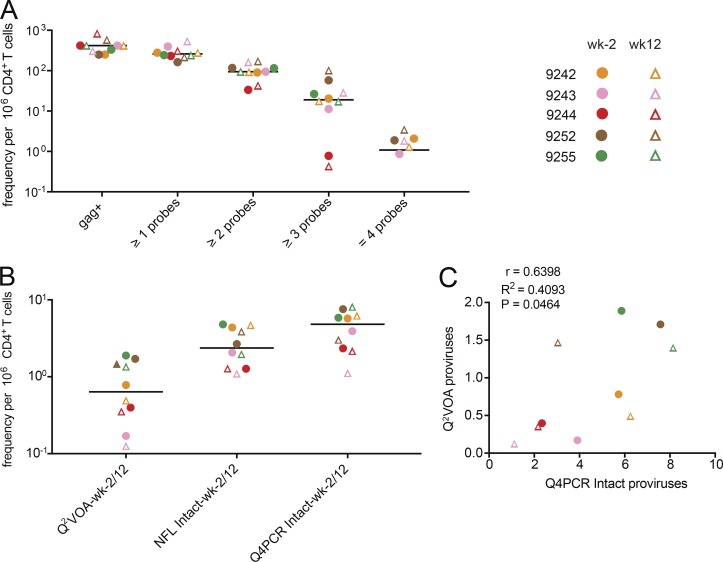
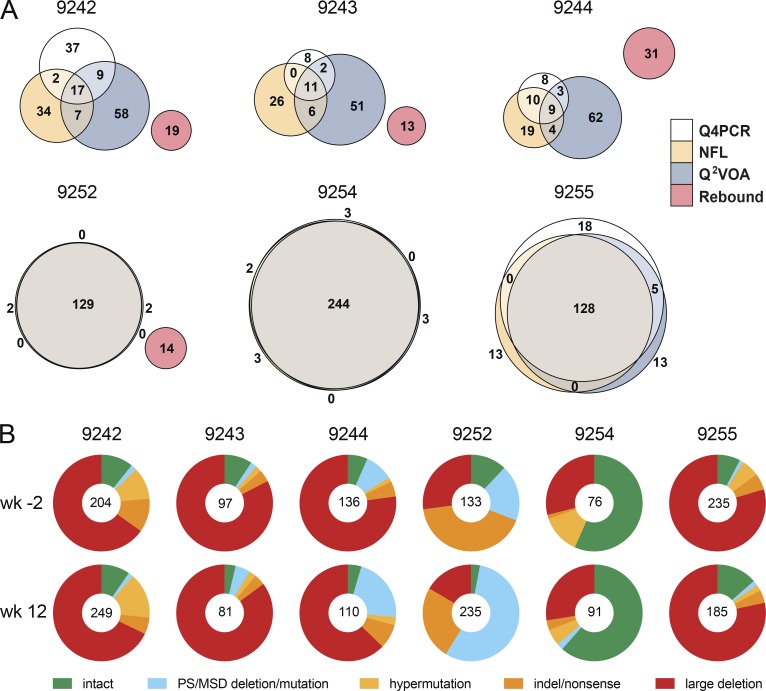
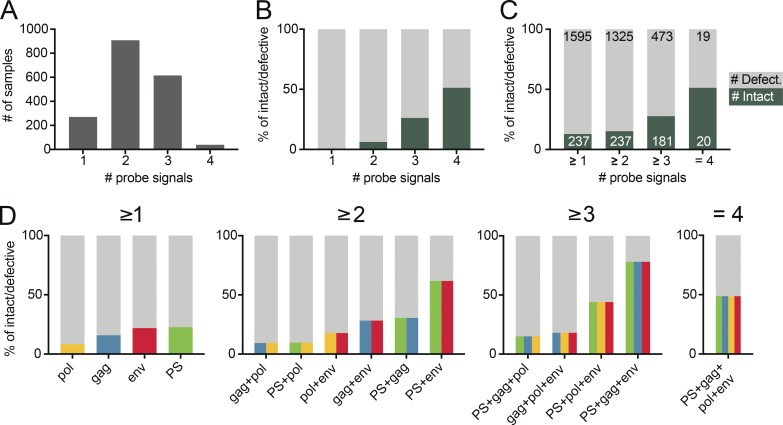
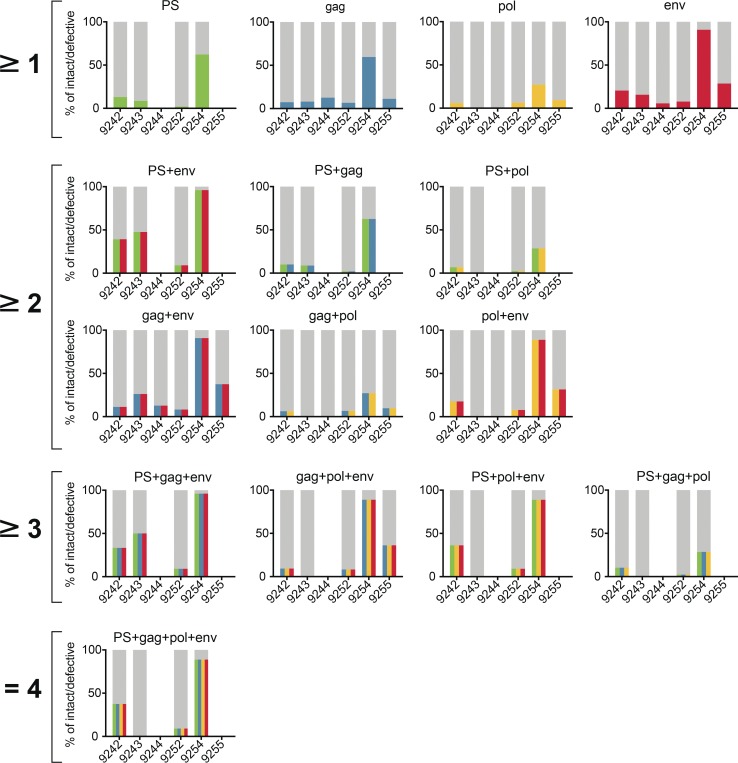
HIV-1 infection requires lifelong therapy with antiretroviral drugs due to the existence of a latent reservoir of transcriptionally inactive integrated proviruses. The goal of HIV-1 cure research is to eliminate or functionally silence this reservoir. To this end, there are numerous ongoing studies to evaluate immunological approaches, including monoclonal antibody therapies. Evaluating the results of these studies requires sensitive and specific measures of the reservoir. Here, we describe a relatively high-throughput combined quantitative PCR (qPCR) and next-generation sequencing method. Four different qPCR probes covering the packaging signal (PS), group-specific antigen (gag), polymerase (pol), and envelope (env) are combined in a single multiplex reaction to detect the HIV-1 genome in limiting dilution samples followed by sequence verification of individual reactions that are positive for combinations of any two of the four probes (Q4PCR). This sensitive and specific approach allows for an unbiased characterization of the HIV-1 latent reservoir.


Figures

Figure 1.
Figure 1.
Predicted detection of HIV-1. (A) Horizontal bars represent the predicted detection of 578 intact clade B proviral sequences (Los Alamos HIV sequence database) by qPCR primer/probe sets that target PS (green), gag (blue), pol (yellow), and env (red) regions. Signal prediction for each individual proviral sequence is represented by the presence of the color of the respective primer/probe set. Sequences containing polymorphisms that prevent signal detection are represented by the absence of color. The percentage indicates the fraction of detected sequences for individual primer/probe sets or combinations of two primer/probe sets (brackets). (B) Horizontal bars represent the predicted detection of 401 intact and 977 defective NFL genomes from nine individuals (Lu et al., 2018; Mendoza et al., 2018). The same primer/probe sets and color scheme are used as described above. The group of defective sequences includes NFL genomes that carry small insertions, deletions, and defects in the packaging site and/or MSD. The length of the scale bar represents 10 proviral sequences.
Figure 2.
Figure 2.
Q4PCR approach. Schematic representation of the Q4PCR protocol. Genomic DNA from CD4+ T cells was subjected to limiting dilution qPCR with a gag-specific primer/probe set to determine overall HIV-1 proviral frequency. NFL proviral genomes were amplified from CD4+ T cell genomic DNA in samples diluted to single-copy concentrations based on gag qPCR. An aliquot of the resulting amplicons was assayed by Q4PCR using a combination of primer/probe sets covering PS, gag, pol, and env. Samples with positive signal for any combination of at least two primer/probe sets were collected and subjected to nested NFL PCR, library preparation, and next-generation sequencing.
Figure 3.
Figure 3.
Quantitative analysis. (A) Frequency per million CD4+ T cells of gag+ proviruses amplified from genomic DNA and samples with any one, two, three, or all four qPCR probe signals after NFL amplification for the preinfusion (wk−2) and week 12 (wk12) time points. Horizontal bars indicate median values. For patient 9242, the frequency of env+ proviruses amplified from genomic DNA per million CD4+ T cells is plotted due to limited gag+ amplification signal. (B) Comparison of frequencies of inducible proviruses (Q2VOA), intact proviruses obtained with NFL sequencing strategy (NFL intact), and intact proviruses identified with Q4PCR (Q4PCR intact) at preinfusion and week 12 time points for the same samples (Lu et al., 2018; Mendoza et al., 2018). (C) Pearson correlation between frequency of intact proviruses identified with Q4PCR and inducible proviruses measured by Q2VOA at preinfusion and week 12 time points (Lu et al., 2018; Mendoza et al., 2018). Participant 9254 was excluded from the quantitative analysis because of inadequate sample availability. Individual patients are depicted in different colors. Time points are represented by circles and triangles for week −2 and week 12, respectively.
Figure 4.
Figure 4.
Qualitative sequence analysis. (A) Euler diagrams representing the overlap between env sequences obtained from Q4PCR (white), Q2VOA (blue), NFL sequencing (yellow), and rebound plasma SGA or PBMC outgrowth culture (red) from participants 9242, 9243, 9244, 9252, 9254, and 9255 (Lu et al., 2018; Mendoza et al., 2018). Q4PCR, Q2VOA, and NFL sequences obtained from the preinfusion and week 12 time point were combined. Identical env sequences were considered as shared sequences. The number inside overlapping areas is the sum of all shared sequences. (B) Pie charts depict the distribution of intact and defective proviral sequences at the preinfusion (wk−2) and week 12 (wk12) time points. The number in the middle of the pie represents the total number of proviruses sequenced. Pie slices indicate the proportion of sequences that were intact or had different defects, including PS defects and MSD site mutations (blue), premature stop codons mediated by hypermutation (yellow), single-nucleotide indels or nonsense mutations (orange), and sequences with large internal deletions (red).
Figure 5.
Figure 5.
Probe analysis. (A) Bar graphs showing the total number of sequenced samples that scored positive for any one, two, three, or all four qPCR probes out of a total of 1,832 assayed. (B) Stacked bar graphs showing the predictive value for intact (dark green) and defective (gray) proviral genomes of sequenced samples positive for any one, two, three, or four qPCR probes, respectively. (C) Stacked bar graphs showing the predictive value for intact (dark green) and defective (light gray) proviral genomes of sequenced samples positive for at least one, two, three, or four qPCR probes, respectively. The number of samples is depicted in white (intact) or black (defective), respectively. (D) Graphs showing the predictive value for intact and defective proviruses of individual probes and all possible combinations of at least two, three, or all four probes, respectively. The predictive value for intact proviruses is colored for each individual probe (PS, green; gag, blue; pol, yellow; and env, red) or as color combinations for specific probe combinations. The defective fraction is shown in gray.
Figure 6.
Figure 6.
Probe analysis for individual participants. Graphs showing the predictive value for intact and defective proviral genomes of individual probes and all possible combinations of at least two, three, or all four probes among participants 9242, 9243, 9244, 9252, 9254, and 9255. The predictive value for intact proviruses is colored for each individual probe (PS, green; gag, blue; pol, yellow; and env, red) or as color combinations for specific probe combinations. The defective fraction is shown in gray. Blank spaces illustrate the absence of specific probe or probe combination signals in individual patients.

References

    1. Althaus C.F., Gianella S., Rieder P., von Wyl V., Kouyos R.D., Niederöst B., Schmid A., Metzner K.J., Joos B., Günthard H.F., and Fischer M.. 2010. Rational design of HIV-1 fluorescent hydrolysis probes considering phylogenetic variation and probe performance. J. Virol. Methods. 165:151–160. 10.1016/j.jviromet.2010.01.012 - DOI - PubMed
    1. Bieniasz P.D., Ariyoshi K., Bourelly M.A., Bloor S., Foxall R.B., Harwood E.C., and Weber J.N.. 1993. Variable relationship between proviral DNA load and infectious virus titre in the peripheral blood mononuclear cells of HIV-1-infected individuals. AIDS. 7:803–806. 10.1097/00002030-199306000-00007 - DOI - PubMed
    1. Bruner K., and Siliciano R.. 2018. Compositions and methods related to characterizing proviral reservoirs. United States Patent Application US15/568,893, filed April 22, 2016.
    1. Bruner K.M., Murray A.J., Pollack R.A., Soliman M.G., Laskey S.B., Capoferri A.A., Lai J., Strain M.C., Lada S.M., Hoh R., et al. . 2016. Defective proviruses rapidly accumulate during acute HIV-1 infection. Nat. Med. 22:1043–1049. 10.1038/nm.4156 - DOI - PMC - PubMed
    1. Bruner K.M., Wang Z., Simonetti F.R., Bender A.M., Kwon K.J., Sengupta S., Fray E.J., Beg S.A., Antar A.A.R., Jenike K.M., et al. . 2019. A quantitative approach for measuring the reservoir of latent HIV-1 proviruses. Nature. 566:120–125. 10.1038/s41586-019-0898-8 - DOI - PMC - PubMed

Publication types

Associated data