. 2019 Jul 26;10(1):3350.
doi: 10.1038/s41467-019-11266-x.

Single cell analysis of human foetal liver captures the transcriptional profile of hepatobiliary hybrid progenitors

Affiliations

Single cell analysis of human foetal liver captures the transcriptional profile of hepatobiliary hybrid progenitors

Joe M Segal et al. Nat Commun. .

Abstract

The liver parenchyma is composed of hepatocytes and bile duct epithelial cells (BECs). Controversy exists regarding the cellular origin of human liver parenchymal tissue generation during embryonic development, homeostasis or repair. Here we report the existence of a hepatobiliary hybrid progenitor (HHyP) population in human foetal liver using single-cell RNA sequencing. HHyPs are anatomically restricted to the ductal plate of foetal liver and maintain a transcriptional profile distinct from foetal hepatocytes, mature hepatocytes and mature BECs. In addition, molecular heterogeneity within the EpCAM+ population of freshly isolated foetal and adult human liver identifies diverse gene expression signatures of hepatic and biliary lineage potential. Finally, we FACS isolate foetal HHyPs and confirm their hybrid progenitor phenotype in vivo. Our study suggests that hepatobiliary progenitor cells previously identified in mice also exist in humans, and can be distinguished from other parenchymal populations, including mature BECs, by distinct gene expression profiles.


Conflict of interest statement

The authors declare no competing interests.

Figures

Fig. 1
Fig. 1
ScRNA-Seq analysis of foetal and adult human liver. a Overview of foetal and adult liver FACS strategy. b 2D t-SNE visualisation of single cells isolated from foetal and adult human liver coloured by FACS gating population, shaped by tissue source. c Transcript expression of selected markers overlaid on the 2D t-SNE space of human liver scRNA-seq analysis. Expression is Log10(TPM). d Heat maps of selected gene expression in mature hepatic, foetal hepatic, hybrid hepatobiliary progenitor (HHyP) and mature cholangiocyte cell populations. Gene expression in Log10(TPM). Mean gene expression of cells in each cluster is plotted, HHyP population = 138 cells, mature biliary epithelial cell (BEC) = 9 cells, mature hepatocytes = 226 cells, foetal hepatocytes = 82 cells. e 2D t-SNE visualisation of single cells isolated from foetal and adult human liver coloured by cell type. Phenotypic labelling based on transcriptional analysis. f Proportions of tissue sample contributions from adult liver (AL) and foetal Liver (FL) in each phenotypically labelled cell type as a percentage of the total population. t-SNE t-distributed stochastic neighbour embedding, TPM transcripts per million, FACS fluorescence-activated cell sorting
Fig. 2
Fig. 2
Comparison of foetal hepatic and HHyP scRNA-seq populations. Heat map of selected gene expression in foetal hepatic, foetal hybrid hepatobiliary progenitor (HHyP) and adult HHyP cells. Gene expression in Log10(TPM). TPM transcripts per million
Fig. 3
Fig. 3
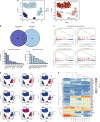
Comparison of ALB+ cells in human liver scRNA-seq populations. a 2D t-SNE visualisation of ALB+ cells isolated from foetal and adult human liver coloured by tissue type (left panel) and K-means cluster (right panel). Phenotypic labelling based on transcriptional analysis. b Comparison of foetal and adult hepatobiliary hybrid progenitors (HHyP) significantly enriched genes (FC 1.1, p-val < 0.05 with student t test) by venn diagram with top ten highly expressed genes in foetal (left) and adult (right) HHyPs. c Gene set enrichment analysis (GSEA) of foetal vs. adult HHyPs for Gene ontology (GO) terms ‘Stem cell proliferation’, ‘Developmental cell growth’, ‘Homophilic cell adhesion via plasma membrane adhesion molecules’ and ‘Extracellular matrix component’. d Transcript expression of selected markers overlaid on the 2D t-SNE space of human liver scRNA-seq analysis for adult HHyP-restricted genes (top), foetal HHyP-restricted genes (middle) and other cell type-specific expression patterns (bottom). Expression is Log10(TPM). e Heatmap of top foetal HHyP up regulated genes in publicly available sequencing data from human hepatic liver progenitor cells (hepLPCs-Heps, GSE105019) converted from primary hepatocytes. Heatmap shows expression in primary hepatocytes (pH) and human primary hepatocytes converted into liver progenitor-like cells (HepLPCs) at different stages in transition and expansion medium (TEM). The colour bar indicates gene expression in log10 scale. t-SNE t-distributed stochastic neighbour embedding, TPM transcripts per million, FC fold change
Fig. 4
Fig. 4
TROP2 foetal HHyPs are restricted to the ductal plate of foetal liver. a RNA-ISH for CDH6 and STAT1 on human second trimester (15–21 pcw) foetal liver ductal plate (DP) and bile duct (BD) regions. Scale bars represent 50 μm. b Immunofluorescence (IF) staining of CDH6 (yellow), CLDN3 (magenta) and STAT1 (grey) co-expression in human foetal liver slides. Slides counterstained in DAPI (cyan). DP and BD structures outlined in white. Scale bars represent 25 μm. c Immunohistochemistry (IHC) of EpCAM, CK19, CDH6 and STAT1 in BD and DP regions of human foetal liver. Scale bars represent 50 μm. d Duplex RNA-ISH for CDH6(red)/STAT1(blue) and TROP-2(red)/STAT1(blue) in foetal liver BD and DP structures. Scale bars represent 50 μm. Scale bars of zoomed in region represent 25 μm. e Phase contrast imaging and IF of foetal intra-hepatic organoids (f-IHOs) derived from EpCAM enriched foetal liver cells in liver expansion (LE) media. All structures are counterstained with DAPI (blue). All staining performed between passages 3 and 5. f Schematic and IF staining of f-IHOs cultured for 7 days in hepatic differentiation (HD media) and biliary differentiation (BD media). All staining performed between passages 3 and 5. Images representative of n = 3 foetal liver differentiation experiments
Fig. 5
Fig. 5
In vivo lineage potential of human foetal HHyPs. a Experimental strategy for isolation and in vivo characterisation of foetal hepatobiliary hybrid progenitors (HHyPs) by transplantation beneath the renal capsules of immunodeficient NOD scid gamma (NSG) mice. b 2D t-SNE visualisation of single cells isolated from foetal human liver coloured by FACS gating population (left panel) and transcript expression of ALB and MCAM overlaid on the 2D t-SNE space of human foetal liver scRNA-seq analysis (right panel). Expression is Log10(TPM). c Gating scheme for the isolation of distinct foetal human liver populations based on expression of CD235a, CD45, EpCAM, NCAM and MCAM. d Hematoxylin and eosin (H&E) staining in tissue cross-sections of implant regions 4 weeks post renal capsule transplantation of human foetal liver FACS populations. Scale bars represent 100 μm. e Immunofluorescence (IF) co-staining of CK19 (green) and ALB (red) in implant regions of HHyPs post 4 weeks transplantation and matched control mouse adult liver. Slides counterstained in DAPI (cyan). Scale bar represents 25 μm. f IF staining of FAH (red) and HNF4A (green) in implant region of HHyPs 4 weeks post transplantation. Slides counterstained in DAPI (cyan). Scale bars represent 25 μm. g IF co-staining of TROP-2 (white) and ALB (red) in implant region of HHyPs 4 weeks post transplantation. Slides counterstained in DAPI (cyan). Scale bars represent 25 μm. t-SNE t-distributed stochastic neighbour embedding, FACS fluorescence-activated cell sorting, TPM transcripts per million
Fig. 6
Fig. 6
Expansion of EpCAM+/NCAM+/TROP2 human foetal liver HHyPs in the renal capsule. a 2D t-SNE visualisation of single cells isolated from foetal and adult human liver coloured by TROP-2 gene expression. Expression is Log10(TPM). b Schematic of hepatic and BEC lineage restriction of HHyPs based on NCAM/TROP-2 expression. c Gating scheme for the isolation of distinct foetal human liver populations based on expression of CD235a, CD45, EpCAM, NCAM and TROP2. d Hematoxylin and eosin (H&E) staining in tissue cross-sections of explant region for 4-week post renal capsule transplantation. Scale bars represent 250 μm. e Immunofluorescence (IF) staining of FAH (red) in explant region of CD235a/CD45/EpCAM+/NCAM+/TROP2 HHyPs 4-week post transplantation. Slides counterstained in DAPI (cyan). Scale bars represent 75 μm. t-SNE t-distributed stochastic neighbour embedding, TPM transcripts per million
Fig. 7
Fig. 7
Collated marker expression in hepatic progenitor populations. Heatmaps of selected marker expression in populations identified in this study with different cohorts of liver progenitor-like cells, biliary epithelial cells (BECs) and primary hepatocytes. Shown is gene expression patterns of publicly available sequencing data from GEO (https://www.ncbi.nlm.nih.gov/geo/) or literature mined. Bulk RNA-seq data sets, include reprogrammed human hepatic liver progenitor cells (hepLPCs-Heps, GSE105019) and primary hepatocytes (pHs, GSE105019) from Fu et al. and mouse hepatocyte-derived proliferative ducts (HepPD, Tarlow et al. 2015) and biliary-derived proliferative ducts ((BilPD) (GSE55552), Tarlow et al. 2015). ScRNA-seq data sets, include human BECs (GSE115469) from MacParland et al.. Expression graded as high (red) to low (blue) relative to individual data sets

References

    1. Lemaigre F, Zaret KS. Liver development update: new embryo models, cell lineage control, and morphogenesis. Curr. Opin. Genet. Dev. 2004;14:582–590. doi: 10.1016/j.gde.2004.08.004. - DOI - PubMed
    1. Yanger K, et al. Adult hepatocytes are generated by self-duplication rather than stem cell differentiation. Cell Stem Cell. 2014;15:340–349. doi: 10.1016/j.stem.2014.06.003. - DOI - PMC - PubMed
    1. Lu WY, et al. Hepatic progenitor cells of biliary origin with liver repopulation capacity. Nat. Cell Biol. 2015;17:971–983. doi: 10.1038/ncb3203. - DOI - PMC - PubMed
    1. Raven A, et al. Cholangiocytes act as facultative liver stem cells during impaired hepatocyte regeneration. Nature. 2017;547:350–354. doi: 10.1038/nature23015. - DOI - PMC - PubMed
    1. Furuyama K, et al. Continuous cell supply from a Sox9-expressing progenitor zone in adult liver, exocrine pancreas and intestine. Nat. Genet. 2011;43:34–41. doi: 10.1038/ng.722. - DOI - PubMed

Publication types