. 2019 Sep 26;47(17):9069-9086.
doi: 10.1093/nar/gkz627.

Pre-marked chromatin and transcription factor co-binding shape the pioneering activity of Foxa2

Affiliations

Pre-marked chromatin and transcription factor co-binding shape the pioneering activity of Foxa2

Filippo M Cernilogar et al. Nucleic Acids Res. .

Abstract

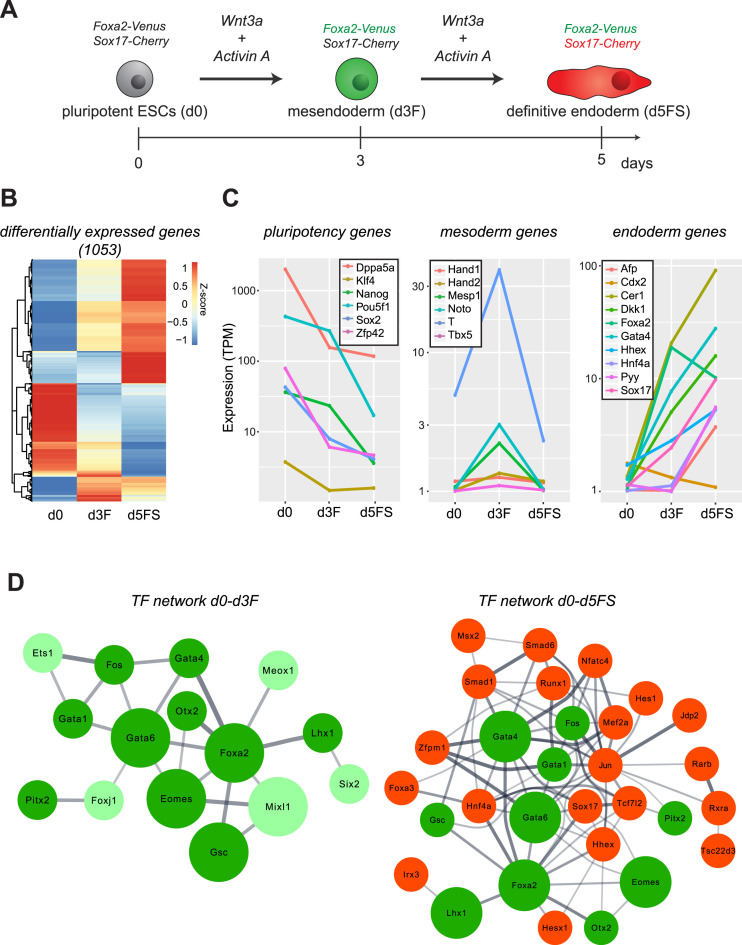
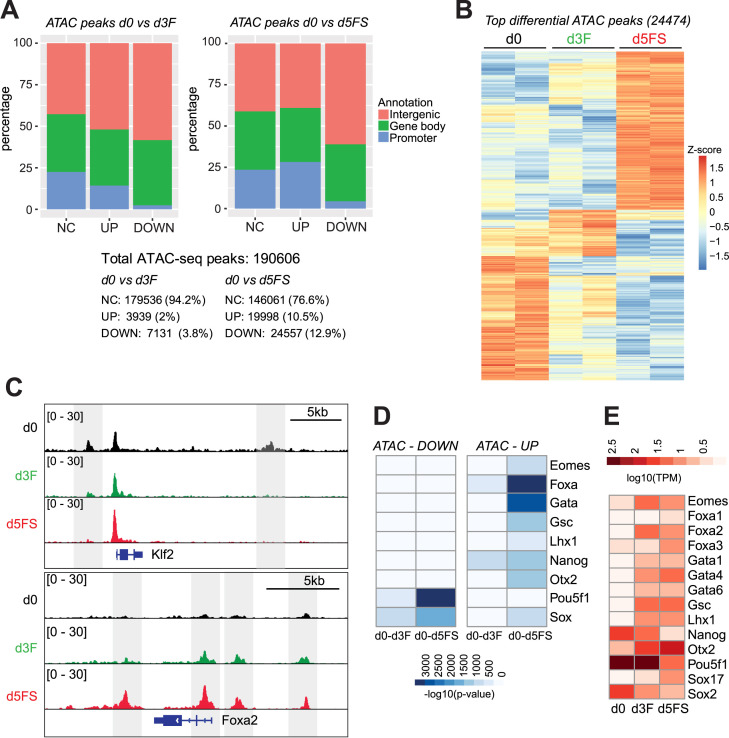
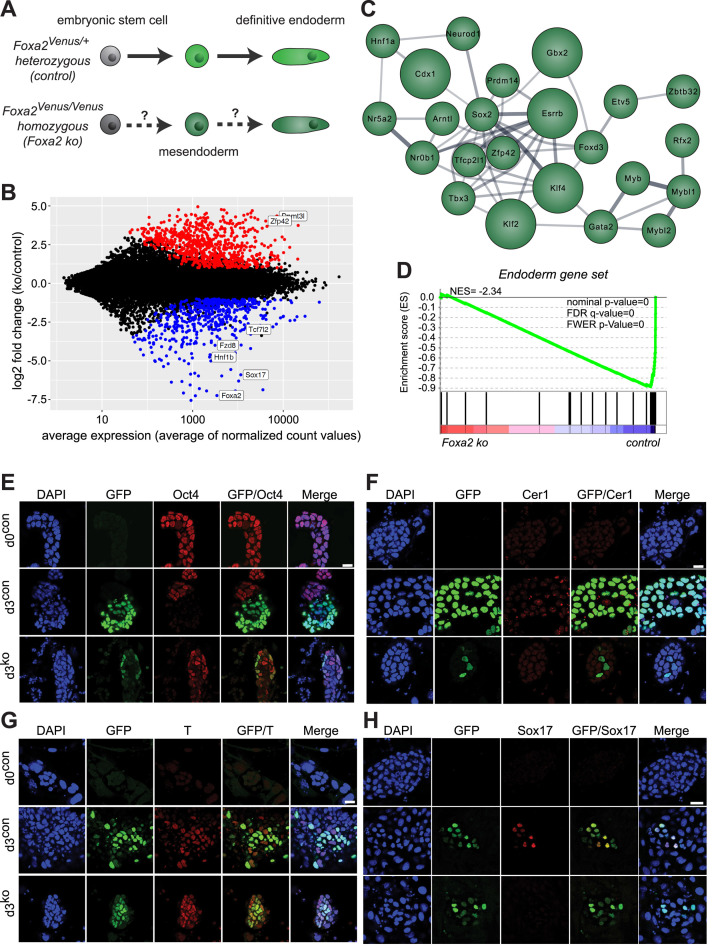
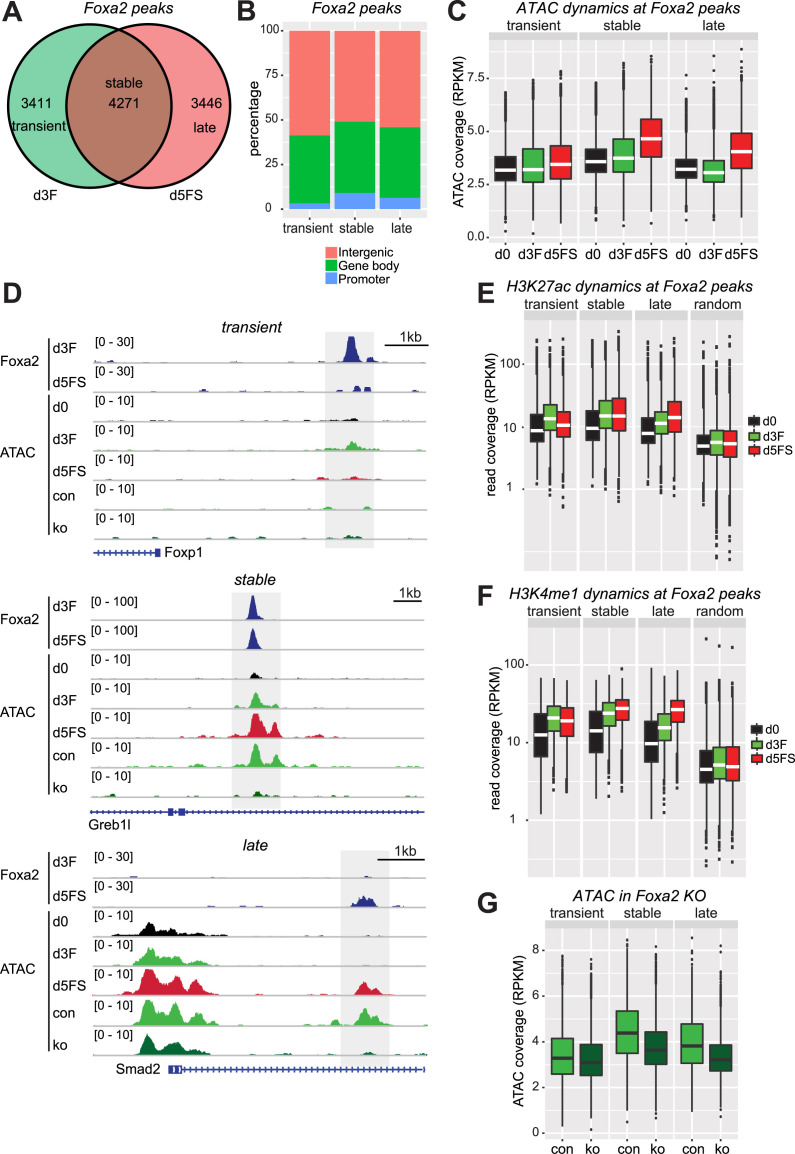
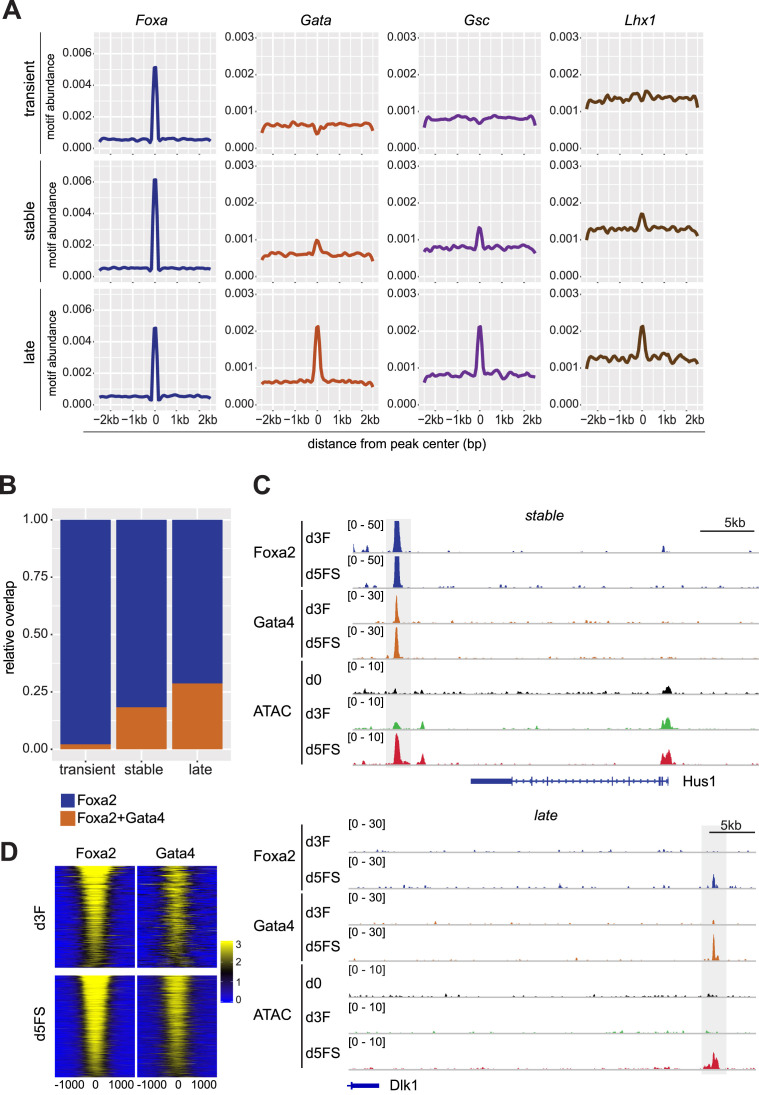
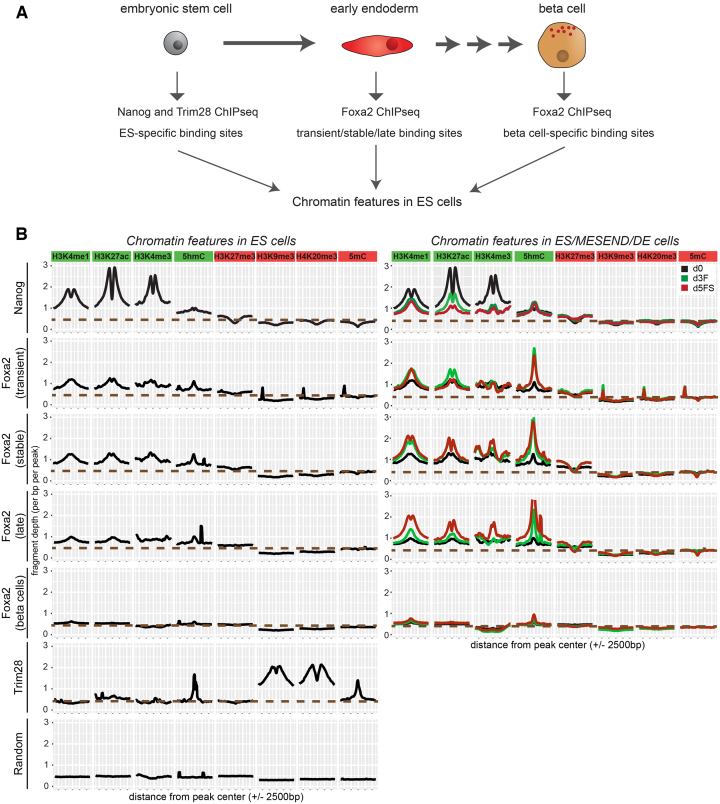
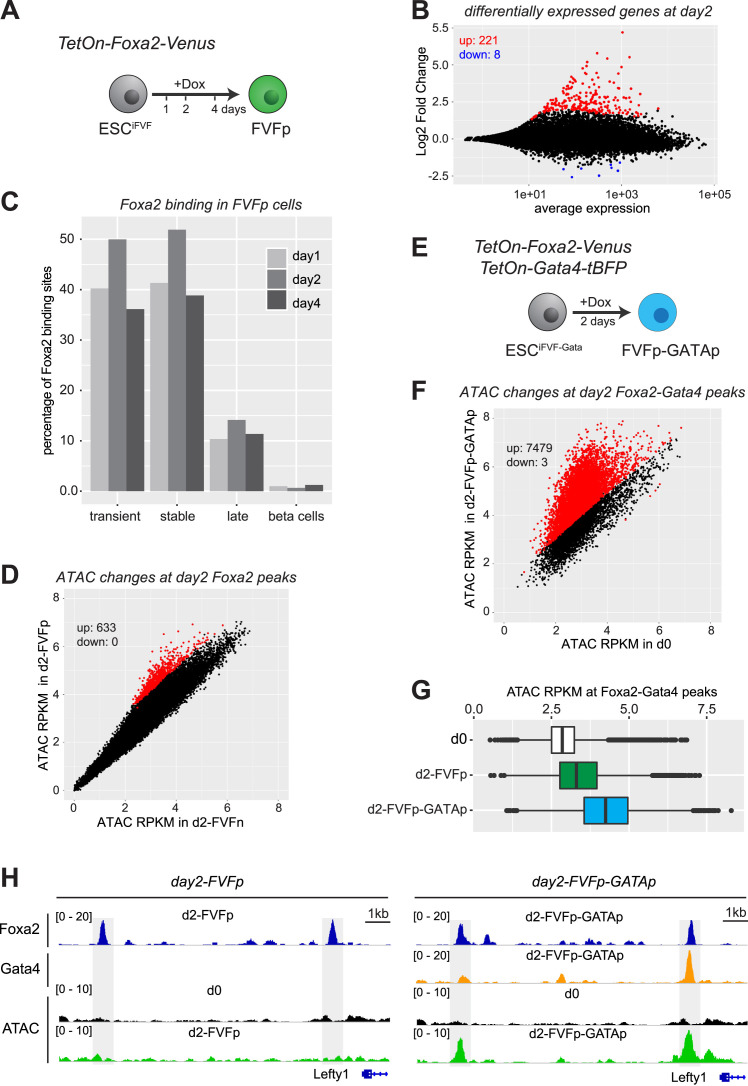
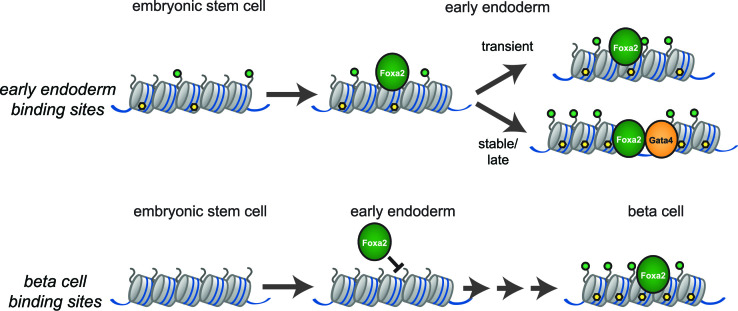
Pioneer transcription factors (PTF) can recognize their binding sites on nucleosomal DNA and trigger chromatin opening for recruitment of other non-pioneer transcription factors. However, critical properties of PTFs are still poorly understood, such as how these transcription factors selectively recognize cell type-specific binding sites and under which conditions they can initiate chromatin remodelling. Here we show that early endoderm binding sites of the paradigm PTF Foxa2 are epigenetically primed by low levels of active chromatin modifications in embryonic stem cells (ESC). Priming of these binding sites is supported by preferential recruitment of Foxa2 to endoderm binding sites compared to lineage-inappropriate binding sites, when ectopically expressed in ESCs. We further show that binding of Foxa2 is required for chromatin opening during endoderm differentiation. However, increased chromatin accessibility was only detected on binding sites which are synergistically bound with other endoderm transcription factors. Thus, our data suggest that binding site selection of PTFs is directed by the chromatin environment and that chromatin opening requires collaboration of PTFs with additional transcription factors.


Figures

Figure 1.
Figure 1.
An in vitro differentiation system modelling early endoderm differentiation. (A) Endoderm differentiation of ESCs is triggered by Wnt3A/Activin A treatment. Mesendoderm (Foxa2-Venuspos; Sox17-Cherryneg) and endoderm (Foxa2-Venuspos; Sox17-Cherrypos) cells can be isolated by FACS. (B) Heat map showing z-scores of the expression levels of the 1053 differentially expressed genes between pluripotent ESCs (d0), mesendoderm (d3F) and endoderm (d5FS) cells (Padj < 0.05, fold change > 2; n = 2 for each condition). (C) Average expression levels of selected marker genes for pluripotent, mesoderm and endoderm cells in the in vitro differentiated ESCs (TPM – Transcripts Per Kilobase Million; n = 2 for each condition). (D) Network of most influential transcription factors, driving transition from pluripotent ESCs (d0) through a mesendoderm stage (d3F) to definitive endoderm (d5FS) cells. Bigger nodes correspond to the top 5 transcription factors. Width of edges corresponds to String database (StringDB) scores. Only connected nodes are plotted. Color code: light green factors are specific to the d0–d3F network, green factors are present in both networks, red factors emerge in the d0–d5FS network.
Figure 2.
Figure 2.
Foxa motifs are over-represented in regions of increased chromatin accessibility upon endoderm differentiation. (A) Numbers and percentages of not changed (NC) and dynamic (UP/DOWN) ATAC-seq peaks associated with different genomic features in d0 versus d3F (left panel) or in d0 versus d5FS (right panel) comparison. Peaks are considered dynamic with an ATAC-seq coverage fold change >2. (B) Heat map showing relative chromatin accessibility (z-scores of normalized ATAC-seq signals) of the top dynamic ATAC-seq peaks (24 474) in pluripotent ESCs (d0), mesendoderm (d3F) and endoderm (d5FS) cells (Padj < 0.05, fold change > 4; n = 2 for each condition). (C) Representative genome browser view of ATAC-seq signals in d0, d3F and d5FS cells. (D) Heat map showing the P-values of transcription factor motif enrichments in dynamic ATAC-seq peaks. The Homer tool was used to scan for known motifs of expressed transcription factors (TPM > 1). Only the top scoring motifs with –log10 (P-value) > 500 are shown. Since members of Foxa, Gata and Sox families bind very similar motifs only the family names are given. Columns represent analyses for differential ATAC peaks between d0–d3F and d0–d5FS. (E) Expression heatmap of transcription factors shown in (D) in d0, d3F and d5FS cells. Relevant Foxa, Gata and Sox family members are shown.
Figure 3.
Figure 3.
Loss of FOXA2 impairs endoderm differentiation. (A) Differentiation and FACS sorting strategy of control versus Foxa2 ko ESC into endoderm. (B) Dotplot showing average expression versus log2-fold change of coding genes in endoderm differentiating Foxa2Venus/+ control (d3con) versus Foxa2Venus/Venus ko (d3ko) cells. Coloured dots indicate genes with significantly changed expression (Padj < 0.05, fold change > 2; n = 3 for each condition). Positions of relevant genes are indicated. (C) Network of most influential transcription factors in endoderm differentiating Foxa2Venus/Venus ko (d3ko) cells. Bigger nodes correspond to the top 5 transcription factors. Width of edges corresponds to String database (StringDB) scores. The network has no overlap with the one shown in Figure 1D. (D) Gene set enrichment analysis (GSEA) of an endoderm gene set between control (d3con) and Foxa2 ko cells (d3ko). The Foxa2 ko cells show strong underrepresentation of these endoderm signature genes. NES: normalized enrichment score. (E) Confocal sections showing undifferentiated Foxa2Venus/+ (d0con), endoderm differentiating Foxa2Venus/+ (d3con) and Foxa2Venus/Venus homozygous (d3ko) cells stained with antibodies to Venus/GFP (green), Oct4 (red) and DAPI (blue). Scale bar: 20 μm. (F) Confocal sections showing undifferentiated Foxa2Venus/+ (d0con), endoderm differentiating Foxa2Venus/+ (d3con) and Foxa2Venus/Venus (d3ko) cells stained with antibodies to Venus/GFP (green), Cer1 (red) and DAPI (blue). Scale bar: 20 μm. (G) Confocal sections showing undifferentiated Foxa2Venus/+ (d0con), endoderm differentiating Foxa2Venus/+ (d3con) and Foxa2Venus/Venus (d3ko) cells stained with antibodies to Venus/GFP (green), Brachyury/T (red) and DAPI (blue). Scale bar: 20μm. (H) Confocal sections showing undifferentiated Foxa2Venus/+ (d0con), endoderm differentiating Foxa2Venus/+ (d3con) and Foxa2Venus/Venus (d3ko) cells stained with antibodies to Venus/GFP (green), Sox17 (red) and DAPI (blue). Scale bar: 20μm.
Figure 4.
Figure 4.
Foxa2 is required for chromatin opening. (A) Venn diagram of Foxa2 binding sites in d3F (green) and d5FS (red) cells. d3F- and d5FS-specific binding sites were assigned ‘transient’ and ‘late’, respectively; overlapping binding sites were assigned ‘stable’. n = 2 for each condition. (B) Percentages of transient, stable and late Foxa2 binding site associated with different genomic features. (C) Box plot of normalized ATAC-seq coverage on transient, stable and late Foxa2 binding sites in d0, d3F and d5FS cells. n = 2 for each condition. (D) Genome browser view of examples for transient, stable and late Foxa2 binding sites. The following tracks are displayed: Foxa2 ChIP-seq in d3F and d5FS cells; ATAC-seq in d0, d3F, d5FS, Foxa2Venus/+ (d3con) and Foxa2Venus/Venus (d3ko) endoderm differentiating cells. Dashed regions indicate Foxa2 binding sites. (E) Box plot of normalized H3K27ac ChIP-seq coverage on Foxa2 binding sites and random genomic regions in d0, d3F and d5FS cells. n = 2 for each condition.(F) Box plot of normalized H3K4me1 ChIP-seq coverage on Foxa2 binding sites and random regions in d0, d3F and d5FS cells. n = 2 for each condition. (G) Box plots of normalized ATAC-seq coverage on transient, stable and late Foxa2 binding sites in endoderm differentiating Foxa2Venus/+ (d3con) and Foxa2Venus/Venus (d3ko) cells isolated at day 3 of differentiation. n = 3 for each condition. Wilcoxon ranks-sum test statistics for all the box plots is shown in Supplementary Table S7.
Figure 5.
Figure 5.
Co-binding of Foxa2 with other TFs correlates with chromatin opening (A) Density plots for motif abundances of Foxa, Gata, Gsc and Lhx1 motifs in transient, stable and late Foxa2 binding sites. (B) Fraction of transient, stable and late Foxa2 binding sites bound by Foxa2 (blue) or co-bound by Foxa2 and Gata4 (brown). (C) Genome browser view of example stable and late Foxa2 binding sites. The following tracks are displayed: Foxa2 and Gata4 ChIP-seq in d3F and d5FS cells, ATAC-seq in d0, d3F and d5FS cells. Dashed regions indicate stable (upper panel) and late (lower panel) Foxa2 binding sites. (D) Read-density heat map showing the normalized coverage of Foxa2 and Gata4 on Foxa2 binding sites. Top panel: Foxa2 and Gata4 ChIP-seq in d3F cells. Bottom panel: Foxa2 and Gata4 ChIP-seq in d5FS cells. Distance from the peak centre is given in bp.
Figure 6.
Figure 6.
Endoderm-specific Foxa2 binding sites feature active chromatin modifications in ES cells. (A) Embryonic stem cells can differentiate in definitive endoderm cells which represent an early stage of endoderm development. Later in development, the pancreas is formed as an endoderm-derived organ that contains insulin-secreting beta cells. We analysed whether Foxa2 binding sites in transient/stable/late or pancreatic beta cells show a different chromatin profile already before Foxa2 expression, in ESCs. As controls for active and repressed region-associated factors, we analysed binding sites of Nanog (active TF) and Trim28 (repressor). (B) Left panel: Density plots showing average levels of active (H3K4me1, H3K4me3, H3K27ac, 5hmC) and repressive (H3K27me3, H3K9me3, H4K20me3, 5mC) chromatin modifications in pluripotent ES cells at specific peak sets: Nanog binding sites in ES cells, Foxa2 transient, stable, late binding sites, Foxa2 binding sites in pancreas (beta cells), Trim28 binding sites in ES cells and random genomic regions. Right panel: density plots for active and repressive chromatin modifications in d0 (black), d3F (green) and d5FS (red) cells at Nanog and Foxa2 binding sites.
Figure 7.
Figure 7.
Transcriptional and epigenetic effects of Foxa2 and Gata4 binding in ES cells (A) Scheme of the experimental strategy to induce the expression of Foxa2 in ESCs. (B) Dot plot showing average expression vs. log2-fold change of protein coding genes in Foxa2-expressing (d2-FVFp) versus non-expressing (d2-FVFn) ESCiFVF cells 48h after dox induction. Genes with significantly changed expression (Padj < 0.05, fold change > 2; n = 2 for each condition) are coloured (red = increased expression in d2-FVFp, blue = increased expression in d2-FVFn). (C) Bar graph showing the percentage of beta cell- or endoderm-specific Foxa2 binding sites bound by Foxa2 in FVFp cells, one, two or four days after dox induction. (D) Dot plot showing normalized ATAC-seq coverage in Foxa2-expressing (d2-FVFp) versus non-expressing (d2-FVFn) ESCiFVF cells at Foxa2 binding sites 48 h after dox induction. Significant chromatin accessibility changes (Padj < 0.05, fold change > 2; n = 2 for each condition) are coloured in red. (E) Scheme of the experimental strategy to induce the expression of Foxa2 and Gata4 in ESCs. (F) Dot plot showing normalized ATAC-seq coverage in Foxa2/Gata4 co-expressing (d2-FVFp-GATAp) versus non-expressing (d0) cells at Foxa2/Gata4 binding sites 48 h after dox induction. Significant chromatin accessibility changes (Padj < 0.05, fold change > 2; n = 2 for each condition) are coloured in red. (G) Box plots of normalized ATAC-seq coverage of Foxa2/Gata4 co-bound sites in control (d0), Foxa2-expressing (d2-FVFp) and Foxa2/Gata4 co-expressing (d2-FVFp-GATAp) cells. n = 2 for each condition. Wilcoxon ranks-sum test statistics is shown in Supplementary Table S7. (H) Genome browser view of example Foxa2 binding sites in d2-FVFp cells (right panel, day2-FVFp) and Foxa2/Gata4 co-bound sites in d2-FVFp-GATAp cells (left panel, day2-FVFp-GATAp). The following tracks are displayed: Foxa2 Chip-seq in d2-FVFp and d2-FVFp-GATAp cells; Gata4 ChIP-seq in d2-FVFp-GATAp cells; ATACseq in d0, d2-FVFp and d2-FVFp-GATAp cells. Dashed regions indicate Foxa2 binding sites in d2-FVFp cells (left panel) which are co-bound with Gata4 in d2-FVFp-GATAp cells (right panel).
Figure 8.
Figure 8.
Model for binding site selection and chromatin opening by Foxa2. During the transition from ESC to endoderm, Foxa2 preferentially binds endoderm binding sites featured by low levels of active chromatin modifications (yellow – DNA hydroxymethylation, green – active histone marks). Non-bound lineage-inappropriate binding sites (e.g. beta cell-specific sites) are not featured by active chromatin marks during early endoderm differentiation. Increase in chromatin accessibility occurs on binding sites where Foxa2 co-binds with additional transcription factors (stable and late sites), whereas isolated Foxa2 binding sites do not show increase in chromatin accessibility upon Foxa2 binding (transient sites).

References

    1. Spitz F., Furlong E.E.. Transcription factors: from enhancer binding to developmental control. Nat. Rev. Genet. 2012; 13:613–626. - PubMed
    1. Jiang C., Pugh B.F.. Nucleosome positioning and gene regulation: advances through genomics. Nat. Rev. Genet. 2009; 10:161–172. - PMC - PubMed
    1. Voss T.C., Hager G.L.. Dynamic regulation of transcriptional states by chromatin and transcription factors. Nat. Rev. Genet. 2014; 15:69–81. - PMC - PubMed
    1. Iwafuchi-Doi M., Zaret K.S.. Pioneer transcription factors in cell reprogramming. Genes Dev. 2014; 28:2679–2692. - PMC - PubMed
    1. Soufi A., Garcia M.F., Jaroszewicz A., Osman N., Pellegrini M., Zaret K.S.. Pioneer transcription factors target partial DNA motifs on nucleosomes to initiate reprogramming. Cell. 2015; 161:555–568. - PMC - PubMed

Publication types

MeSH terms