

Distance-based analysis of variance for brain connectivity
- PMID: 31350904
- PMCID: PMC7653688
- DOI: 10.1111/biom.13123
Distance-based analysis of variance for brain connectivity
Abstract
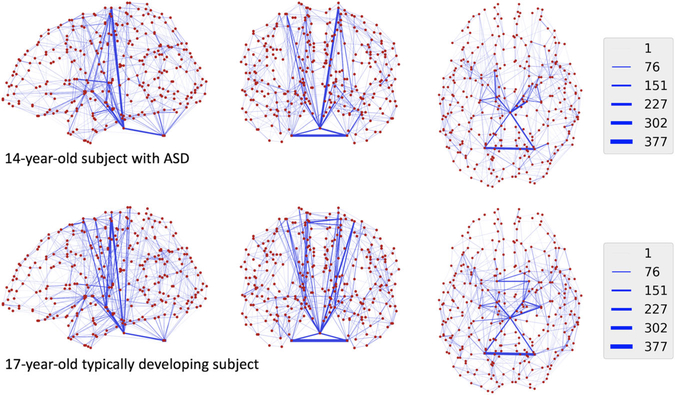
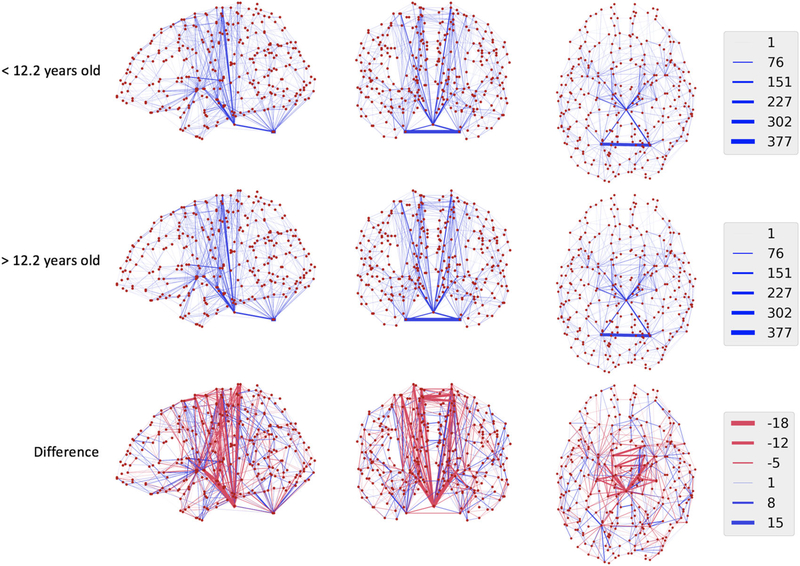
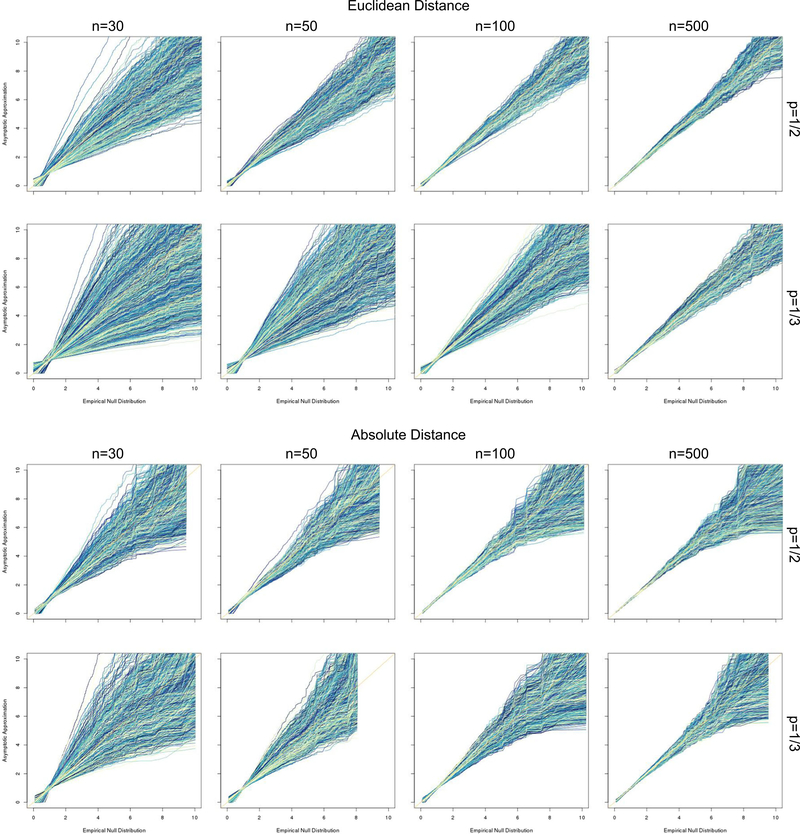
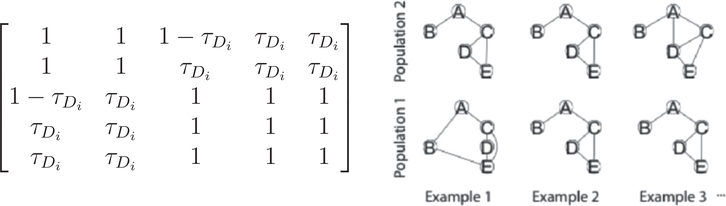
The field of neuroimaging dedicated to mapping connections in the brain is increasingly being recognized as key for understanding neurodevelopment and pathology. Networks of these connections are quantitatively represented using complex structures, including matrices, functions, and graphs, which require specialized statistical techniques for estimation and inference about developmental and disorder-related changes. Unfortunately, classical statistical testing procedures are not well suited to high-dimensional testing problems. In the context of global or regional tests for differences in neuroimaging data, traditional analysis of variance (ANOVA) is not directly applicable without first summarizing the data into univariate or low-dimensional features, a process that might mask the salient features of high-dimensional distributions. In this work, we consider a general framework for two-sample testing of complex structures by studying generalized within-group and between-group variances based on distances between complex and potentially high-dimensional observations. We derive an asymptotic approximation to the null distribution of the ANOVA test statistic, and conduct simulation studies with scalar and graph outcomes to study finite sample properties of the test. Finally, we apply our test to our motivating study of structural connectivity in autism spectrum disorder.
Keywords: biostatistics; distance statistics; kernel ANOVA; neuroimaging.
© 2019 The International Biometric Society.
Figures
References
-
- Anderson TW (1963) Asymptotic theory for principal component analysis. Annals of Mathematical Statistics, 34(1), 122–148.
-
- Behrens T, Woolrich M, Jenkinson M, Johansen-Berg H, Nunes R, Clare S et al. (2003) Characterization and propagation of uncertainty in diffusion-weighted mr imaging. Magnetic Resonance in Medicine, 50(5), 1077–1088. - PubMed
-
- Cuevas A, Febrero M and Fraiman R (2004) An anova test for functional data. Computational Statistics and Data Analysis, 47(1), 111–122.
Publication types
MeSH terms
Grants and funding
LinkOut - more resources
Full Text Sources
