

Comparison of penh, fluka, and Geant4/topas for absorbed dose calculations in air cavities representing ionization chambers in high-energy photon and proton beams
- PMID: 31350915
- PMCID: PMC6851981
- DOI: 10.1002/mp.13737
Comparison of penh, fluka, and Geant4/topas for absorbed dose calculations in air cavities representing ionization chambers in high-energy photon and proton beams
Abstract
Purpose: The purpose of this work is to analyze whether the Monte Carlo codes penh, fluka, and geant4/topas are suitable to calculate absorbed doses and ratios in therapeutic high-energy photon and proton beams.
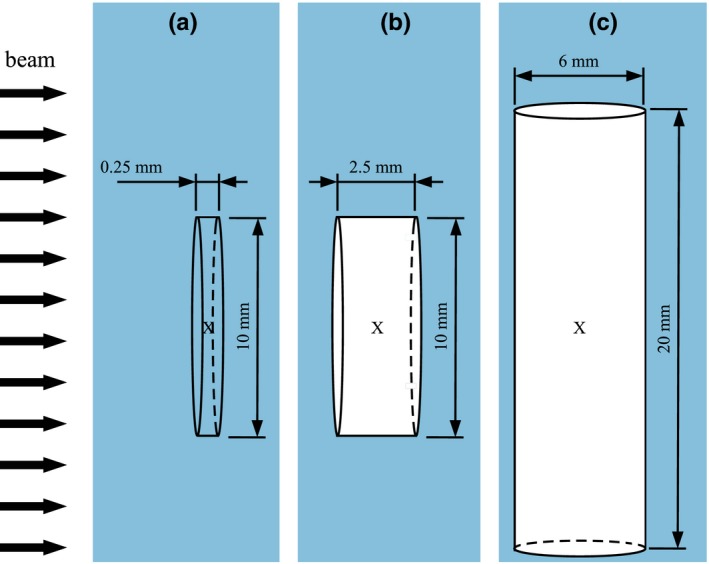
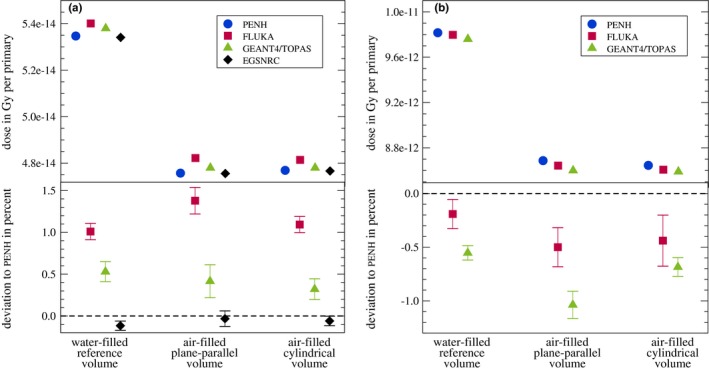
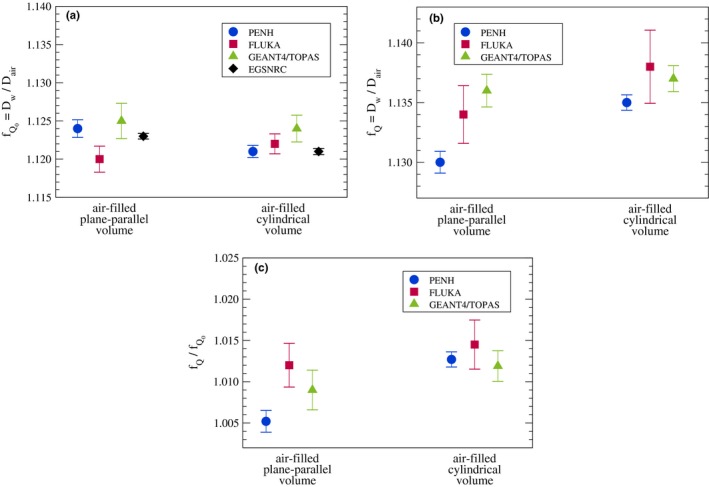
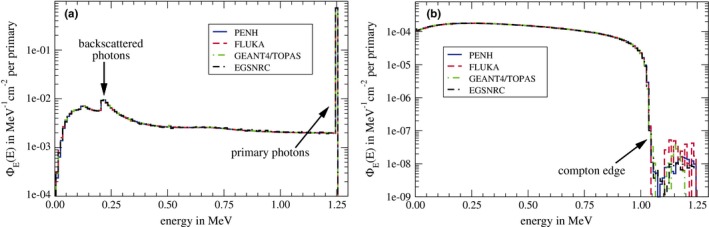
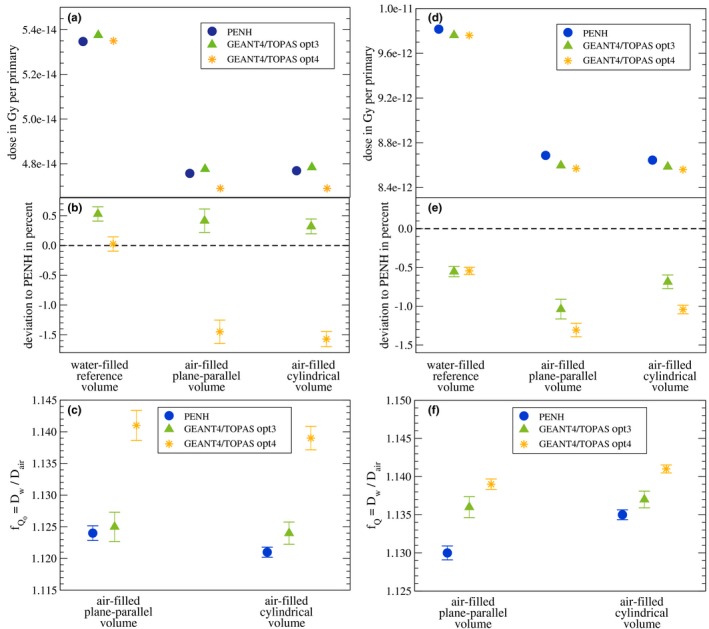
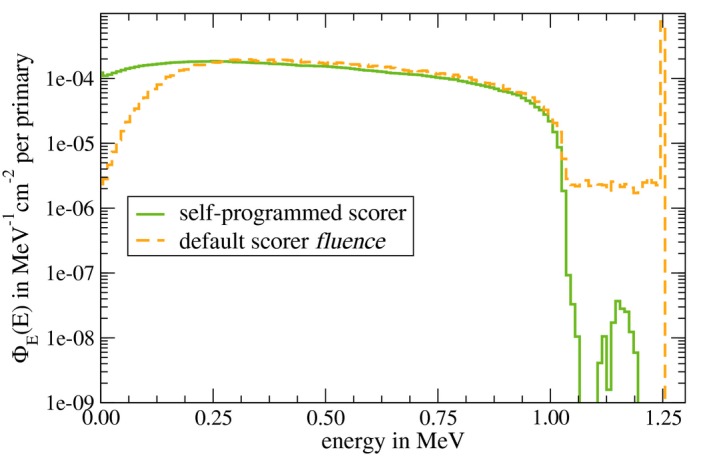
Methods: We used penh, fluka, geant4/topas, and egsnrc to calculate the absorbed dose to water in a reference water cavity and the absorbed dose to air in two air cavities representative of a plane-parallel and a cylindrical ionization chamber in a 1.25 MeV photon beam and a 150 MeV proton beam - egsnrc was only used for the photon beam calculations. The physics and transport settings in each code were adjusted to simulate the particle transport as detailed as reasonably possible. From these absorbed doses, factors, factors, and ratios (which are the basis of Monte Carlo calculated beam quality correction factors ) were calculated and compared between the codes. Additionally, we calculated the spectra of primary particles and secondary electrons in the reference water cavity, as well as the integrated depth-dose curve of 150 MeV protons in water.
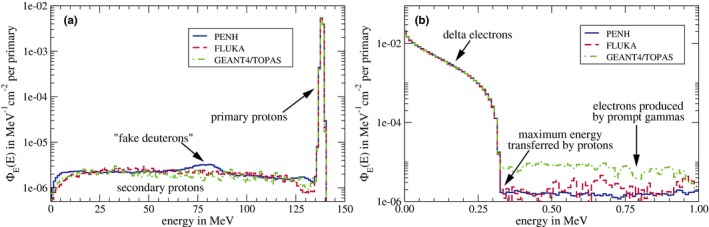
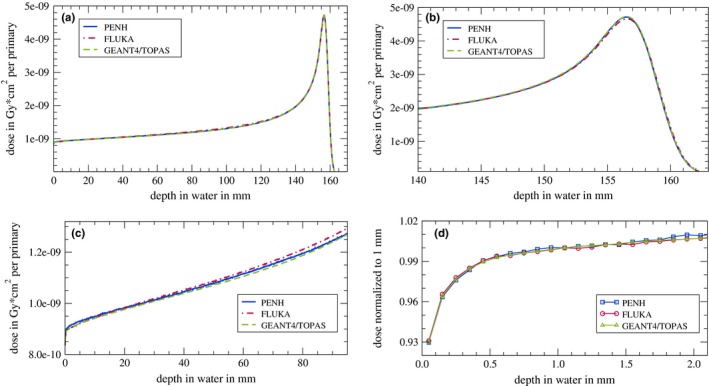
Results: The absorbed doses agreed within 1.4% or better between the individual codes for both the photon and proton simulations. The and factors agreed within 0.5% or better for the individual codes for both beam qualities. The resulting ratios for 150 MeV protons agreed within 0.7% or better. For the 1.25 MeV photon beam, the spectra of photons and secondary electrons agreed almost perfectly. For the 150 MeV proton simulation, we observed differences in the spectra of secondary protons whereas the spectra of primary protons and low-energy delta electrons also agreed almost perfectly. The first 2 mm of the entrance channel of the 150 MeV proton Bragg curve agreed almost perfectly while for greater depths, the differences in the integrated dose were up to 1.5%.
Conclusion: penh, fluka, and geant4/topas are capable of calculating beam quality correction factors in proton beams. The differences in the and factors between the codes are 0.5% at maximum. The differences in the ratios are 0.7% at maximum.
Keywords: Monte Carlo simulation; beam quality correction factors; dosimetry; high-energy photon and proton radiation; radiation therapy.
© 2019 The Authors. Medical Physics published by Wiley Periodicals, Inc. on behalf of American Association of Physicists in Medicine.
Figures
References
-
- Almond PR, Bniggs PJ, Coursey BM, Hanson WF, Huq MS, Nath R. AAPM's TG‐51 protocol for clinical reference dosimetry of high‐energy photon and electron beams. Med Phys. 1999;26:1847–1870. - PubMed
-
- Andreo P, Burns DT, Hohlfeld K, et al. Absorbed Dose Determination in External Beam Radiotherapy: An International Code of Practice for Dosimetry based on Standards of Absorbed Dose to Water. Technical Report Series TRS‐398 (International Atomic Energy Agenca, Vienna); 2000.
-
- Deutsches Institut für Normung (DIN 6800‐2) , Dosismessverfahren nach der Sondenmethode für Photonen‐ und Elektronenstrahlung ‐ Teil 2: Dosimetrie hochenergetischer Photonen‐ und Elektronenstrahlung mit Ionisationskammern. DIN 6800‐2; 2006.
-
- Vatnitsky SM, Siebers JV, Miller DW. Calorimetric determination of the absorbed dose–to–water beam quality correction factor kQ for high‐energy photon beams. Med Phys. 1995;22:1749–1752. - PubMed
-
- Medin J, Ross CK, Klassen NV, Palmans H, Grussel E, Grindborg J‐E. Experimental determination of beam quality factors, k Q, for two types of Farmer chamber in a 10 MV photon and a 175 MeV proton beam. Phys Med Biol. 2006;51:1503. - PubMed
Publication types
MeSH terms
Substances
Grants and funding
LinkOut - more resources
Full Text Sources
