. 2019 Nov:269:103250.
doi: 10.1016/j.resp.2019.103250. Epub 2019 Jul 25.

Acute lung injury in neonatal rats causes postsynaptic depression in nucleus tractus solitarii second-order neurons

Affiliations

Acute lung injury in neonatal rats causes postsynaptic depression in nucleus tractus solitarii second-order neurons

Paulina M Getsy et al. Respir Physiol Neurobiol. 2019 Nov.

Abstract

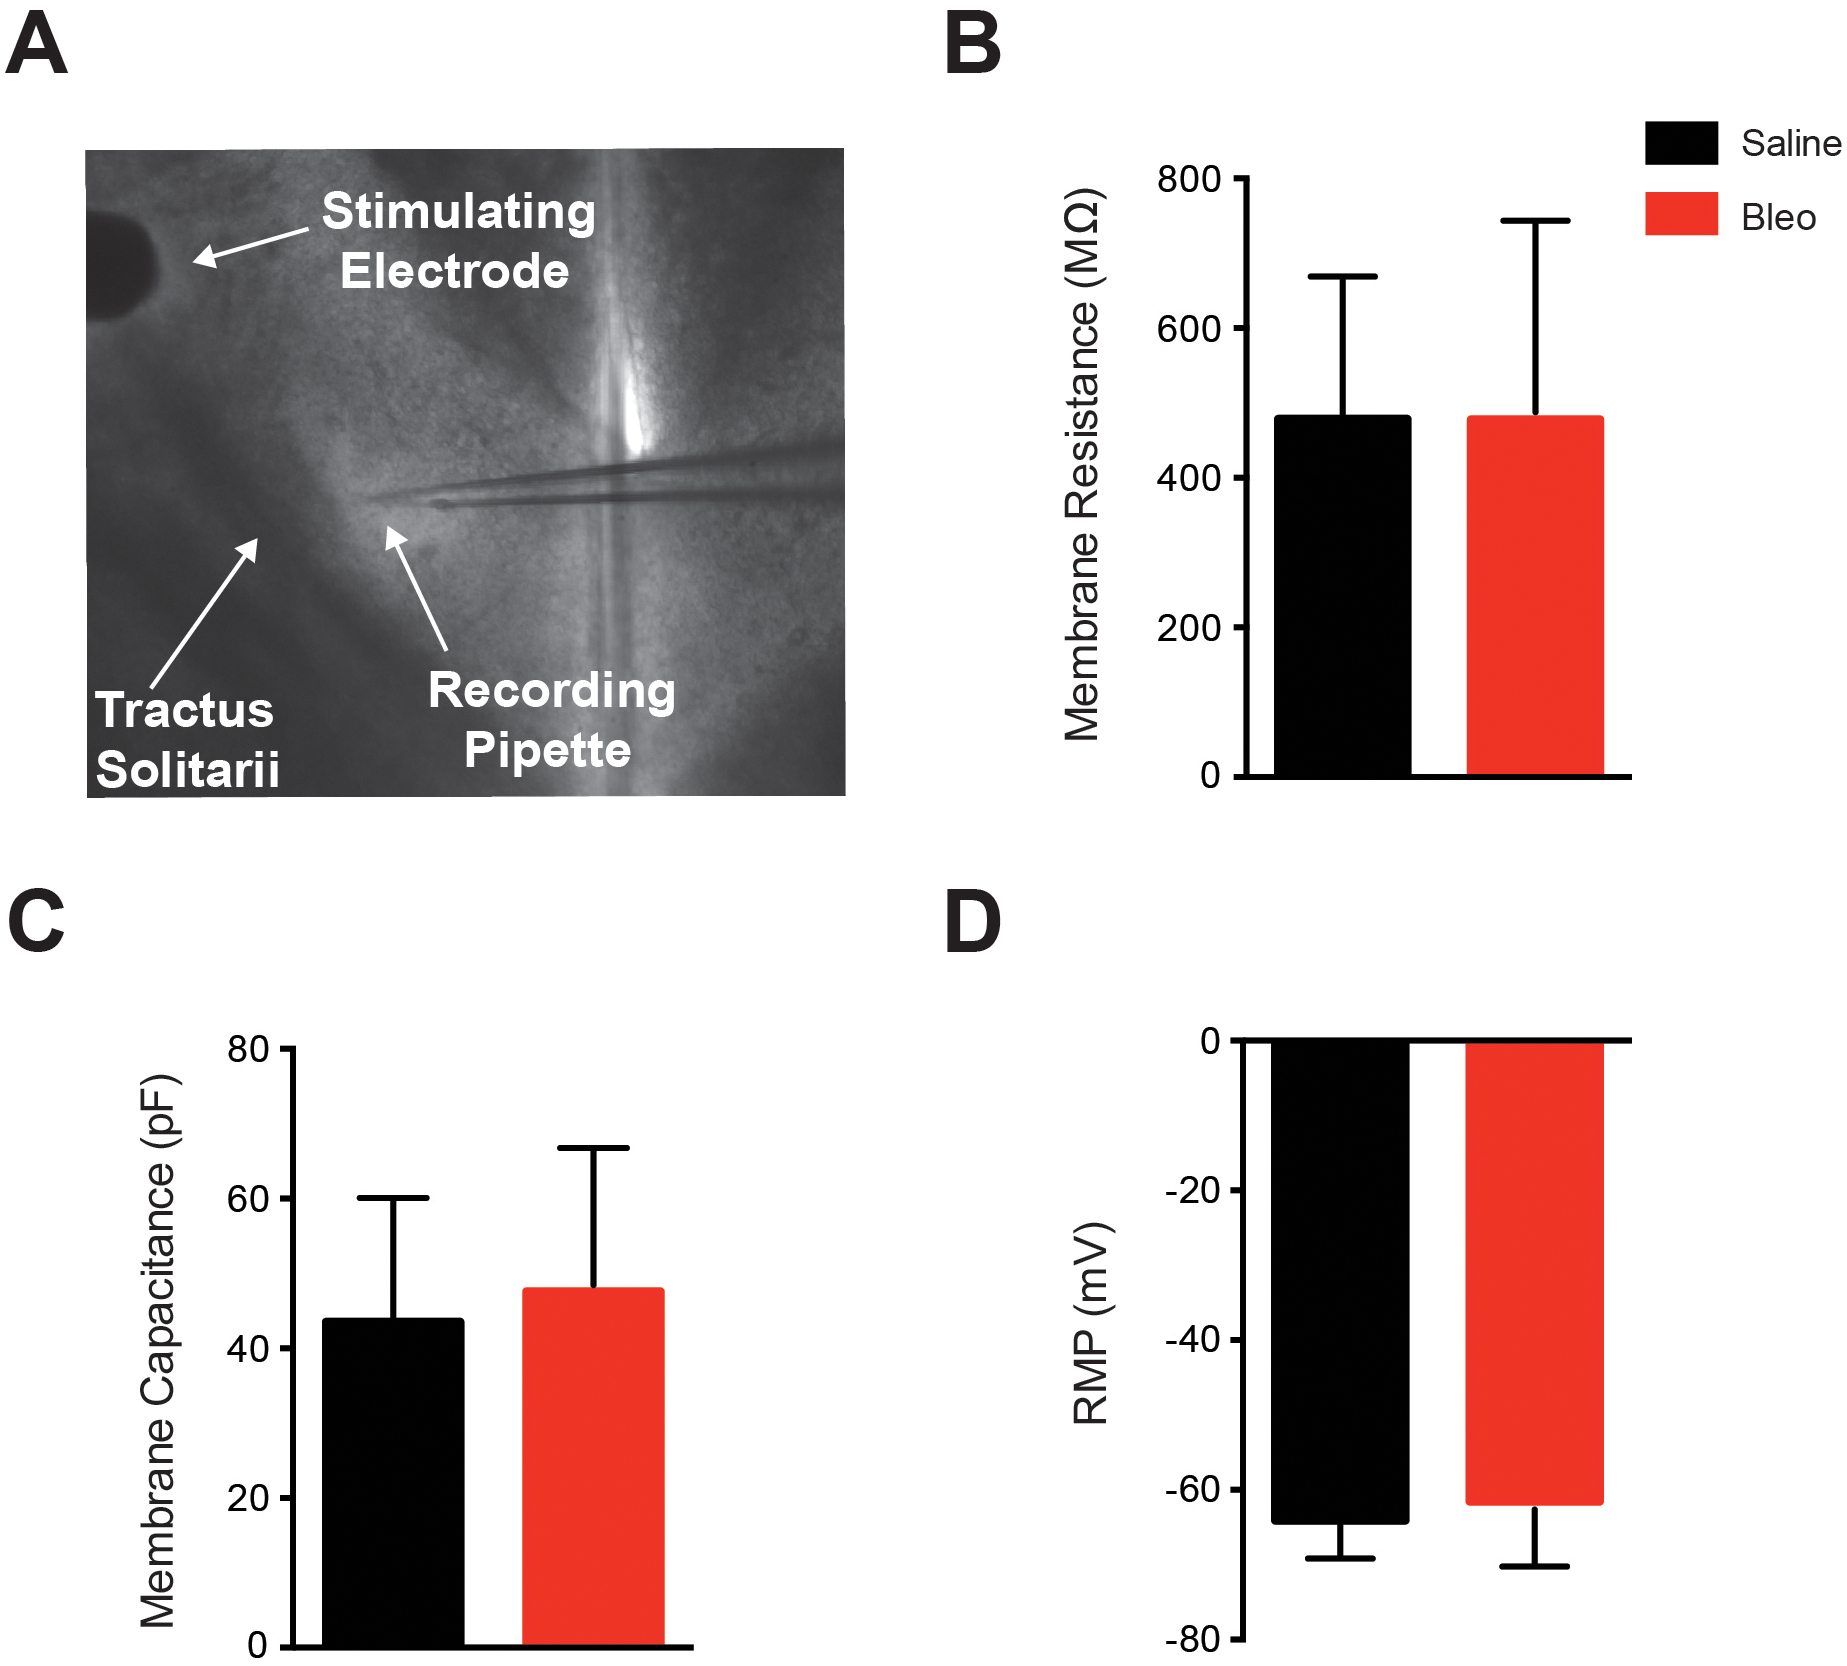
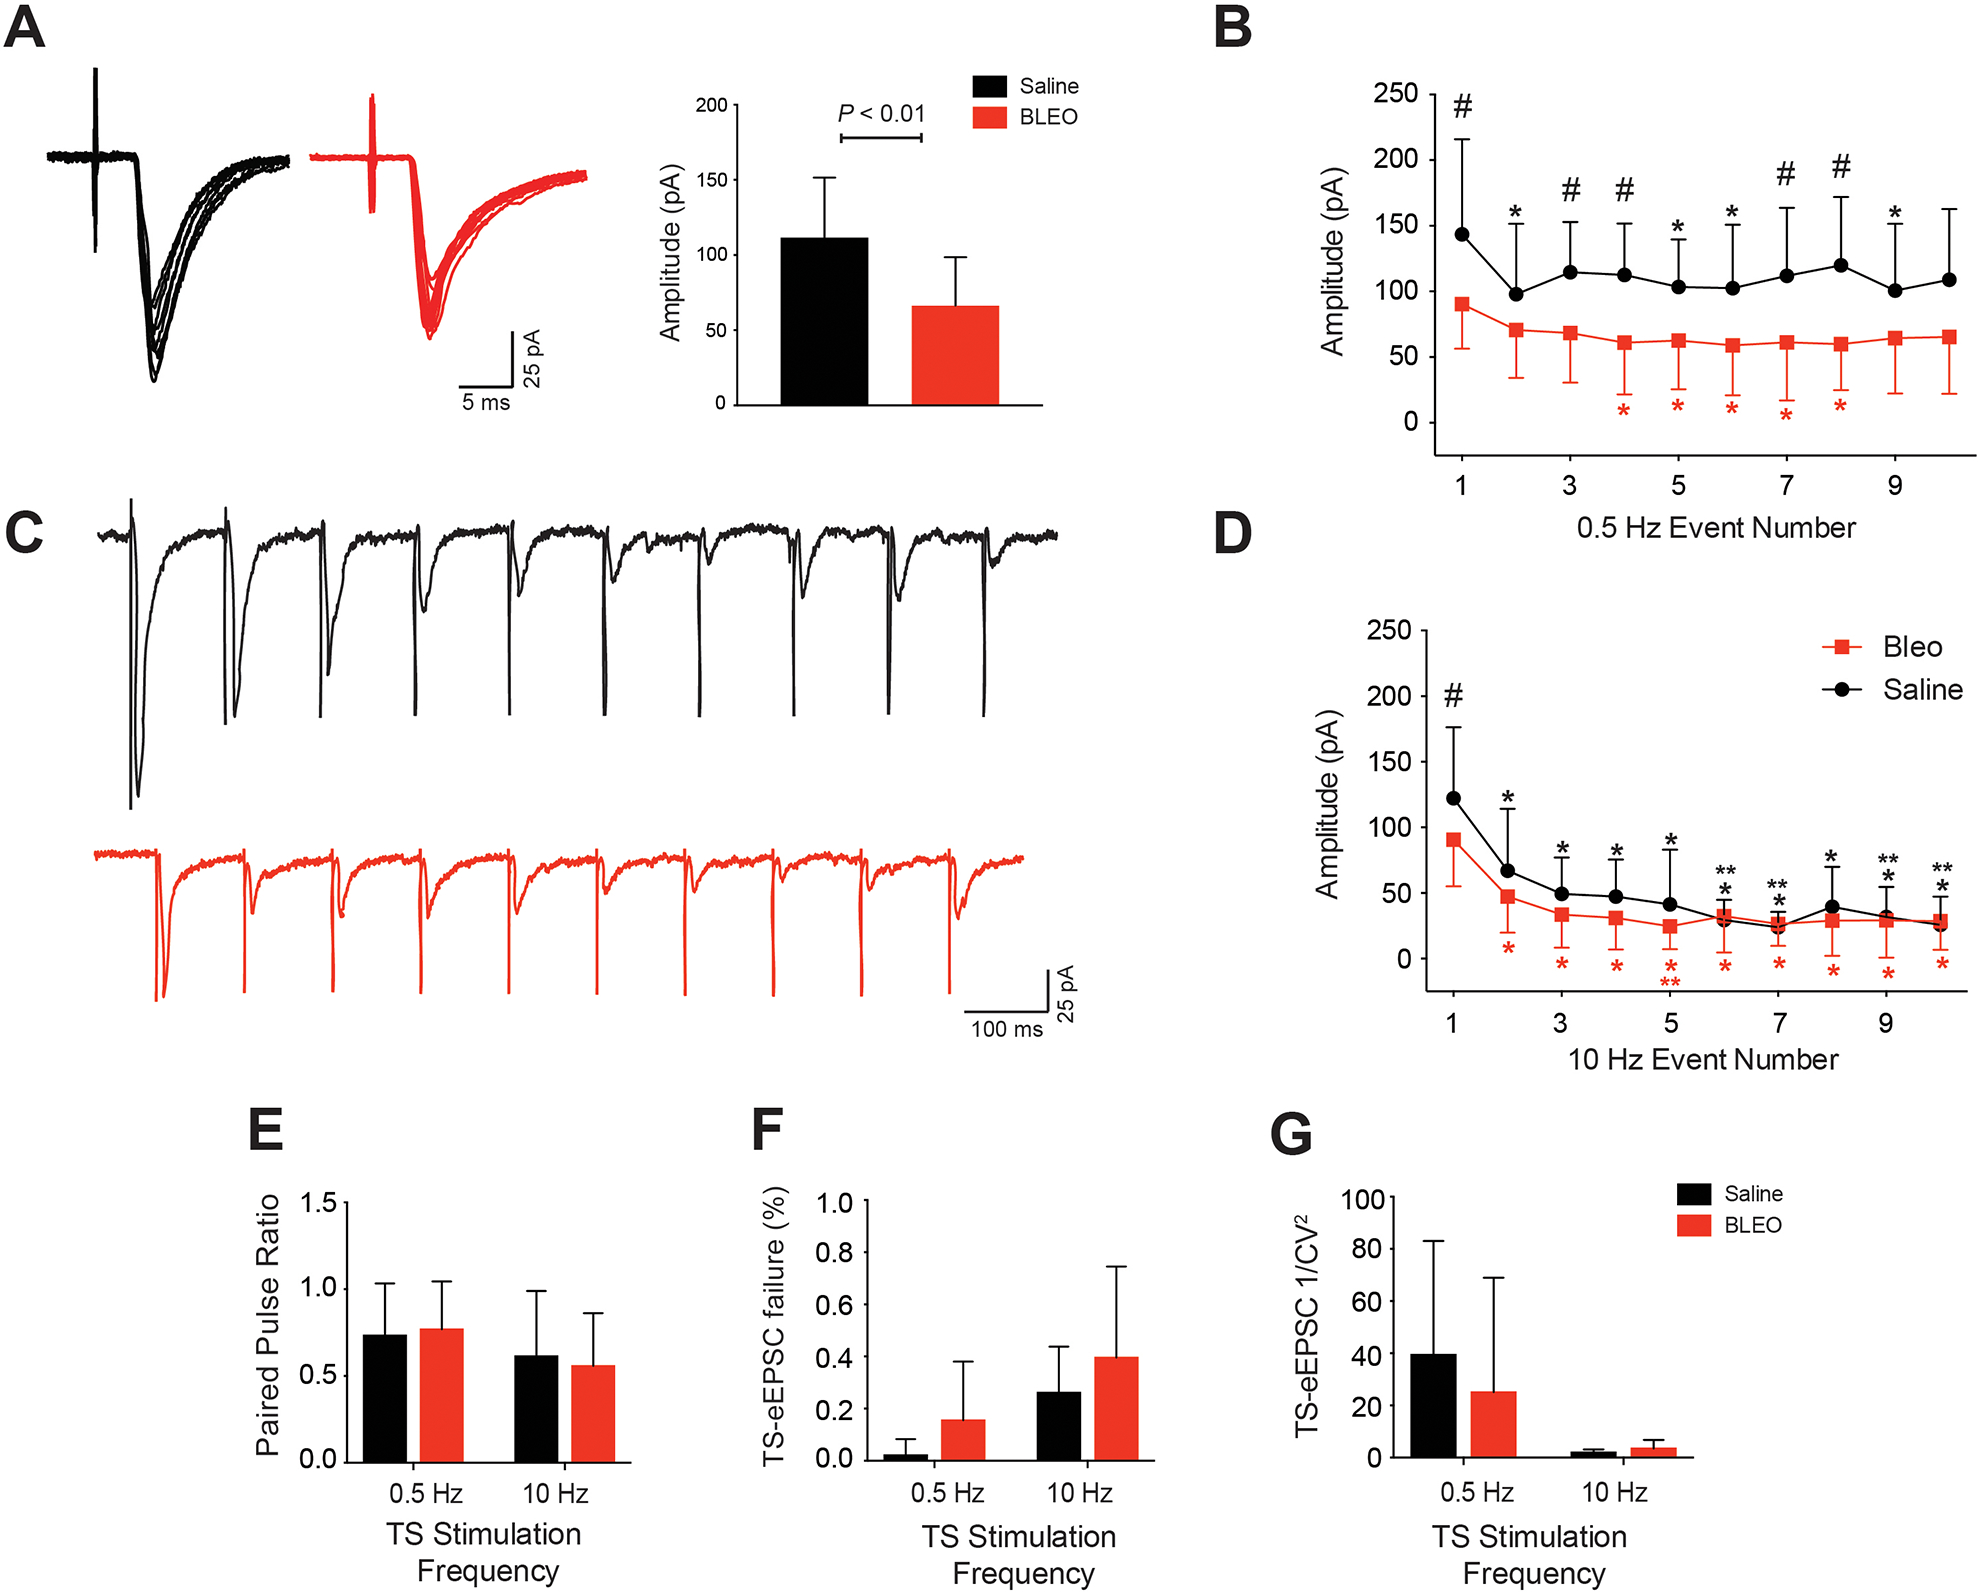
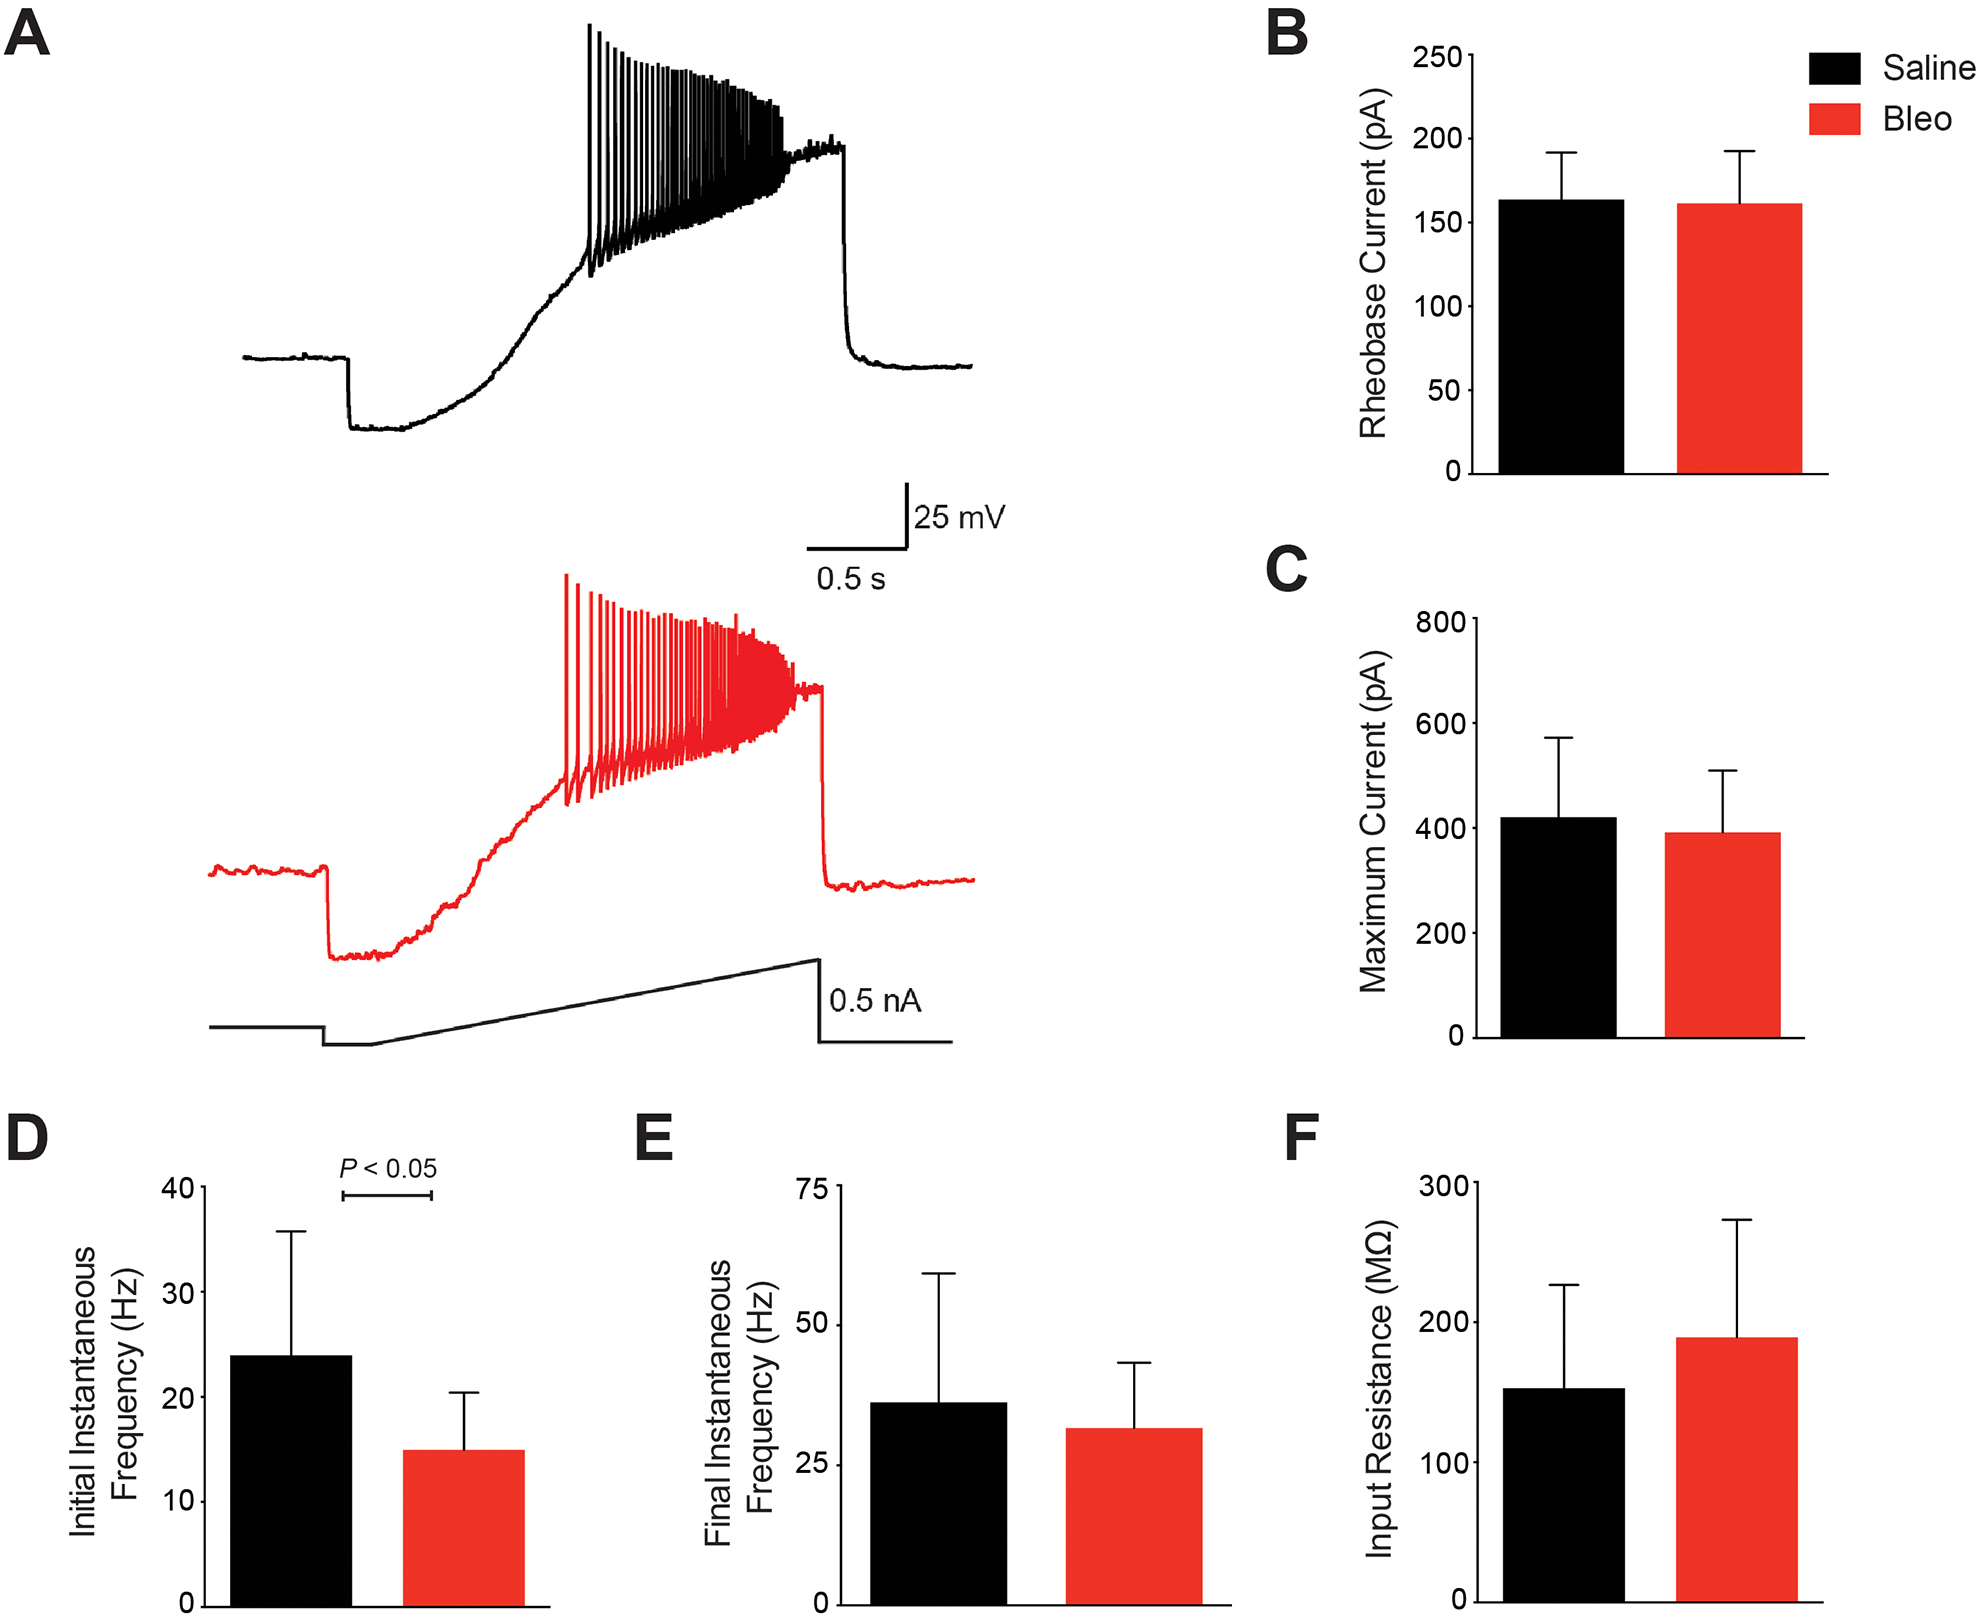
Acute Lung Injury (ALI) alters pulmonary reflex responses, in part due to changes in modulation within the lung and airway neuronal control networks. We hypothesized that synaptic efficacy of nucleus tractus solitarii (nTS) neurons, receiving input from lung, airway, and other viscerosensory afferent fibers, would decrease following ALI. Sprague Dawley neonatal rats (postnatal days 9-11) were given intratracheal installations of saline or bleomycin (a well-characterized model that reproduces the pattern of ALI) and then, one week later, in vitro slices were prepared for whole-cell and perforated whole-cell patch-clamp experiments (postnatal days 16-21). In preparations from ALI rats, 2nd-order nTS neurons had significantly decreased amplitudes of both spontaneous and miniature excitatory postsynaptic currents (sEPSCs and mEPSCs), compared to saline controls. Rise and decay times of sEPSCs were slower in whole-cell recordings from ALI animals. Similarly, the amplitude of tractus solitarii evoked EPSCs (TS-eEPSCs) were significantly lower in 2nd-order nTS neurons from ALI rats. Overall these results suggest the presence of postsynaptic depression at TS-nTS synapses receiving lung, airway, and other viscerosensory afferent tractus solitarii input after bleomycin-induced ALI.

Keywords: Acute lung injury (ALI); Nucleus tractus solitarii (nTS); Synaptic depression; Synaptic efficacy; Tractus solitariievoked excitatory postsynaptic current (TS-eEPSC).


Conflict of interest statement

Competing interests

No conflicts of interest, financial or otherwise, are declared by the authors.

Figures

Figure 1.
Figure 1.. A. Stimulating electrode placement and localized region of nTS patched. B-D. Mean passive membrane properties of 2nd-order nTS neurons 7 to 10 days after intratracheal installation of bleomycin.
Data presented in this figure was collected from whole cell patched 2nd-order nTS neurons. A. Representative photo of the 300 μM horizontal slice with the nylon harp placed on the outer edge. The stimulating electrode was gently positioned upon the darkly striated tractus solitarii distal to the site of recording. The caudal area of the medial nTS can be seen at the tip of the recording pipette, and was visualized with DIC at 5x, and a whole cell patch was made. B-D. Membrane resistance (B), membrane capacitance (C) and resting membrane potential (RMP) (D) were recorded in Bleo (n=12 neurons, 12 slices, 12 rats) and saline (n=14 neurons, 14 slices, 14 rats) treated rats to determine whether acute lung injury altered the passive membrane properties of 2nd-order nTS neurons. Mean data shows that 7–10 days following bleomycin-induced lung injury there was no significant difference in the membrane resistance (P=0.10), membrane capacitance (P=0.55) or resting membrane potential (P=0.34) between saline and Bleo groups. Data is represented as mean ± standard deviation.
Figure 2.
Figure 2.. Amplitude is significantly decreased, and rise and decay times are significantly slower in spontaneous EPSCs following acute lung injury.
Data presented in this figure was collected from whole cell patched 2nd-order nTS neurons. A. Representative trace from saline and Bleo treated 2nd-order nTS neurons showing sEPSCs over the course of a 30 second epoch. B-E. Cumulative probability plots with inset bar graphs representing mean data ± standard deviation for sEPSC amplitude (B), rise time (C), decay time (D), and interevent interval (frequency) (E) in 2nd-order nTS neurons from Bleo and saline groups. There was a significant decrease (P=0.04) in sEPSC amplitude (B) between Bleo and saline neurons that was reflected in a leftward shift in the cumulative probability plot. There was also a significant increase (P<0.01) in sEPSC rise time (C) that was reflected in a rightward shift in the cumulative probability plot, and a significant increase (P=0.03) in sEPSC decay time (D) that was reflected in a rightward shift of the cumulative probability plot. The frequency (E) of spontaneous sEPSCs was not significantly different (P=0.39) between Bleo and saline groups. Bleo group (n=12 neurons, 12 slices, 12 rats); saline group (n=14 neurons, 14 slices, 14 rats). Cumulative probability plots represent all cells patched from Bleo and saline treated rats. F. Representative trace overlaying a single sEPSC from a saline and Bleo 2nd-order nTS neuron.
Figure 3.
Figure 3.. Amplitude is significantly decreased in miniature EPSCs following acute lung injury.
Data presented in this figure was collected from whole cell patched 2nd-order nTS neurons. A. Representative trace from saline and Bleo treated 2nd-order nTS neurons showing mEPSCs over the course of a 30 second epoch. B-E. Cumulative probability plots with inset bar graphs representing mean data ± standard deviation. (B) The amplitude of mEPSCs was significantly decreased (P=0.03) in Bleo compared to saline treated rats (see inset), which was reflected in a leftward shift in the cumulative probability plot. A trend towards slower rise time (P=0.08) (C) and decay time (P=0.09) (D) of mEPSCs in Bleo compared to saline groups, but differences did not reach statistical significance. (E) There was no significant difference in the frequency of mEPSCs between Bleo and saline 2nd-order neurons (P=0.65). Bleo group (n=12 neurons, 12 slices, 12 rats); saline group (n=14 neurons, 14 slices, 14 rats). Cumulative probability plots represent all cells patched from Bleo and saline treated rats. F. Representative trace overlaying a single mEPSC from a saline and Bleo 2nd-order nTS neuron.
Figure 4.
Figure 4.. Amplitude of TS-eEPSCs is significantly attenuated in rats 7 to 10 days after intratracheal installation of bleomycin at 0.5 Hz TS stimulation.
Data presented in this figure was collected from perforated whole cell patched 2nd-order nTS neurons. A. Representative traces overlaying 0.5 Hz stimulation events from Bleo (Red) and saline (Black) treated groups. Group mean amplitude of TS-eEPSCs events in Bleo treated rats (n=22 neurons, 15 slices, 15 rats) was significantly attenuated at 0.5 Hz TS stimulation compared to saline (n=10 neurons, 8 slices, 8 rats, P<0.01). B. The mean amplitude of 10 consecutive events stimulated at 0.5 Hz were significantly decreased in 5 out of 10 events in Bleo compared to saline (Symbol #: P<0.05 between Bleo and saline events 1, 3, 4, 7, and 8, n=22 for Bleo, n=10 for saline). Within the saline treated group, the mean amplitudes of the 2nd, 5th, 6th, and 9th events were significantly decreased compared to event 1 (Symbol *: P<0.05). Within the Bleo treated group, the mean amplitudes of the 4th, 5th, 6th, 7th, and 8th events were significantly decreased compared to event 1 (Symbol *: P<0.05). C. Representative traces depicting ten consecutive individual events from saline (Black) and Bleo (Red) at 10 Hz TS-stimulation. D. The mean amplitude of 10 consecutive events stimulated at 10 Hz was significantly decreased at event 1 in Bleo compared to saline (Symbol #: P<0.01 between Bleo and saline event 1, n=22 for Bleo, n=10 for saline). Within the saline treated group, the mean amplitudes of the 2nd, 3rd, 4th, 5th, 6th, 7th, 8th, 9th and 10th events was significantly decreased compared to event 1 (Symbol *: P<0.05). Also within the saline group, the mean amplitudes of the 6th, 7th, 9th, and 10th events were significantly decreased compared to event 2 (Symbol **: P<0.05). Within the Bleo treated group, the mean amplitudes of the 2nd, 3rd, 4th, 5th, 6th, 7th, 8th, 9th, and 10th events were significantly decreased compared to event 1 (Symbol *: P<0.05). Also within the Bleo group, the mean amplitude of the 5th event was significantly decreased compared to event 2 (Symbol **: P<0.05) E. Saline and Bleo treated rats showed no significant difference in paired pulse depression (EPSC2/EPSC1) at the 0.5 Hz (saline n=10 neurons and Bleo n=22 neurons P=0.74) and 10 Hz (saline n=10 neurons and Bleo n=22 neurons P=0.65) stimulation frequencies. F. Saline and Bleo treated rats showed no significant difference in TS-eEPSC failure rates at 0.5 Hz (saline n=10 neurons and Bleo n=22 neurons P=0.08) and 10 Hz (saline n=10 neurons and Bleo n=22 neurons P=0.26) stimulation frequencies. G. Saline and Bleo treated rats showed no significant difference in 1/CV2, a measure of EPSC variability, at 0.5 Hz (saline n=10 neurons and Bleo n=22 neurons P=0.40) and 10 Hz (saline n=10 neurons and Bleo n=22 neurons P=0.16) TS stimulation.
Figure 5.
Figure 5.. Acute lung injury does not alter the intrinsic excitability of perforated whole cell patched 2nd-order nTS neurons.
A. Representative F–I traces from perforated whole cell patched 2nd-order nTS neurons in saline (Black) and Bleo (Red) showing action potentials in response to increasing current until depolarization block is reached. B-E. (B) There was no significant difference in the rheobase current (P=0.85), which is the minimal current required to generate an action potential, between Bleo and saline treated groups. (C) There was also no significant difference in the maximum current required to produce a depolarization block, thereby terminating action potential generation (P=0.57). (D) There was a significant different in the action potential firing frequency at the rheobase current (P<0.05) between Bleo and saline treated rats. (E) However there was no significant different in the maximum current (P=0.47) between Bleo and saline treated rats. (F) There was no significant difference in the input resistance between Bleo and saline treated rats (P=0.23). Bleo treated group had n=21 neurons, 15 slices, 15 rats, and in the saline group n=10 neurons, 8 slices, 8 rats. Data presented as mean ± standard deviation.

Similar articles

Cited by

References

    1. Accorsi-Mendonça D, Castania JA, Bonagamba LGH, Machado BH, Leão RM, 2011. Synaptic profile of nucleus tractus solitarius neurons involved with the peripheral chemoreflex pathways. Neuroscience 197, 107–120. doi:10.1016/j.neuroscience.2011.08.054 - DOI - PubMed
    1. Almado CEL, Machado BH, Leão RM, 2012. Chronic intermittent hypoxia depresses afferent neurotransmission in NTS neurons by a reduction in the number of active synapses. J. Neurosci 32, 16736–46. doi:10.1523/JNEUROSCI.2654-12.2012 - DOI - PMC - PubMed
    1. Babin AL, Cannet C, Gérard C, Wyss D, Page CP, Beckmann N, 2011. Noninvasive assessment of bleomycin-induced lung injury and the effects of short-term glucocorticosteroid treatment in rats using MRI. J. Magn. Reson. Imaging 33, 603–614. doi:10.1002/jmri.22476 - DOI - PubMed
    1. Bekkers JM, Clements JD, 1999. Quantal amplitude and quantal variance of strontium-induced asynchronous EPSCs in rat dentate granule neurons. J. Physiol 516 (Pt 1, 227–248. doi:10.1111/j.1469-7793.1999.227aa.x - DOI - PMC - PubMed
    1. Bonham AC, Chen C-Y, Sekizawa S-I, Joad JP, 2006. Plasticity in the nucleus tractus solitarius and its influence on lung and airway reflexes. J. Appl. Physiol 101, 322–7. doi:10.1152/japplphysiol.00143.2006 - DOI - PubMed

Publication types