Review
. 2019 Sep 16;374(1781):20180046.
doi: 10.1098/rstb.2018.0046. Epub 2019 Jul 29.

Behavioural valuation of landscapes using movement data

Affiliations
Review

Behavioural valuation of landscapes using movement data

George Wittemyer et al. Philos Trans R Soc Lond B Biol Sci. .

Abstract

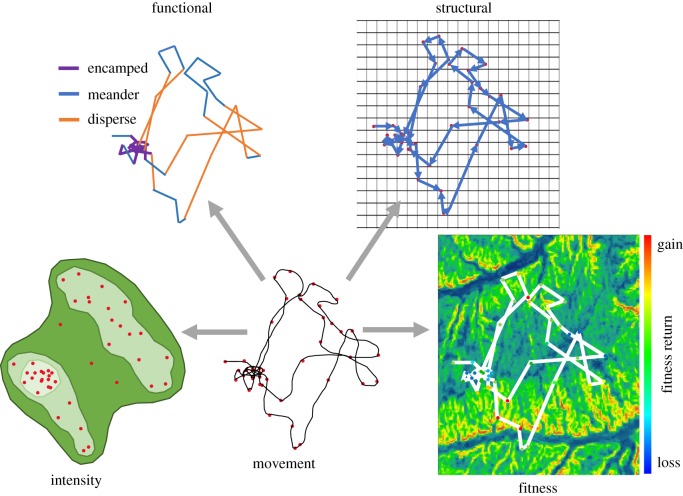
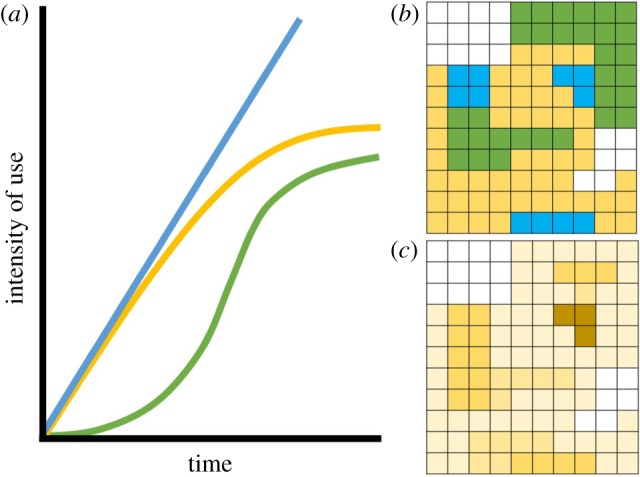
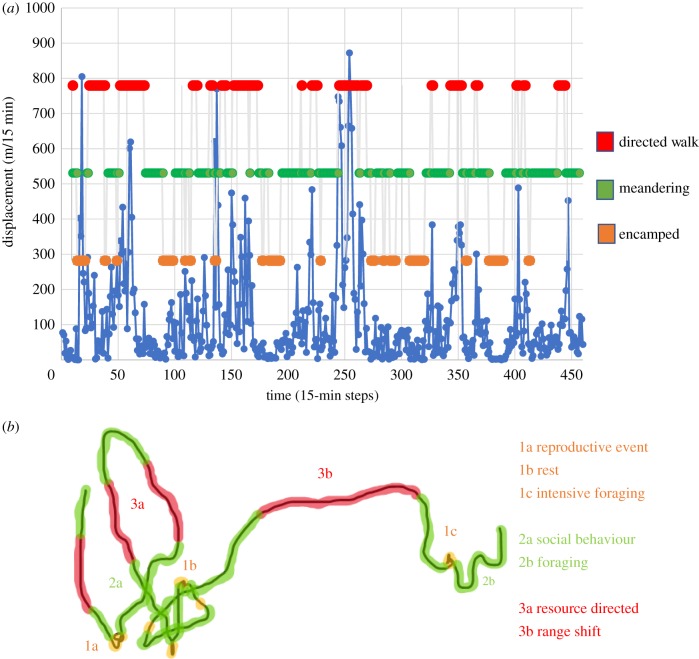
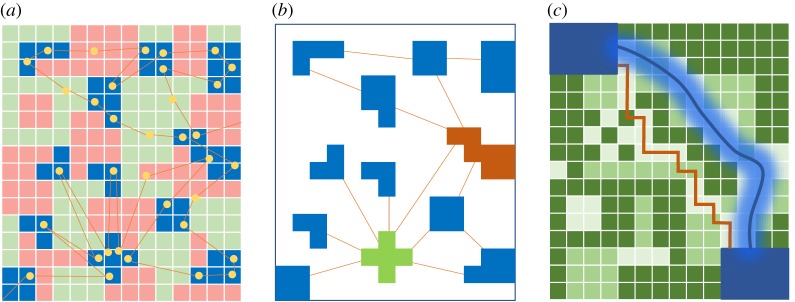
Wildlife tracking is one of the most frequently employed approaches to monitor and study wildlife populations. To date, the application of tracking data to applied objectives has focused largely on the intensity of use by an animal in a location or the type of habitat. While this has provided valuable insights and advanced spatial wildlife management, such interpretation of tracking data does not capture the complexity of spatio-temporal processes inherent to animal behaviour and represented in the movement path. Here, we discuss current and emerging approaches to estimate the behavioural value of spatial locations using movement data, focusing on the nexus of conservation behaviour and movement ecology that can amplify the application of animal tracking research to contemporary conservation challenges. We highlight the importance of applying behavioural ecological approaches to the analysis of tracking data and discuss the utility of comparative approaches, optimization theory and economic valuation to gain understanding of movement strategies and gauge population-level processes. First, we discuss innovations in the most fundamental movement-based valuation of landscapes, the intensity of use of a location, namely dissecting temporal dynamics in and means by which to weight the intensity of use. We then expand our discussion to three less common currencies for behavioural valuation of landscapes, namely the assessment of the functional (i.e. what an individual is doing at a location), structural (i.e. how a location relates to use of the broader landscape) and fitness (i.e. the return from using a location) value of a location. Strengthening the behavioural theoretical underpinnings of movement ecology research promises to provide a deeper, mechanistic understanding of animal movement that can lead to unprecedented insights into the interaction between landscapes and animal behaviour and advance the application of movement research to conservation challenges. This article is part of the theme issue 'Linking behaviour to dynamics of populations and communities: application of novel approaches in behavioural ecology to conservation'.

Keywords: biologging; home range; landscape conservation; migration; optimization; resource selection.


Conflict of interest statement

We declare we have no competing interests.

Figures

Figure 1.
Figure 1.
The movement path of an animal, sampled periodically using GPS telemetry, offers rich information on animal behaviour. To facilitate greater use of these data, we outline four approaches to estimate the behavioural value of spatial locations based on movement data. These approaches include the assessment of the intensity of use (e.g. density isopleths), functional use (e.g. movement states), structural aspects of use (e.g. network graphs) and fitness values of locations (e.g. energetic maps) as detailed in table 1.
Figure 2.
Figure 2.
(a) Mirroring functional response in predator foraging behaviour relative to prey density, the intensity of use of specific locations can be assessed in terms of differential temporal patterns. Type I use indicates a consistently used location, such as a den site or water point in an arid environment (blue). Type II use indicates a location where use saturates, such as at point resources that experience denudation with increased use (yellow). Type III use indicates temporally sporadic use, such as seasonal resources that are available intermittently and are denuded quickly (green). (b) Plotting different functional use types on the landscape can elucidate differences in the intensity of use patterns. (c) Contrasting with raw intensity of use data (darker indicates more use) can discern not only how much an area is used, but also the structure in temporal use patterns.
Figure 3.
Figure 3.
Discretizing the movement path of an individual can elucidate structure in movement behaviour. (a) Plotting the step lengths shows heterogeneity in speed often equated to different behavioural functions of the animal's motion (blue line). Similarly, heterogeneity in turning angle captures aspects of the behavioural function of the animal's movement (not shown). Using approaches to identify probabilistic-based movement states allows the simplification of the movement into specific categories of motion (e.g. directed walks characterized by high speed and little change in bearing (red), meandering characterized by slower speed and less direction (green), and encamped characterized by short to no displacement and little directional persistence (orange)). (b) Overlaying the state definition of the movement path helps elucidate structure in the movement path. Relating these defined states to observed behaviour can resolve the function of the movements.
Figure 4.
Figure 4.
Structural valuation is based on the importance of a location for the broader landscape context. (a) An animal's movement crosses over different resources on the landscape. (b) Discretizing a landscape into patches (using resource patches or movement properties) can be used to portray the landscape as a matrix. Quantifying connections among patches can be used to derive network metrics—the green patch has a high degree centrality value (key landscape hub) and the orange patch has a high betweenness centrality value (key bottleneck in the network). (c) Resistance surface maps evaluate the cost for animal movement with the darker green representing a higher cost. Optimization approaches highlight different features of the landscape, here portrayed by the orange line representing the movement corridor linking the two blue patches based on a least-cost path approach and the blue line represents an estimation of a likely corridor estimated based on the circuit theory.
Figure 5.
Figure 5.
Deriving a fitness landscape from combined movement and landscape data can be achieved using two general approaches. In the upper pathway, individual animals are collared (a) and ancillary information (e.g. body condition) is collected. The data provide movement paths (b) that can be coupled with information on the metabolic costs of movement (c) to produce estimates of the location-specific energetic cost for the animal (d), a proxy of the fitness landscape. In the lower pathway (e), ancillary (e.g. remote sensing) or modelled movement data are used to create landscape-level layers of fitness components (e.g. predation risk, forage availability, energy expenditure and thermal cover). Aggregation of these layers provides a more comprehensive estimate of the fitness landscape.

References

    1. Lima SL, Zollner PA. 1996. Towards a behavioral ecology of ecological landscapes. Trends Ecol. Evol. 11, 131–135. (10.1016/0169-5347(96)81094-9) - DOI - PubMed
    1. Turchin P. 1991. Translating foraging movements in heterogeneous environments into the spatial distribution of foragers. Ecology 72, 1253–1266. (10.2307/1941099) - DOI
    1. Bowler DE, Benton TG. 2005. Causes and consequences of animal dispersal strategies: relating individual behaviour to spatial dynamics. Biol. Rev. Camb. Philos. Soc. 80, 205–225. (10.1017/S1464793104006645) - DOI - PubMed
    1. Nathan R, Getz WM, Revilla E, Holyoak M, Kadmon R, Saltz D, Smouse PE. 2008. A movement ecology paradigm for unifying organismal movement research. Proc. Natl Acad. Sci. USA 105, 19 052–19 059. (10.1073/pnas.0800375105) - DOI - PMC - PubMed
    1. Holyoak M, Casagrandi R, Nathan R, Revilla E, Spiegel O. 2008. Trends and missing parts in the study of movement ecology. Proc. Natl Acad. Sci. USA 105, 19 060–19 065. (10.1073/pnas.0800483105) - DOI - PMC - PubMed

Publication types

LinkOut - more resources