. 2019 Oct 15;51(4):682-695.e6.
doi: 10.1016/j.immuni.2019.06.009. Epub 2019 Jul 25.

Neuropeptide CGRP Limits Group 2 Innate Lymphoid Cell Responses and Constrains Type 2 Inflammation

Affiliations

Neuropeptide CGRP Limits Group 2 Innate Lymphoid Cell Responses and Constrains Type 2 Inflammation

Hiroyuki Nagashima et al. Immunity. .

Abstract

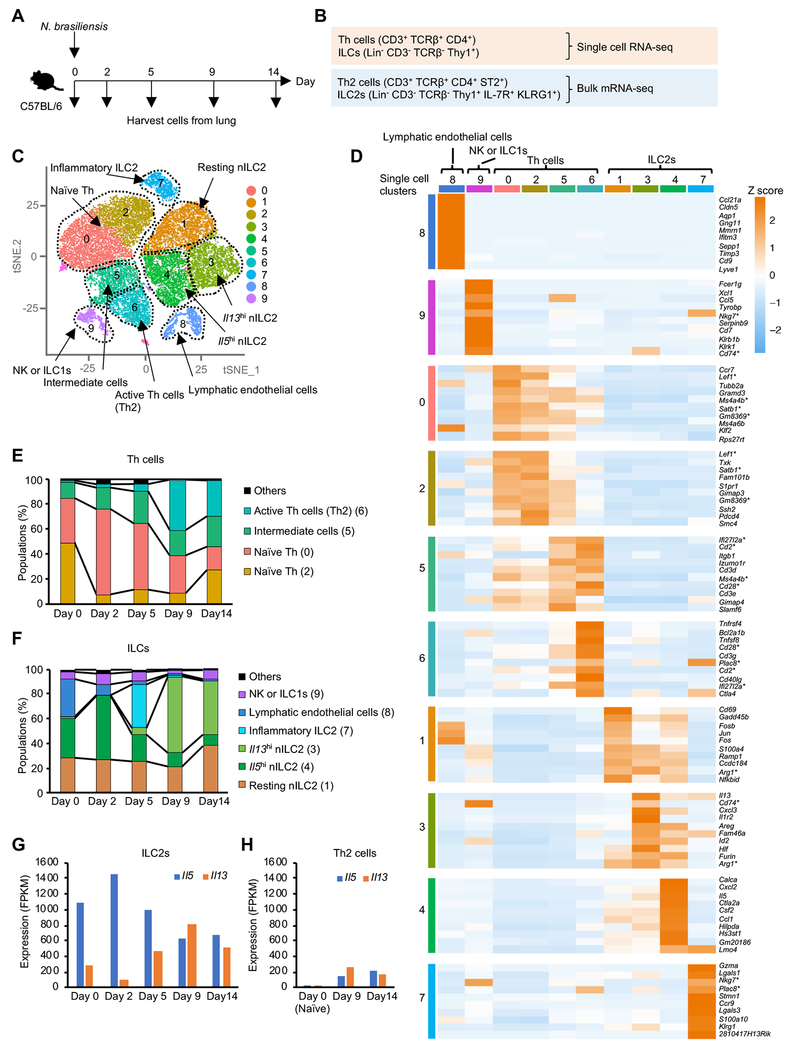
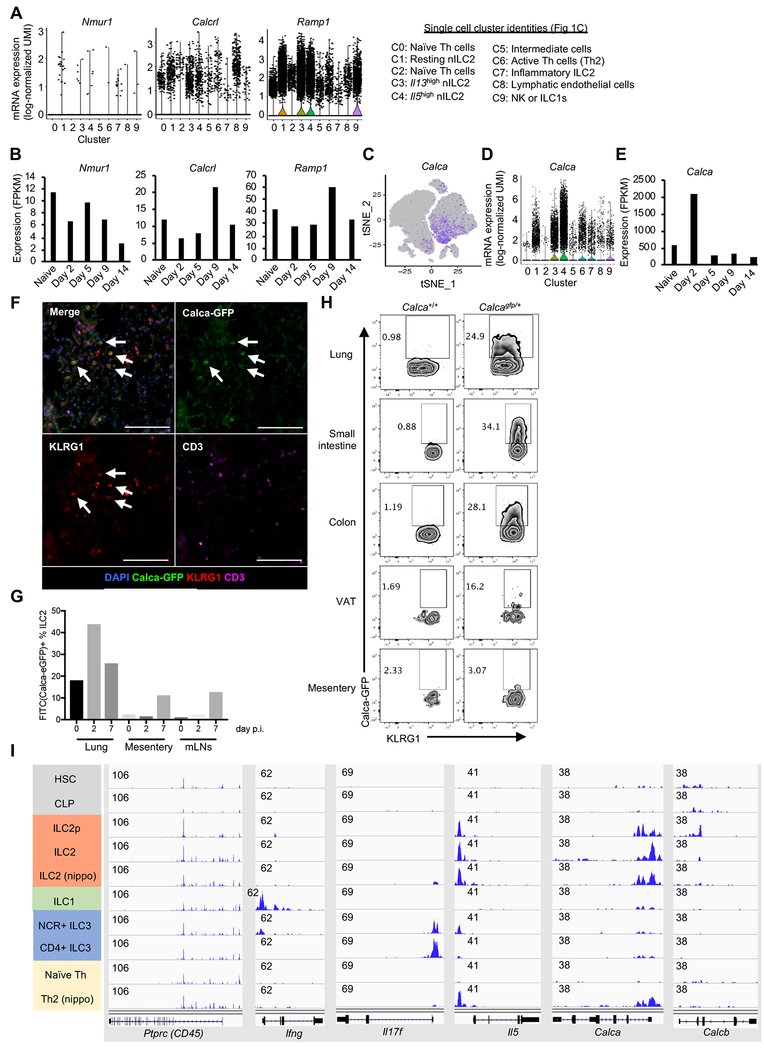
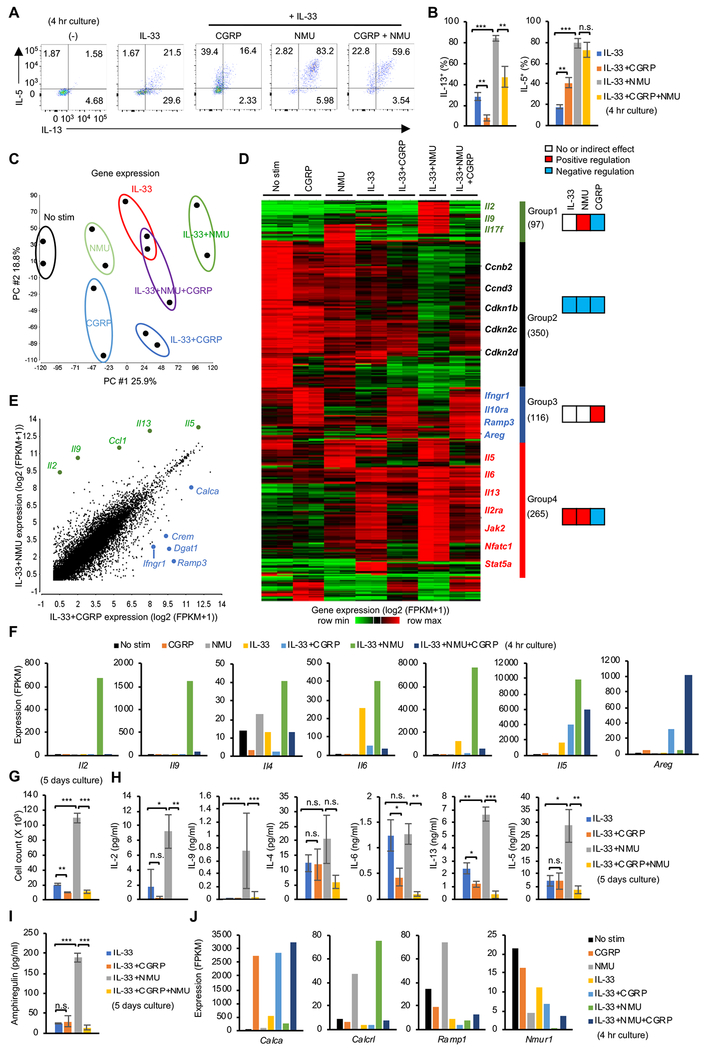
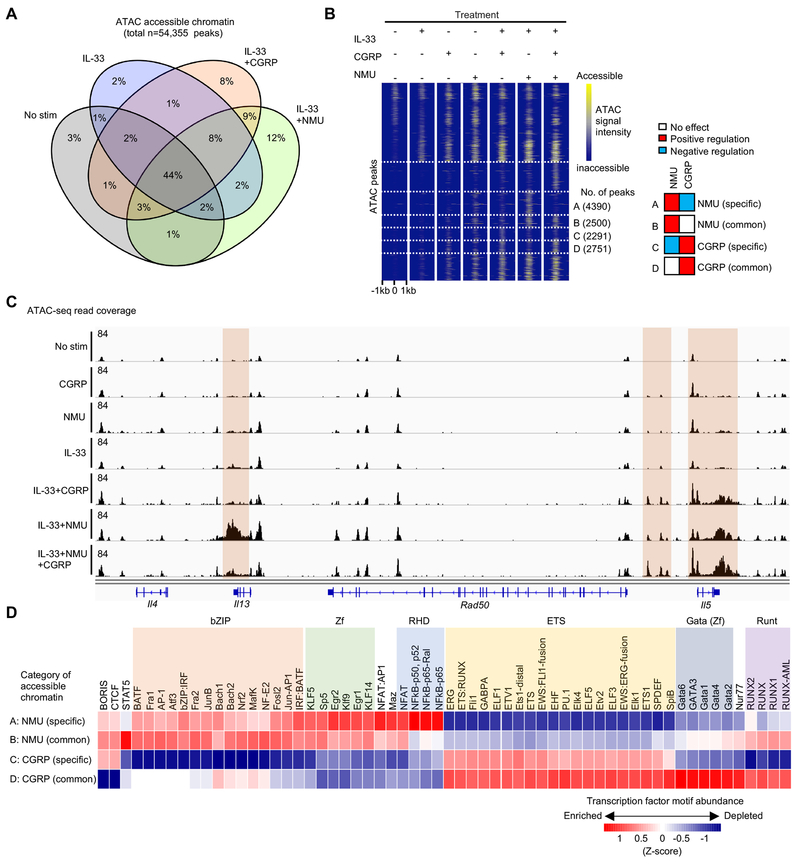
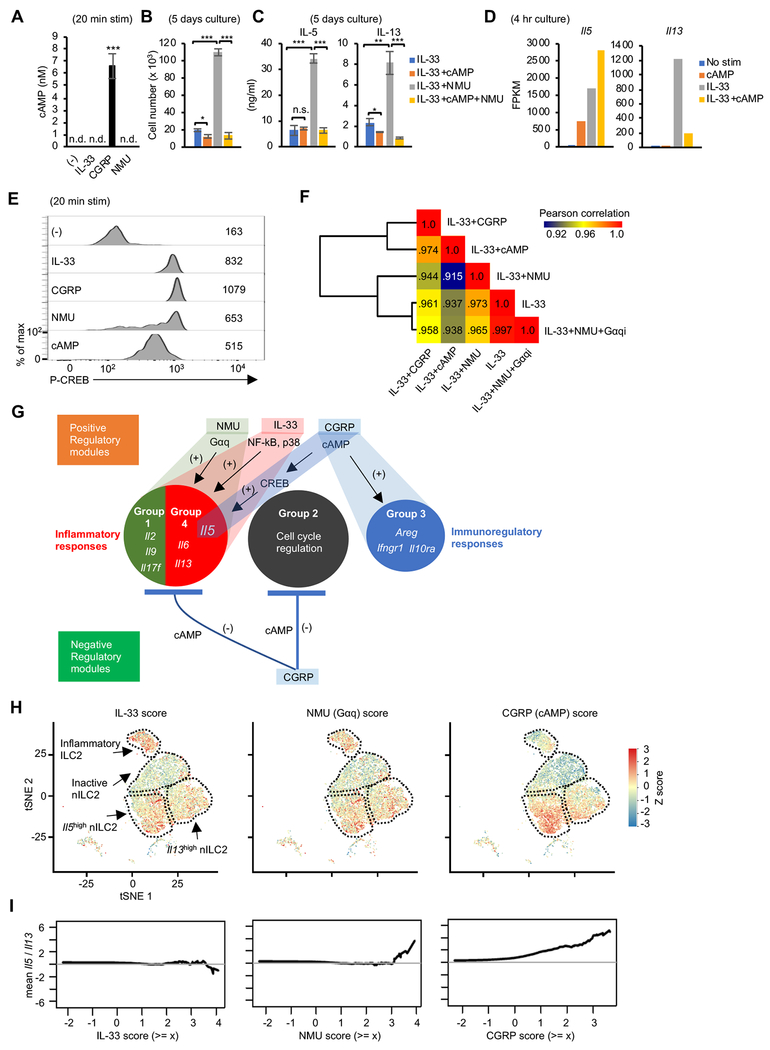
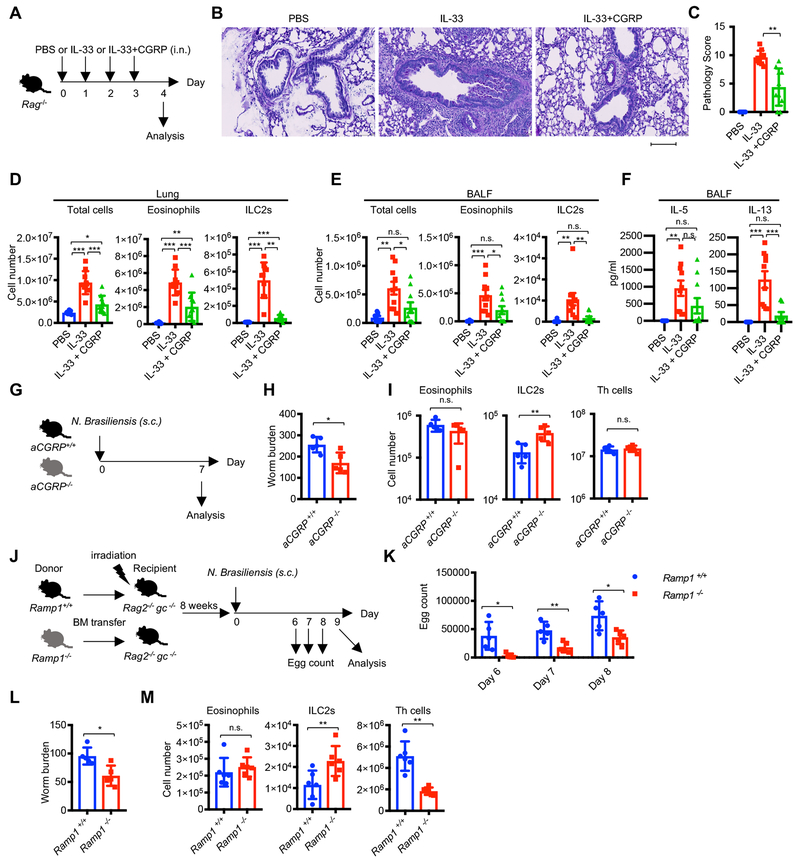
Innate lymphocytes maintain tissue homeostasis at mucosal barriers, with group 2 innate lymphoid cells (ILC2s) producing type 2 cytokines and controlling helminth infection. While the molecular understanding of ILC2 responses has advanced, the complexity of microenvironmental factors impacting ILC2s is becoming increasingly apparent. Herein, we used single-cell analysis to explore the diversity of gene expression among lung lymphocytes during helminth infection. Following infection, we identified a subset of ILC2s that preferentially expressed Il5-encoding interleukin (IL)-5, together with Calca-encoding calcitonin gene-related peptide (CGRP) and its cognate receptor components. CGRP in concert with IL-33 and neuromedin U (NMU) supported IL-5 but constrained IL-13 expression and ILC2 proliferation. Without CGRP signaling, ILC2 responses and worm expulsion were enhanced. Collectively, these data point to CGRP as a context-dependent negative regulatory factor that shapes innate lymphocyte responses to alarmins and neuropeptides during type 2 innate immune responses.

Keywords: CGRP; IL-33; NMU; Nippostrongylus brasiliensis; cytokines; host defense; immunoregulation; innate lymphoid cells; neuropeptides; single-cell RNA-seq.


Conflict of interest statement

DECLARATION OF INTERESTS

D.A. has contributed to scientific advisory boards at MedImmune, Pfizer, FARE and the KRF.

Figures

Figure 1.
Figure 1.. Diverse populations of lung ILCs and T helper cells emerge during helminth infection
(A and B) Experimental design for single cell RNA-seq (scRNA-seq) and bulk mRNA-seq of Th cells and ILCs from lungs of N. brasiliensis infected mice. Time course of N. brasiliensis infection experiment (A) and cell markers (B) for isolating total Th cells and total ILCs for scRNA-seq, or Th2 cells and ILC2s for bulk mRNA-seq. (C) Ten gene expression clusters (#0 - 9) projected on the t-Distributed Stochastic Neighbor Embedding (tSNE) plot of the scRNA-seq libraries from mice during N. brasiliensis infection as in A. Clusters, depicted by color, were identified by Seurat based on gene expression profiles in an unbiased manner, with manually labelling inferred cluster “identities”. For additional details, see Figure S1E–J. (D) Gene expression heatmap showing unbiased generation of top 10 differentially expressed genes for each cluster. Genes picked for multiple clusters are marked with asterisk. (E and F) Proportion of each cluster in the scRNA-seq library of Th cells (E) or ILCs (F) during the course of infection (day 0 to 14). (G-H) Expression of Il5 and Il13 evaluated by bulk mRNA-seq in ILC2s (G) and naïve Th cells and Th2 cells (H) isolated as shown in B. Data are from one experiment. See also Figure S1 and table S1.
Figure 2.
Figure 2.. CGRP and its cognate receptor are induced in ILC2s during helminth infection
(A) Single-cell expression of receptors for NMU and CGRP in each cell cluster defined as in Figure 1C. (B) Kinetics of gene expression during N. brasiliensis infection in ILC2s for genes encoding receptors for NMU and CGRP using bulk mRNA-seq as in Figure 1B. (C-E) Calca expression in Th cells and ILCs using scRNA-seq (C-D) and confirmation by bulk mRNA-seq (E), as in A and B. (F) Immunohistochemical staining of lungs from Calca+/gfp mice 7 days after N. brasiliensis infection. The arrows depict ILC2s (CD3 KLRG1+) that express Calca (GFP+). The scale bar is 100 μm. (G) Calca expression in ILC2s from lung, mesentery and mesenteric LNs (mLNs) of Calca+/gfp mice before (0) and after N. brasiliensis infection (days 2 and 7). (H) Calca-driven expression of GFP in ILC2s from indicated tissues of Calca+/gfp mice, assessed by flow cytometry. (I) Accessibility of indicated loci in various cell types, as measured by ATAC-seq (data from Shih H et al. 2016: GSE77695). Data are from one experiment (A-E) or representative from three independent experiments with similar results (F-H). See also Figure S2.
Figure 3.
Figure 3.. Differential effects of CGRP and NMU on ILC2 gene expression
(A) Flow cytometric assessment of intracellular IL-5 and IL-13 expression in lung ILC2s in the absence of stimulation (−) or following stimulation with IL-33 alone, or in combination with CGRP or NMU for 4 hr with inclusion of Brefeldin A. (B) Pooled data showing percentage of IL-13 positive (left) or IL-5 positive (right) ILC2s cultured with indicated neuropeptide and/or cytokine as in A. (C) Principal component (PC) analysis of gene expression using bulk mRNA-seq of lung ILC2s cultured under the indicated 7 conditions for 4 hr. Two replicates were analyzed per condition. (D) Heatmap depicting 958 differentially expressed genes (DEG) (> 3 log2 fold change and > 10 FPKM expression in at least one sample) in samples shown in C. Four groups of genes were defined using hierarchical clustering. (E) Comparison of gene expression in ILC2s stimulated with IL-33+NMU versus IL-33+CGRP. Representative DEGs are depicted. (F) Expression of selected cytokine genes across various conditions. (G) Isolated ILC2s (5 x 10³) were cultured under the indicated culture conditions for 5 days and cell counts were recorded. (H and I) The concentration of the indicated cytokines in the supernatant from cultures as in G, assessed by Legendplex (H) or ELISA (I). (J) Transcript expression of Calca and receptors for neuropeptides across conditions, quantitated by mRNA-seq (dataset shown in Figure 3C–D). Statistical significance are depicted as *P < 0.05, **P < 0.01 and ***P < 0.001 (Student’s t-test). Data are from two (C and D) or average (E, F and J) from two independent experiments or representative (A, G, H, I) or pool (B) from three independent experiments with similar results. (Average ± SD from three experiments (B) or triplicated samples (G, H and I)). See also Figure S3 and table S2.
Figure 4.
Figure 4.. Differential effects of CGRP and NMU on ILC2 regulatory elements
(A) Venn diagram demonstrating percentages of 54,355 chromatin accessible regions identified by FastATAC-seq among ILC2s treated with or without IL-33, CGRP, and NMU for 4 hr. (B) Heatmap illustrating the chromatin accessibility among the dynamic regions shown in A, highlighting 4 categories of differentially accessible regions. Categories A and B represent NMU targeted regions that are independent (A) of, or antagonized (B) by CGRP, respectively. Categories C and D represent CGRP targeted regions that are independent (C) of or counteracted (D) by NMU, respectively. (C) Genomic track view of Th2 cytokine loci showing distinct regulation of chromatin accessibility of Il5 and Il13 loci across different conditions. (D) Heatmap showing relative enrichment of TF motifs within chromatin regions categorized in B. Data are from representative (C) of two independent experiments with similar results.
Figure 5.
Figure 5.. Signaling downstream of CGRP is mediated by cAMP to shape unique ILC2 gene expression profiles, including in vivo IL-5 expression.
(A) cAMP concentration in the cell lysates of lung ILC2s without stimulation (−) or stimulated with IL-33, CGRP or NMU (20 min) as assessed by ELISA. (B) Isolated ILC2 (5 x 10³) were cultured under the indicated conditions for 5 days after which cell counts were recorded. cAMP = Dibutyryl-cAMP (C) Concentration of cytokines in the supernatant from cultures depicted in Figure 5B, assessed by Legendplex. (D) Expression of Il5 and Il13 in lung ILC2s cultured under the indicated conditions, confirmed by bulk mRNA-seq. Two replicates were analyzed per condition. (E) Phospho-CREB (Ser133) was measured by flow cytometric analysis of lung ILC2s following the indicated stimulations for 20 min. (F) Global transcriptomic similarities between the indicated conditions was evaluated by Pearson correlations calculated based on log2 (FPKM+1) from the average of replicates. Gene expression data for IL-33, IL-33+CGRP, IL-33+NMU or IL-33+cAMP conditions are from data depicted in Figure 3C and 5D. Gαqi = Gαq inhibitor (G) Inferred transcriptional modules in ILC2s regulated by IL-33 and neuropeptides. See also Figure S5A–B. (H) Single cell scores of representative transcriptional modules (IL-33, NMU, CGRP) in ILC2s from mice with N. brasiliensis infection as in Figure 1A. The gene modules were generated using bulk RNA-seq data from ILC2s treated with IL-33, NMU, or CGRP compared to unstimulated cells. IL-33, NMU, and CGRP module scores were projected onto separate tSNE representations of ILCs (from Figure 1C). Scores are comparable within a module across timepoints, but not across modules. (I) The ratio of Il5 to Il13 abundance (log-space) in all cells is shown as a function of module score thresholds. Statistical significance are depicted as *P < 0.05, **P < 0.01 and ***P < 0.001 (Student’s t-test). Data are representative (AC) from three independent experiments or representative (E) from two independent experiments with similar results. (Average ± SD from triplicated well in AC). See also Figure S4–S5 and Table S3.
Figure 6.
Figure 6.. CGRP is required for negatively regulating ILC2s and type 2 responses in vivo
(A-F) Effect of CGRP in IL-33-induced pulmonary inflammation. (A) Rag1−/− or Rag2−/− mice were administered PBS (n=8), IL-33 (n=10), or IL-33+CGRP (n=10) intranasally for four consecutive days, with the following analyses of lung pathology one day after the last administration: (B) Periodic acid-Schiff (PAS) staining, (C) Pathology score, (D) Cell count of total cells, eosinophils (CD11c CD11b+ Siglec-F+) and ILC2s (Lin Thy1+ CD127+ GATA3+), (E and F) Cell counts (E) and cytokine production (F) in BALF. The scale bar in B is 100 μm. (G-I) Impact of genetic deletion of CGRP on helminth infection: Experimental scheme (G) and worm count of small intestine (H) or cell numbers of eosinophils, ILC2s and Th cells (I) in mLNs from aCGRP+/+ (n=5) or aCGRP−/− (n=5) mice infected with N. brasiliensis and analyzed at day 7 post infection. (J-M) Impact of genetic deletion of CGRP receptor subunit Ramp1 in transferred hematopoietic cells following helminth infection-experimental scheme (J). Fecal egg counts (K), small intestine worm counts (L) numbers of eosinophils, ILC2s and Th cells (M) in lungs were assessed in irradiated chimeric Rag2−/− gc−/− mice reconstituted with the bone marrow from either wild-type (n=5) or Ramp1 −/− (n=5) mice infected with N. brasiliensis on day 9 post infection. Each symbol represents an individual mouse (C-F, H-I, K-M). Statistical significance is depicted as *P < 0.05, **P < 0.01 and ***P < 0.001 (Student’s t-test). Data are from representative (B, H, I) or pool (C-F) of two experiments with similar results or from one experiment (K-M). See also Figure S6.

Comment in

References

    1. Artis D, and Spits H (2015). The biology of innate lymphoid cells. Nature 517, 293–301. - PubMed
    1. Baral P, Umans BD, Li L, Wallrapp A, Bist M, Kirschbaum T, Wei Y, Zhou Y, Kuchroo VK, Burkett PR, et al. (2018). Nociceptor sensory neurons suppress neutrophil and gammadelta T cell responses in bacterial lung infections and lethal pneumonia. Nat Med 24, 417–426. - PMC - PubMed
    1. Bentley DR, Balasubramanian S, Swerdlow HP, Smith GP, Milton J, Brown CG, Hall KP, Evers DJ, Barnes CL, Bignell HR, et al. (2008). Accurate whole human genome sequencing using reversible terminator chemistry. Nature 456, 53–59. - PMC - PubMed
    1. Boudard F, and Bastide M (1991). Inhibition of mouse T-cell proliferation by CGRP and VIP: effects of these neuropeptides on IL-2 production and cAMP synthesis. J Neurosci Res 29, 29–41. - PubMed
    1. Bray NL, Pimentel H, Melsted P, and Pachter L (2016). Near-optimal probabilistic RNA-seq quantification. Nat Biotechnol 34, 525–527. - PubMed

Publication types