. 2020 Feb 14;75(3):466-472.
doi: 10.1093/gerona/glz174.

Biomarkers for Aging Identified in Cross-sectional Studies Tend to Be Non-causative

Affiliations

Biomarkers for Aging Identified in Cross-sectional Studies Tend to Be Non-causative

Paul G Nelson et al. J Gerontol A Biol Sci Med Sci. .

Abstract

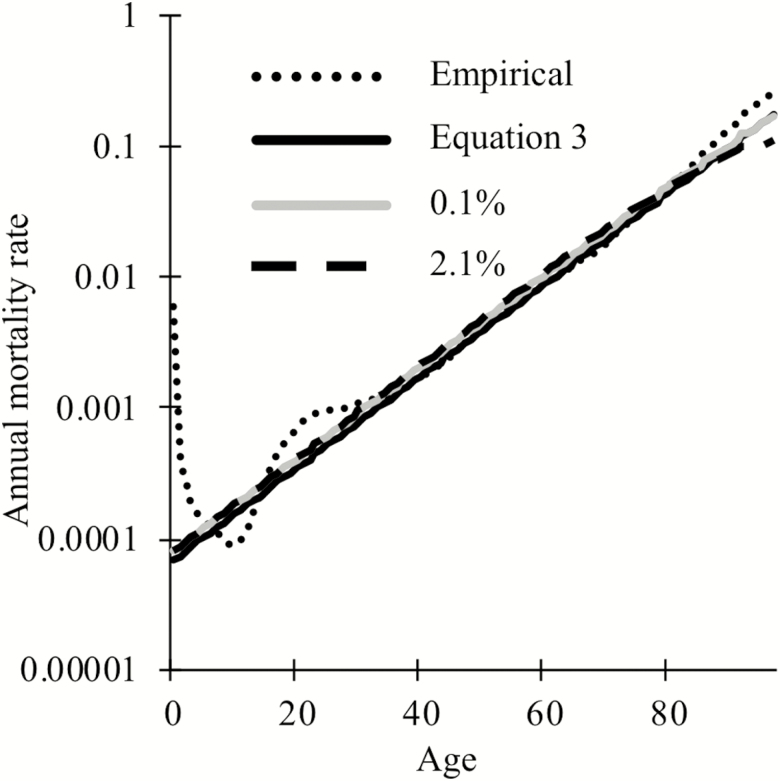
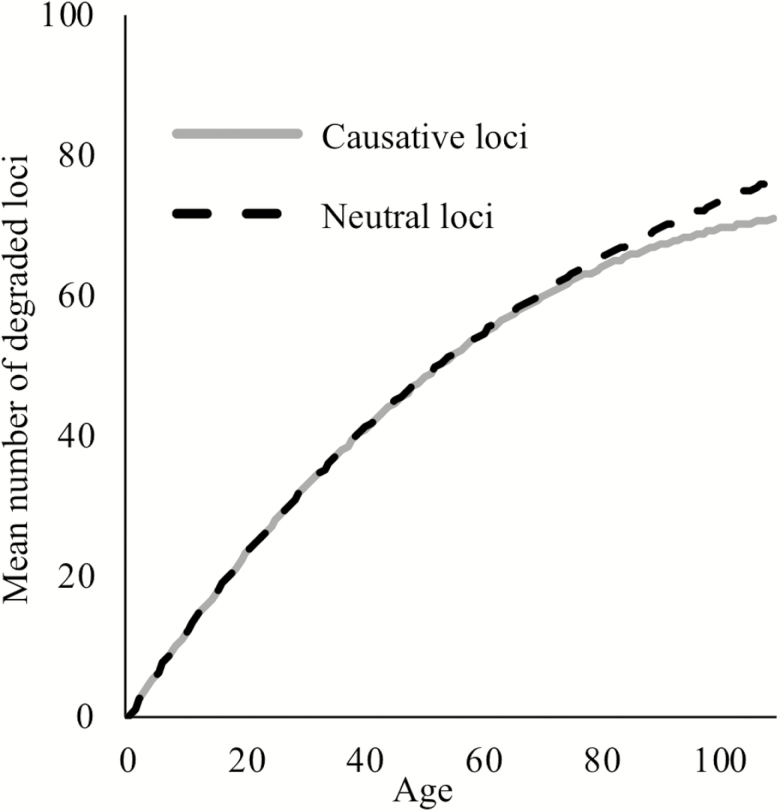
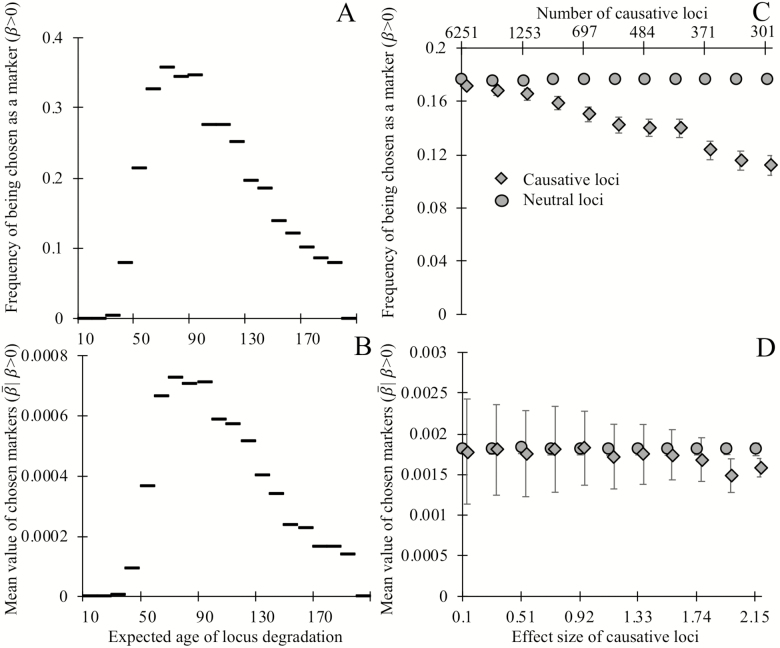
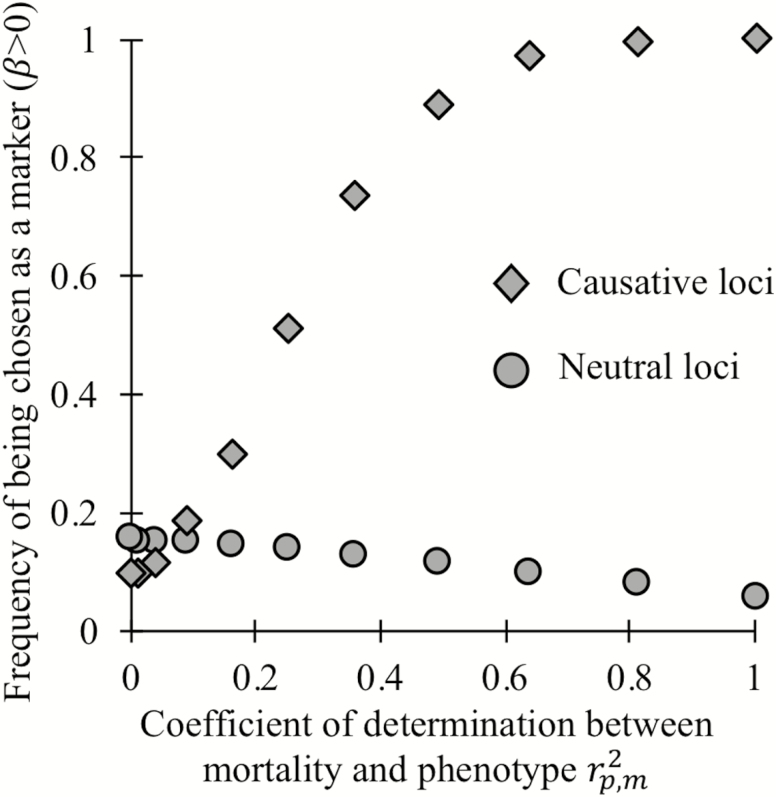
Biomarkers are important tools for diagnosis, prognosis, and identification of the causal factors of physiological conditions. Biomarkers are typically identified by correlating biological measurements with the status of a condition in a sample of subjects. Cross-sectional studies sample subjects at a single timepoint, whereas longitudinal studies follow a cohort through time. Identifying biomarkers of aging is subject to unique challenges. Individuals who age faster have intrinsically higher mortality rates and so are preferentially lost over time, in a phenomenon known as cohort selection. In this article, we use simulations to show that cohort selection biases cross-sectional analysis away from identifying causal loci of aging, to the point where cross-sectional studies are less likely to identify loci that cause aging than if loci had been chosen at random. We go on to show this bias can be corrected by incorporating correlates of mortality identified from longitudinal studies, allowing cross-sectional studies to effectively identify the causal factors of aging.

Keywords: Epigenetics; Gerontology; Longevity; Mortality; Senescence.


Figures

Figure 1.
Figure 1.
The Gompertz mortality curve (solid black) approximates the empirical estimates of human mortality (dotted black), excluding increased infant and early adult mortality (33). To include cohort selection, equation (2) was simulated for a starting population of 1,000 individuals using 20,000 loci of which 6,251 loci have an effect size of 0.1% (grey) or 301 loci have an effect size of 2.1% (dashed black).
Figure 2.
Figure 2.
The mean number of degraded loci per individual when loci cause aging (grey), or are neutral (dashed black) out of 301 total loci. We use the largest effect size shown in Figure 3, where the degradation of one causative locus results in a 2.3% increase in mortality rates in an otherwise non-degraded individual, and all loci have an expected age of degradation of 75 years.
Figure 3.
Figure 3.
Biomarkers selected on their ability to predict chronological age tend not to be causative for aging, and degrade, on average, late in life. Loci whose expected time of degradation is late in life (age 50+) are chosen as biomarkers of aging (A) more often and have larger regression coefficients (in units of degradation status/year) when chosen as biomarkers (B), than loci that degrade earlier in life (note that all loci in panels A and B are noncausative). Causative loci (diamonds) are less likely to be selected as biomarkers (C) than neutral loci in the same genome (circles). Of the loci selected as biomarkers (D), the magnitude of regression coefficients of causative loci is slightly smaller, on average, than those of neutral loci, at least when causative loci are of fairly large effect (>2%). Panels A and B show the outcome of a single simulation in which each of the 20,000 loci have expected ages of degradation 1 + 199 (i/20,000) for integers i = 0 through 20,000. All loci are neutral and mortality is determined by equation (1). Horizontal lines indicate the y-axis value corresponding to the 200 loci in each bin. A degradation time well above human lifespans indicates a locus with a low probability of degrading prior to death. Each point in panels C and D shows the mean outcomes of six independent replicate simulations in which each of the 20,000 loci are either neutral or have a single causal effect size (non-round-number effect sizes are an artifact of making choices using an alternative effect size metric). Mortality is determined by equation (2), with the numbers of causative loci (top x-axis C,D) inversely proportional to the effect size of a causal locus (bottom x-axis C,D). In panels C and D, all loci have an expected age of degradation of 75 years. Error bars show standard errors; markers for causative loci have been offset slightly to the right.
Figure 4.
Figure 4.
When phenotypes can accurately distinguish individual mortality within a cohort of the same age, regression on biological age (here an optimal function of both chronological age and phenotype) can preferentially choose loci that cause aging (diamonds) over neutral loci (circles) as biomarkers of aging. As in the rightmost markers in Figure 3C and D, here 301 loci of large effect are causative of aging.
Figure 5.
Figure 5.
The deviation between an individual’s chronological age and predicted age informs the rate of aging, as measured by the slope of the Gompertz mortality curve (A), but not the intercept of the Gompertz mortality curve (B). Mortality depends on causal biomarker loci according to equation (2). Markers were chosen by regression on chronological age in a training data set, then applied to a separate testing data set of independent but identically constructed simulations. In panel A, each individual’s rate of aging was drawn at birth from a normal distribution with mean 0.0807 and standard deviation 0.00807. The rate of aging i of individual i determines the probability of degradation ρi of that individuals’ loci, where ρ_i = 1–exp(γ_i ln (1–ρ)/0.0807) where ρ = 1/76, which gives an estimated age of degradation of 75 years as in Figure 3; all loci are nondegraded at birth. In panel B, a number of loci drawn from a Poisson distribution with mean 10,000 were degraded at birth, making the mean mortality rate at birth of individuals in the top quartile roughly 17% higher than those of the bottom quartile. To keep the mean mortality rate at birth m0 = e–10 as discussed earlier, we make a = 6.65 × 10⁻⁷; the rate of degradation of loci is constant (ρ = 1/76) across all individuals. In both panels A and B, 301 of 20,000 loci are causative of aging.

References

    1. Medawar PB. An Unsolved Problem of Biology: An Inaugural Lecture Delivered at University College, London. London: H.K. Lewis & Co; 1952.
    1. Nelson P, Masel J. Intercellular competition and the inevitability of multicellular aging. Proc Natl Acad Sci USA. 2017;114:12982–12987. doi: 10.1073/pnas.1618854114 - DOI - PMC - PubMed
    1. Moorad JA, Promislow DE, Flesness N, Miller RA. A comparative assessment of univariate longevity measures using zoological animal records. Aging Cell. 2012;11:940–948. doi: 10.1111/j.1474-9726.2012.00861.x - DOI - PMC - PubMed
    1. Margolick JB, Ferrucci L. Accelerating aging research: how can we measure the rate of biologic aging? Exp Gerontol. 2015;64:78–80. doi: 10.1016/j.exger.2015.02.009 - DOI - PMC - PubMed
    1. Wu IC, Lin CC, Hsiung CA. Emerging roles of frailty and inflammaging in risk assessment of age-related chronic diseases in older adults: the intersection between aging biology and personalized medicine. Biomedicine (Taipei). 2015;5:1. doi: 10.7603/s40681-015-0001-1 - DOI - PMC - PubMed

Publication types