. 2020 Mar;71(3):955-971.
doi: 10.1002/hep.30881. Epub 2019 Oct 18.

4-1BB Delineates Distinct Activation Status of Exhausted Tumor-Infiltrating CD8+ T Cells in Hepatocellular Carcinoma

Affiliations

4-1BB Delineates Distinct Activation Status of Exhausted Tumor-Infiltrating CD8+ T Cells in Hepatocellular Carcinoma

Hyung-Don Kim et al. Hepatology. 2020 Mar.

Abstract

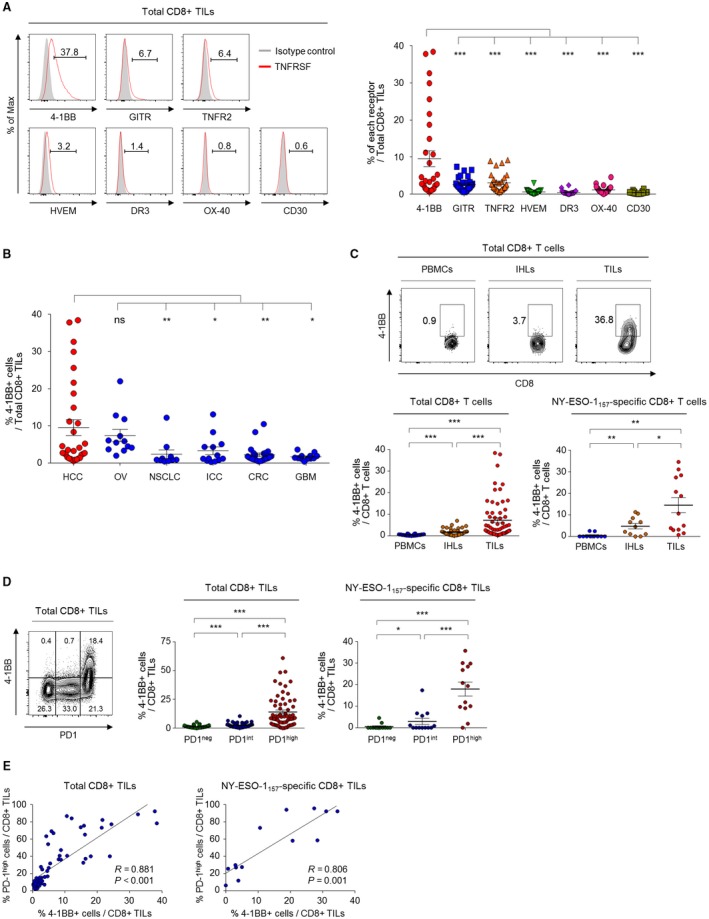
Background and aims: Targeting costimulatory receptors with agonistic antibodies is a promising cancer immunotherapy option. We aimed to investigate costimulatory receptor expression, particularly 4-1BB (CD137 or tumor necrosis factor receptor superfamily member 9), on tumor-infiltrating CD8+ T cells (CD8+ tumor-infiltrating lymphocytes [TILs]) and its association with distinct T-cell activation features among exhausted CD8+ TILs in hepatocellular carcinoma (HCC).

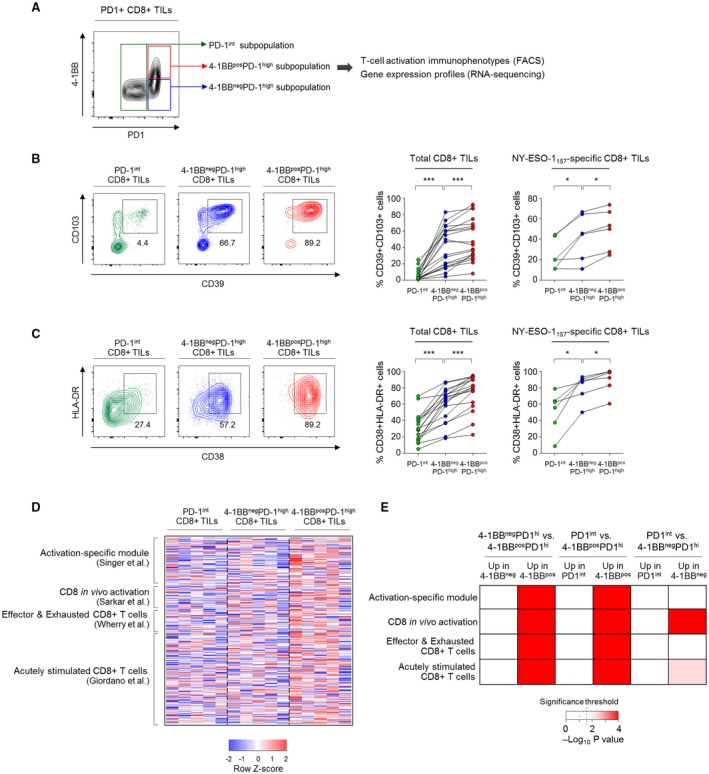
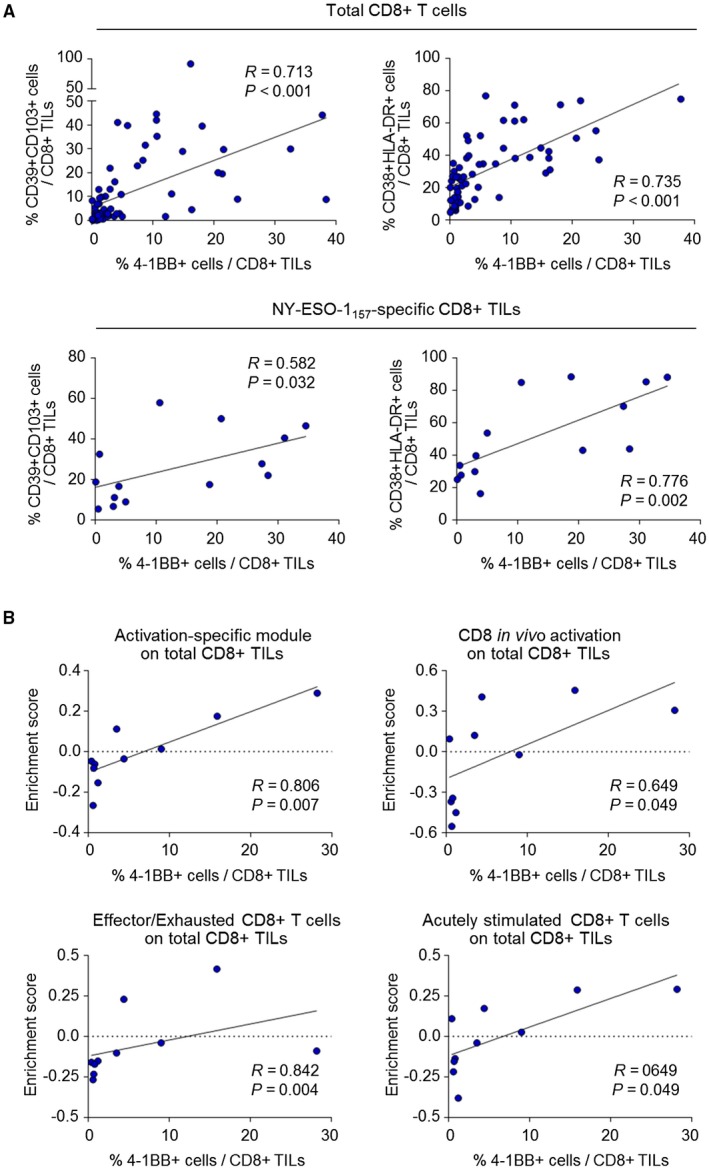
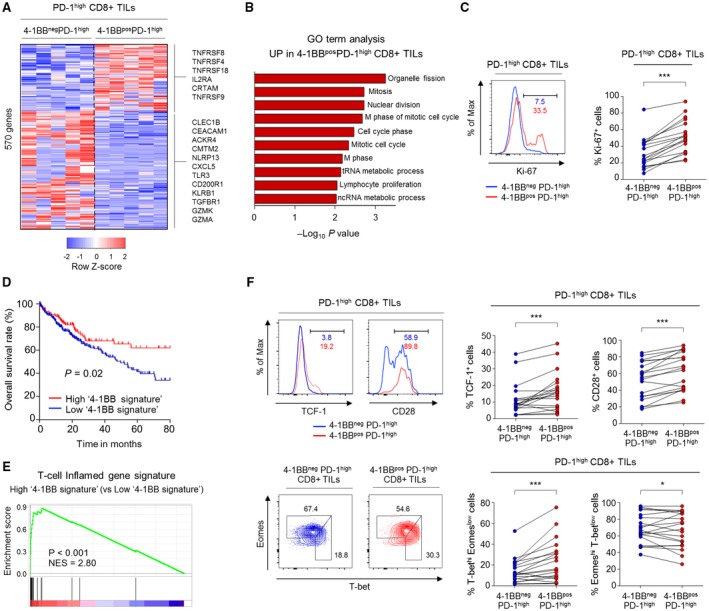
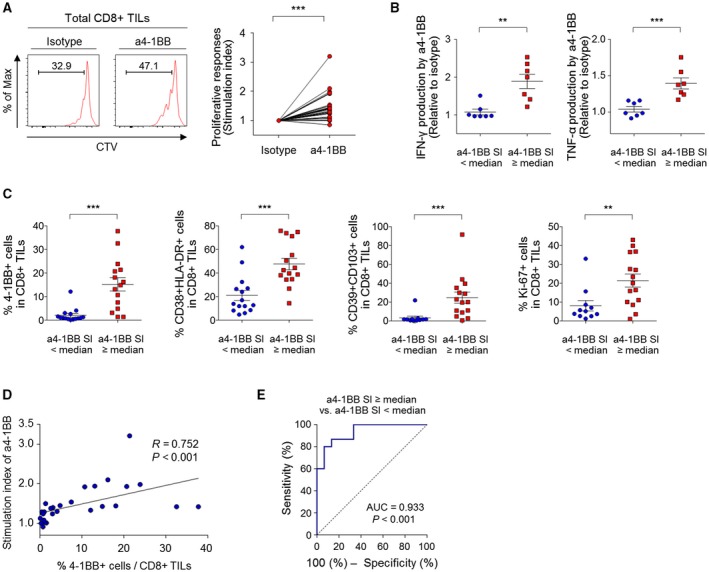
Approach and results: Tumor tissues, adjacent nontumor tissues, and peripheral blood were collected from HCC patients undergoing surgical resection (n = 79). Lymphocytes were isolated and used for multicolor flow cytometry, RNA-sequencing, and in vitro functional restoration assays. Among the examined costimulatory receptors, 4-1BB was most prominently expressed on CD8+ TILs. 4-1BB expression was almost exclusively detected on CD8+ T cells in the tumor-especially on programmed death 1 (PD-1)high cells and not PD-1int and PD-1neg cells. Compared to PD-1int and 4-1BBneg PD-1high CD8+ TILs, 4-1BBpos PD-1high CD8+ TILs exhibited higher levels of tumor reactivity and T-cell activation markers and significant enrichment for T-cell activation gene signatures. Per-patient analysis revealed positive correlations between percentages of 4-1BBpos cells among CD8+ TILs and levels of parameters of tumor reactivity and T-cell activation. Among highly exhausted PD-1high CD8+ TILs, 4-1BBpos cells harbored higher proportions of cells with proliferative and reinvigoration potential. Our 4-1BB-related gene signature predicted survival outcomes of HCC patients in the The Cancer Genome Atlas cohort. 4-1BB agonistic antibodies enhanced the function of CD8+ TILs and further enhanced the anti-PD-1-mediated reinvigoration of CD8+ TILs, especially in cases showing high levels of T-cell activation.

Conclusion: 4-1BB expression on CD8+ TILs represents a distinct activation state among highly exhausted CD8+ T cells in HCC. 4-1BB costimulation with agonistic antibodies may be a promising strategy for treating HCCs exhibiting prominent T-cell activation.


Figures

Figure 1
Figure 1
Compared to other costimulatory receptors, 4‐1BB is more prominently expressed on CD8+ TILs, especially on PD‐1high cells. (A) The percentage of CD8+ TILs that expressed various activation‐induced costimulatory receptors belonging to the TNFRSF. Left panel shows representative flow cytometry histograms. (B) Percentages of 4‐1BBpos CD8+ TILs in various cancer types: OV, ovarian cancer; NSCLC, non‐small‐cell lung cancer; ICC, intrahepatic cholangiocellular carcinoma; CRC, colorectal cancer; and GBM, glioblastoma multiforme. (C) 4‐1BB expression pattern across different CD8+ T‐cell fractions. The percentage of 4‐1BBpos cells was compared among the different T‐cell fractions of total and NY‐ESO‐1157‐165–specific CD8+ T cells. Left panel shows representative flow cytometry plots. (D) 4‐1BB expression according to differential PD‐1 expression levels. The percentage of 4‐1BBpos cells was compared among PD‐1high, PD‐1int and PD‐1neg subpopulations of total and NY‐ESO‐1157‐165–specific CD8+ TILs. (E) Correlations between the percentage of 4‐1BBpos CD8+ TILs and PD‐1high CD8+ TILs among the total CD8+ TILs and NY‐ESO‐1157–specific CD8+ TILs. Upper panel shows representative flow cytometry plots. Data are presented as mean ± SEM. *P < 0.05; **P < 0.01; ***P < 0.001. Abbreviation: ns, not significant.
Figure 2
Figure 2
4‐1BB–expressing PD‐1high CD8+ TILs feature immunophenotypically and transcriptionally prominent T‐cell activation. (A) Representative flow cytometry plot showing subpopulations of PD‐1+ CD8+ TILs according to differential expression of PD‐1 and 4‐1BB. (B,C) Percentages of CD39+CD103+ cells (B) and CD38+HLA‐DR+ cells (C) among the PD‐1int, 4‐1BBnegPD‐1high, and 4‐1BBposPD‐1high subpopulations of total and NY‐ESO‐1157–specific CD8+ TILs. Left panels show representative flow cytometry plots (B,C). (D,E) RNA‐seq data comparing expression of genes related to T‐cell activation among FACS‐sorted PD‐1int, 4‐1BBnegPD‐1high and 4‐1BBposPD‐1high CD8+ TILs. (D) Heatmap showing expression levels of T‐cell activation gene signatures among the PD‐1int, 4‐1BBnegPD‐1high, and 4‐1BBposPD‐1high subpopulations. (E) Relative enrichment of T‐cell activation gene signatures among PD‐1int, 4‐1BBnegPD‐1high, and 4‐1BBposPD‐1high CD8+ TILs. Dashed line marks the significance threshold (P = 0.05). *P < 0.05; ***P < 0.001.
Figure 3
Figure 3
The percentage of 4‐1BBposCD8+ TILs is positively correlated with the degree of overall activation of CD8+ TILs. (A) Correlations between the percentage of 4‐1BBpos CD8+ TILs and the percentages of CD39+CD103+ cells and CD38+HLA‐DR+ cells, among total CD8+ TILs (left panel) and NY‐ESO‐1157‐165–specific CD8+ TILs (right panel). (B) RNA‐seq data from sorted total CD8+ TILs, analyzing the expression levels of T‐cell activation gene signatures, represented as the enrichment score obtained by GSVA. Correlations between the percentage of 4‐1BBpos CD8+ TILs and enrichment scores of T‐cell activation gene signatures were subsequently analyzed.
Figure 4
Figure 4
4‐1BBposPD‐1high CD8+ TILs exhibited higher levels of markers indicating T‐cell proliferation and reinvigoration compared to 4‐1BBnegPD‐1high CD8+ TILs. (A) Heatmap showing expression levels of 569 DEGs between 4‐1BBnegPD‐1high and 4‐1BBposPD‐1high CD8+ TILs. (B) Gene Ontology analysis for the DEGs that were up‐regulated in 4‐1BBposPD‐1high CD8+ TILs compared to in 4‐1BBnegPD‐1high CD8+ TILs. (C) Percentage of Ki‐67+ cells compared between 4‐1BBposPD‐1high and 4‐1BBnegPD‐1high CD8+ TILs. Left panel shows representative flow cytometry plot. (D) Kaplan‐Meier curve comparing survival outcomes among subgroups (i.e., high and low 4‐1BB signature groups) of HCC patients in the TCGA cohort, according to expression of the 4‐1BB signature. Cutoff was determined by the maximal chi‐square method. (E) GSEA was performed to compare the enrichment of a T‐cell–inflamed gene signature between the high and low 4‐1BB signature groups. (F) Expression levels of parameters involved in T‐cell reinvigoration (i.e., TCF‐1, CD28, and T‐bet/Eomes) were compared between 4‐1BBposPD‐1high and 4‐1BBnegPD‐1high CD8+ TILs. Left panel shows representative flow cytometry plots. *P < 0.05; ***P < 0.001. Abbreviations: ACKR4, atypical chemokine receptor 4; CEACAM1, carcinoembryonic antigen‐related cell adhesion molecule 1; CLEC1B, C‐type lectin domain family 1 member B; CMTM2, CKLF‐like MARVEL transmembrane domain‐containing 2; CXCL5, C‐X‐C motif chemokine ligand 5; Eomes, eomesodermin; GO, Gene Ontology; GZMA, granzyme 1, cytotoxic T‐lymphocyte–associated serine esterase 3; GZMK, granzyme K (serine protease, granzyme 3; tryptase II); IL2RA, interleukin‐2 receptor agonist; KLRB1, killer cell lectin‐like receptor B1; Max, maximum; ncRNA, noncoding RNA; NES, normalized enrichment score; NLRP13, NOD‐like receptor family pyrin domain containing 13; T‐bet, T‐box–containing protein expressed in T cells; TGFBR1, transforming growth factor beta receptor 1; tRNA, total RNA.
Figure 5
Figure 5
4‐1BB costimulation enhances the function of CD8+ TILs, especially in HCCs exhibiting prominent T‐cell activation. (A) Investigation of the effect of 4‐1BB costimulation on the proliferative response of CD8+ TILs, as indicated by SI. (B,C,E) Study patients were subdivided into two subgroups using the median SI by anti–4‐1BB as the cutoff. (B) Comparison between the two subgroups of the relative increases of IFN‐γ and TNF‐α production by CD8+ TILs with 4‐1BB costimulation. (C) Comparison between the two subgroups of the percentages of 4‐1BB+, CD39+CD103+, CD38+HLA‐DR+, and Ki‐67+ cells among CD8+ TILs. (D) Correlation between the percentage of 4‐1BBpos CD8+ TILs and the SI by 4‐1BB costimulation. (E) Receiver operating characteristic curve estimating the performance of the percentages of 4‐1BBpos CD8+ TILs with regard to distinguishing the two subgroups. Data are presented as mean ± SEM. (B,C) ** P < 0.01; ***P < 0.001. Abbreviation: Max, maximum.
Figure 6
Figure 6
4‐1BB costimulation further enhances anti‐PD‐1–mediated CD8+ TIL reinvigoration. (A,B) Efficacy of the combination of 4‐1BB costimulation and PD‐1 blockade compared to the efficacy of PD‐1 blockade or isotype control in terms of proliferative response (A) and cytokine production (B). (C) Comparison of the proliferative functional response of CD8+ TILs with various combinations of PD‐1 blockade and costimulatory agonists (i.e., anti–4‐1BB, anti‐GITR, anti‐TNFR2, and anti‐CD30). (D) The percentage of 4‐1BBpos cells was compared between samples treated with PD‐1 blocking antibodies versus isotype control upon anti‐CD3 stimulation (10 ng/mL) for 48 hours. In (A) and (C), data are presented as the SI of CD8+ TILs. In (B), data are presented as the relative ratio of the percentage of CD8+ TILs that produce IFN‐γ and TNF‐α by combined 4‐1BB costimulation and PD‐1 blockade or PD‐1 blockade alone, compared to that by isotype control. **P < 0.01; ***P < 0.001. Abbreviation: Max, maximum.

References

    1. Wei SC, Duffy CR, Allison JP. Fundamental mechanisms of immune checkpoint blockade therapy. Cancer Discov 2018;8:1069‐1086. - PubMed
    1. El‐Khoueiry AB, Sangro B, Yau T, Crocenzi TS, Kudo M, Hsu C, et al. Nivolumab in patients with advanced hepatocellular carcinoma (CheckMate 040): an open‐label, non‐comparative, phase 1/2 dose escalation and expansion trial. Lancet 2017;389:2492‐2502. - PMC - PubMed
    1. Zhu AX, Finn RS, Edeline J, Cattan S, Ogasawara S, Palmer D, et al. Pembrolizumab in patients with advanced hepatocellular carcinoma previously treated with sorafenib (KEYNOTE‐224): a non‐randomised, open‐label phase 2 trial. Lancet Oncol 2018;19:940‐952. - PubMed
    1. Greten TF, Lai CW, Li G, Staveley‐O’Carroll KF. Targeted and immune‐based therapies for hepatocellular carcinoma. Gastroenterology 2019;156:510‐524. - PMC - PubMed
    1. Mayes PA, Hance KW, Hoos A. The promise and challenges of immune agonist antibody development in cancer. Nat Rev Drug Discov 2018;17:509‐527. - PubMed

Publication types

MeSH terms

Substances