Upregulation of adenosine A2A receptor and downregulation of GLT1 is associated with neuronal cell death in Rasmussen's encephalitis
- PMID: 31353670
- PMCID: PMC8018059
- DOI: 10.1111/bpa.12770
Upregulation of adenosine A2A receptor and downregulation of GLT1 is associated with neuronal cell death in Rasmussen's encephalitis
Abstract
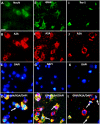
Rasmussen encephalitis (RE) is a severe pediatric inflammatory brain disease characterized by unilateral inflammation and atrophy of the cerebral cortex, drug-resistant focal epilepsy and progressive neurological and cognitive deterioration. The etiology and pathogenesis of RE remain unclear. Our previous results demonstrated that the adenosine A1 receptor (A1R) and the major adenosine-removing enzyme adenosine kinase play an important role in the etiology of RE. Because the downstream pathways of inhibitory A1R signaling are modulated by stimulatory A2AR signaling, which by itself controls neuro-inflammation, glial activation and glial glutamate homeostasis through interaction with glutamate transporter GLT-1, we hypothesized that maladaptive changes in adenosine A2A receptor (A2AR) expression are associated with RE. We used immunohistochemistry and Western blot analysis to examine the expression of A2ARs, glutamate transporter-I (GLT-1) and the apoptotic marker Bcl-2 in surgically resected cortical specimens from RE patients (n = 18) in comparison with control cortical tissue. In lesions of the RE specimen we found upregulation of A2ARs, downregulation of GLT-1 and increased apoptosis of both neurons and astroglia. Double staining revealed colocalization of A2ARs and Bcl-2 in RE lesions. These results suggest that maladaptive changes in A2AR expression are associated with a decrease in GLT-I expression as a possible precipitator for apoptotic cell loss in RE. Because A2AR antagonists are already under clinical evaluation for Parkinson's disease, the A2AR might likewise be a tractable target for the treatment of RE.
Keywords: Rasmussen encephalitis; adenosine A2A receptor; apoptosis; epilepsy; glutamate transporter-I.
© 2019 International Society of Neuropathology.
Conflict of interest statement
The authors declare that they have no conflict of interests. DB is co‐Founder of PrevEp LLC, and served as scientific consultant to Hoffman LaRoche AG.
Figures


Similar articles
-
Upregulation of Neuronal Adenosine A1 Receptor in Human Rasmussen Encephalitis.J Neuropathol Exp Neurol. 2017 Aug 1;76(8):720-731. doi: 10.1093/jnen/nlx053. J Neuropathol Exp Neurol. 2017. PMID: 28789481
-
Upregulation of HMGB1, toll-like receptor and RAGE in human Rasmussen's encephalitis.Epilepsy Res. 2016 Jul;123:36-49. doi: 10.1016/j.eplepsyres.2016.03.005. Epub 2016 Apr 16. Epilepsy Res. 2016. PMID: 27108105
-
Deletion of adenosine A2A receptors from astrocytes disrupts glutamate homeostasis leading to psychomotor and cognitive impairment: relevance to schizophrenia.Biol Psychiatry. 2015 Dec 1;78(11):763-74. doi: 10.1016/j.biopsych.2015.02.026. Epub 2015 Feb 27. Biol Psychiatry. 2015. PMID: 25869810 Free PMC article.
-
Adenosine A1 and A2A Receptors in the Brain: Current Research and Their Role in Neurodegeneration.Molecules. 2017 Apr 23;22(4):676. doi: 10.3390/molecules22040676. Molecules. 2017. PMID: 28441750 Free PMC article. Review.
-
Research progress on adenosine in central nervous system diseases.CNS Neurosci Ther. 2019 Sep;25(9):899-910. doi: 10.1111/cns.13190. Epub 2019 Jul 23. CNS Neurosci Ther. 2019. PMID: 31334608 Free PMC article. Review.
Cited by
-
Rasmussen's encephalitis: mechanisms update and potential therapy target.Ther Adv Chronic Dis. 2020 Nov 29;11:2040622320971413. doi: 10.1177/2040622320971413. eCollection 2020. Ther Adv Chronic Dis. 2020. PMID: 33294146 Free PMC article. Review.
-
Adenosine A2A Receptors as Biomarkers of Brain Diseases.Front Neurosci. 2021 Jul 16;15:702581. doi: 10.3389/fnins.2021.702581. eCollection 2021. Front Neurosci. 2021. PMID: 34335174 Free PMC article. Review.
-
Aberrant activation of the mTOR signaling pathway in Rasmussen encephalitis.Sci Rep. 2025 Feb 21;15(1):6347. doi: 10.1038/s41598-025-89426-x. Sci Rep. 2025. PMID: 39984577 Free PMC article.
-
Excitotoxic Storms of Ischemic Stroke: A Non-neuronal Perspective.Mol Neurobiol. 2024 Nov;61(11):9562-9581. doi: 10.1007/s12035-024-04184-7. Epub 2024 Apr 25. Mol Neurobiol. 2024. PMID: 38662299 Review.
-
Adenosinergic Pathway in Parkinson's Disease: Recent Advances and Therapeutic Perspective.Mol Neurobiol. 2023 Jun;60(6):3054-3070. doi: 10.1007/s12035-023-03257-3. Epub 2023 Feb 14. Mol Neurobiol. 2023. PMID: 36786912 Review.
References
-
- Bautista JF, Luders HO (2000) Semiological seizure classification: relevance to pediatric epilepsy. Epileptic Disord 2:65–74. - PubMed
-
- Benarroch EE (2010) Glutamate transporters: diversity, function, and involvement in neurologic disease. Neurology 74:259–264. - PubMed
-
- Beschorner R, Dietz K, Schauer N, Mittelbronn M, Schluesener HJ, Trautmann K et al (2007) Expression of EAAT1 reflects a possible neuroprotective function of reactive astrocytes and activated microglia following human traumatic brain injury. Histol Histopathol 22:515–526. - PubMed
-
- Bien CG, Granata T, Antozzi C, Cross JH, Dulac O, Kurthen M et al (2005) Pathogenesis, diagnosis and treatment of Rasmussen encephalitis: a European consensus statement. Brain 128(Pt 3):454–471. - PubMed
-
- Bien CG, Widman G, Urbach H, Sassen R, Kuczaty S, Wiestler OD et al (2002) The natural history of Rasmussen's encephalitis. Brain 125(Pt 8):1751–1759. - PubMed
Publication types
MeSH terms
Substances
Supplementary concepts
Grants and funding
LinkOut - more resources
Full Text Sources
Medical

