. 2019 Jul;22(7):e25362.
doi: 10.1002/jia2.25362.

Near full genome characterization of HIV-1 unique recombinant forms in Cameroon reveals dominant CRF02_AG and F2 recombination patterns

Affiliations

Near full genome characterization of HIV-1 unique recombinant forms in Cameroon reveals dominant CRF02_AG and F2 recombination patterns

Andrew N Banin et al. J Int AIDS Soc. 2019 Jul.

Abstract

Introduction: In Cameroon, a manifold diversity of HIV strains exists with CRF02_AG and unique recombinant forms (URFs) being the predominant strains. In recent years, a steady increase in URFs and clade F2 viruses has been monitored through partial genome sequencing. There is an information gap in the characterization of emerging URFs along the full genome, which is needed to address the challenges URFs pose towards diagnosis, treatment and HIV-1 vaccine design.

Method: Eighteen Cameroonian URFs from samples collected between the years 2000 and 2015 were studied using a newly developed near full genome sequencing (NFGS) protocol based on variable nested RT-PCRs with a versatile primer set. Near full genomes were characterized for recombination patterns and sequence signatures with possible impact on antiretroviral treatment or Env-directed immune responses. Third-generation sequencing (3GS) of near full or half genomes (HGs) gave insight into intra-patient URF diversity.

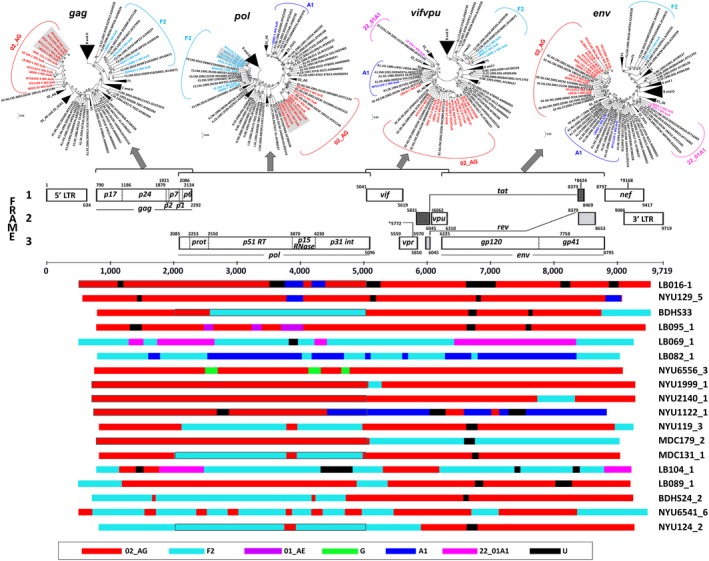
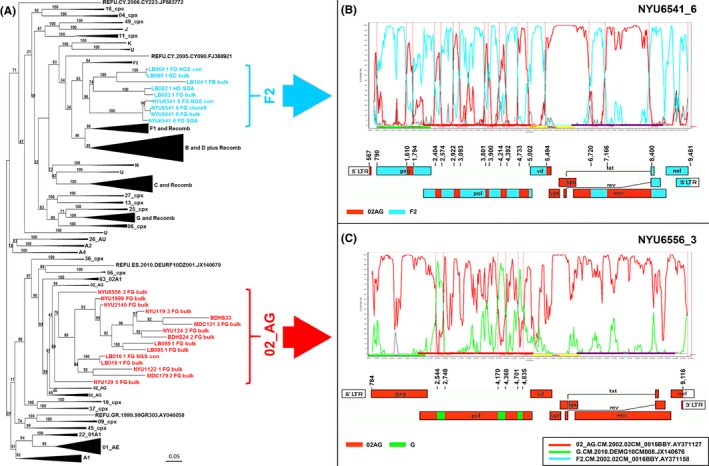
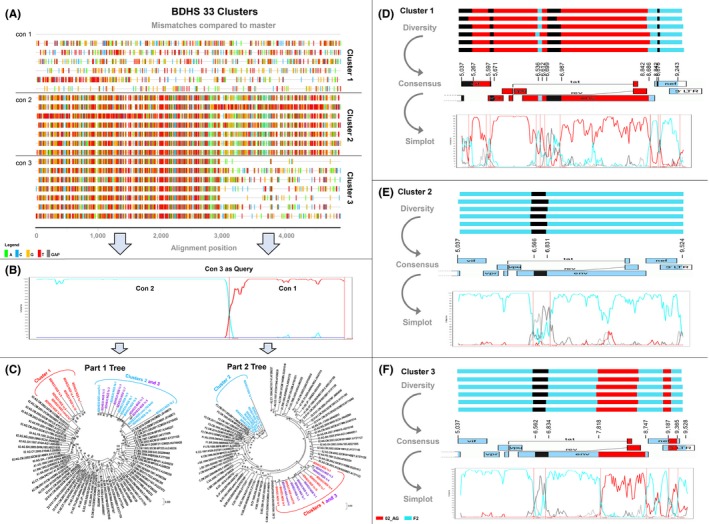
Results: The characterized URFs were composed of a broad variety of subtypes and recombinants including A, F, G, CRF01_AE, CRF02_AG and CRF22_01A1. Phylogenetic analysis unveiled dominant CRF02_AG and F2 recombination patterns. 3GS indicated a high intra-patient URF diversity with up to four distinct viral sub-populations present in plasma at the same time. URF pol genomic analysis revealed a number of accessory drug resistance mutations (DRMs) in the ART-naïve participants. Genotypic env analysis suggests CCR5 usage in 14/18 samples and identified deviations at residues, critical for gp120/gp41 interphase and CD4 binding site broadly neutralizing antibodies in more than half of the studied URFs. V1V2 sites of immune pressure in the human RV144 vaccine study varied in more than a third of URFs.

Conclusions: This study identified novel mosaic patterns in URFs in Cameroon. In line with the regional predominance of CRF_02AG and the increased prevalence of clade F2, prominent CRF_02AG and F2 background patterns were observed underlying the URFs. In the context of the novel mosaic genomes, the impact of the identified accessory DRMs and Env epitope variations on treatment and immune control remains elusive. The evolving diversity of HIV-1 URFs in Cameroon requires continuous monitoring to respond to the increasing challenges for diagnosis, antiretroviral treatment and prevention.

Keywords: Env epitopes and drug resistance mutations; intra-patient viral diversity; near full genome sequencing; third-generation sequencing; unique recombinant forms.


Figures

Figure 1
Figure 1. Recombinant breakpoint patterns of URFs from Cameroon over the near full genome and for selected sub‐regions
(A) Maximum Likelihood phylogenetic trees of separate genomic regions (gag, pol, vif, vpr, vpu and env) of the near full genome sequences (NFGS), generated using MEGA5.2. Reference sequences are shown in black (LANL database); study sequences are coloured according to subtype. Brackets enclose all sequences per subtype. (B) Schematic representation of the mosaic composition of the 18 studied NFGS. The HxB2 genome map (GenBank: K03455) is shown for genomic orientation. The legend at the bottom indicates the colour code for subtype representation. Genetic distances <0.2%, as observed in gag and pol trees, are marked with grey background in the trees and with grey surrounding boxes in the schematic. NFGS, near full genome sequencing.
Figure 2
Figure 2. Near full genome phylogenetic analysis reveals two common subtype background patterns in URFs from Cameroon
(A) Maximum likelihood tree of NFGS (HxB2 pos 596 to 9542) including study sequences in the indicated colour code and subtype and circulating recombinant form reference sequences (72 Reference panel, LANL database) in black. Brackets enclose all study sequences per subtype. Large branches of reference sequences that are distant from the study sequences were collapsed for clarity. URFs that clustered with CRF02_AG reference sequences are shown in red (CRF02_AG backbone) and those that cluster with subtype F2 are shown in cyan (F2 backbone). (B and C) One representative NFGS is shown for each cluster, that is, NYU6541_6 for F2 (B) and NYU6556_3 for CRF02_AG (C). Bootscan plots (Simplot) are shown in the upper panel and schematic representations of the breakpoint patterns (Recombinant Drawing tool, LANL database) in the lower panel. Reference strains used for Simplot analyses are boxed. NFGS, near full genome sequencing.
Figure 3
Figure 3. Intra‐patient URF diversity in subject BDHS‐33 determined by deep sequencing analysis
(A) Highlighter plot of a selection of 18 representative third‐generation sequencing (3GS) reads with three consensus sequences (con 1 to con 3) according to the identified clusters (1 to 3). Mismatches compared to con 1 as master sequence are shown as bars coloured according to the legend. The sequence reads are partitioned according to the identified clusters, and the vertical red line indicates the internal breakpoint dividing part 1 (F2‐like) and part 2 (02‐AG like). (B) Bootscan analysis of intra‐patient recombinants was done using con 3 as query sequence and con 1 and con 2 as reference sequences (SimPlot, window size 200, step size 20). (C) Separate maximum likelihood phylogenetic trees for each recombinant genomic sub‐region (parts 1 and 2) as determined in (A and B). Reference sequences are shown in black (LANL database); study sequences are coloured according to clusters. Brackets enclose all study sequences per subtype (F2 in cyan, CRF02_AG in red). (D, E and F) Schematic illustration of viral diversity between and within clusters 1, 2 and 3. For each cluster, recombination schematics are shown for six representative reads (upper panel) and the derived consensus sequence (middle panel), indicated in the form of a genomic map (Recombinant drawing tool, LANL database). Bootscan plots (Simplot) of the consensus sequences are shown in the lower panel. Relative abundance of each viral sub‐populations (cluster) as determined by 3GS is shown in brackets (%).

References

    1. Hemelaar J, Elangovan R, Yun J, Dickson‐Tetteh L, Fleminger I, Kirtley S, et al. Global and regional molecular epidemiology of HIV‐1, 1990‐2015: a systematic review, global survey, and trend analysis. Lancet Infect Dis. 2019;19(2):143–55. - PubMed
    1. Keele BF, Van Heuverswyn F, Li Y, Bailes E, Takehisa J, Santiago ML, et al. Chimpanzee reservoirs of pandemic and nonpandemic HIV‐1. Science. 2006;313(5786):523–6. - PMC - PubMed
    1. Sharp PM, Hahn BH. Origins of HIV and the AIDS pandemic. Cold Spring Harb Perspect Med. 2011;1(1):a006841. - PMC - PubMed
    1. McNeil D Jr. Chimp to man to history: the path of AIDS. The New York Times. 2011 October 17, 2011. [cited 2018 Nov 19]. Available from: https://www.nytimes.com/2011/10/18/health/18aids.html
    1. Tongo M, Martin DP, Zembe L, Mpoudi‐Ngole E, Williamson C, Burgers WA. Characterization of HIV‐1 gag and nef in Cameroon: further evidence of extreme diversity at the origin of the HIV‐1 group M epidemic. Virol J. 2013;10:29. - PMC - PubMed

Publication types

Substances