

A genome-wide screen identifies IRF2 as a key regulator of caspase-4 in human cells
- PMID: 31353801
- PMCID: PMC6727027
- DOI: 10.15252/embr.201948235
A genome-wide screen identifies IRF2 as a key regulator of caspase-4 in human cells
Abstract
Caspase-4, the cytosolic LPS sensor, and gasdermin D, its downstream effector, constitute the non-canonical inflammasome, which drives inflammatory responses during Gram-negative bacterial infections. It remains unclear whether other proteins regulate cytosolic LPS sensing, particularly in human cells. Here, we conduct a genome-wide CRISPR/Cas9 screen in a human monocyte cell line to identify genes controlling cytosolic LPS-mediated pyroptosis. We find that the transcription factor, IRF2, is required for pyroptosis following cytosolic LPS delivery and functions by directly regulating caspase-4 levels in human monocytes and iPSC-derived monocytes. CASP4, GSDMD, and IRF2 are the only genes identified with high significance in this screen highlighting the simplicity of the non-canonical inflammasome. Upon IFN-γ priming, IRF1 induction compensates IRF2 deficiency, leading to robust caspase-4 expression. Deficiency in IRF2 results in dampened inflammasome responses upon infection with Gram-negative bacteria. This study emphasizes the central role of IRF family members as specific regulators of the non-canonical inflammasome.
Keywords: LPS; caspase-11; inflammasome; interferon regulatory factor; lipopolysaccharide.
© 2019 The Authors.
Conflict of interest statement
The authors declare that they have no conflict of interest.
Figures
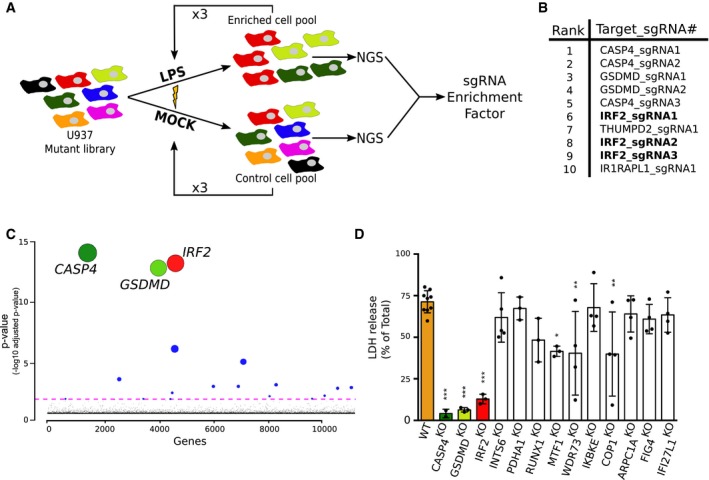
A genome‐wide CRISPR/Cas9 screen based on LPS electroporation was performed in U937 cells. Four successive electroporation rounds were performed. DNA was extracted from surviving cells, and next‐generation sequencing (NGS) was performed to calculate the sgRNA enrichment factor.
The 10 most enriched sgRNA in the LPS‐electroporated samples are shown.
Graphical representation of the screen results with each gene identified in the output libraries (10,750) represented on the x‐axis and the corresponding adjusted P‐value on the y‐axis. Statistical analysis was performed using the Wald test. The colored line represents the 0.05 P‐value threshold. The size of the circle is inversely proportional to the P‐value.
U937 cell lines were knock‐out using CRISPR/Cas9, and cell death was quantified by LDH release assay 4 h after LPS electroporation. Each dot represents the average of three technical LDH replicates; means and SD of 3–9 independent experiments are shown. One‐way ANOVA with Dunnet's multiple comparisons test was performed. Adjusted P‐value is shown (from left to right ***P < 0.001, ***P < 0.001, ***P < 0.001, P = 0.84, P = 1, P = 0.092, *P = 0.012, **P = 0.0026, P = 1, **P = 0.0022, P = 0.98, P = 0.82, P = 0.97).
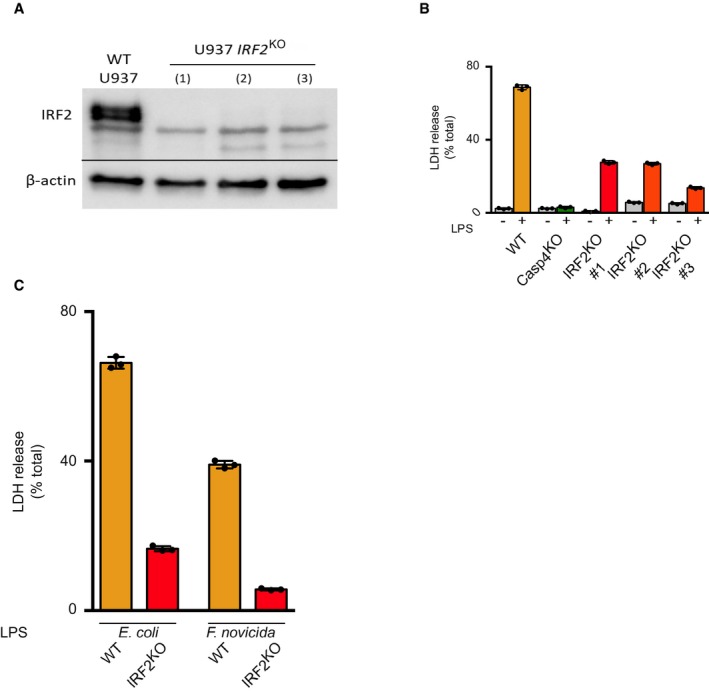
IRF2 and β‐actin protein levels in WT and three independent IRF2 KO U937 cell lines (#1–3) were assessed by Western blotting analysis.
LDH release was quantified from three independent IRF2 KO cell lines 4 h after E. coli LPS electroporation. Each dot represents a technical LDH replicate; the bar represents the mean ± SD of 3 LDH replicates.
LDH release was quantified 4 h after electroporation with LPS for E. coli or F. novicida (5 μg for 4 × 10⁵ cells). Each dot represents a technical LDH replicate; the bar represents the mean ± SD of 3 LDH replicates.
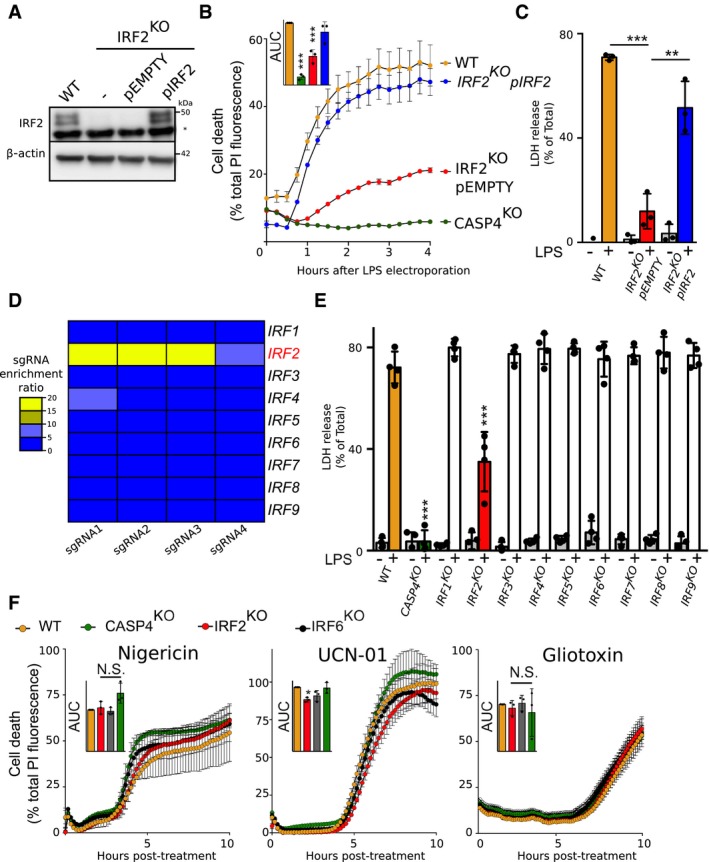
IRF2 and β‐actin protein levels were assessed in the lysate of the indicated U937 cells by Western blotting analysis. A non‐specific band (*) is observed in the IRF2 Western blot. One experiment representative of three experiments is shown.
Cell death induced by LPS electroporation or the indicated treatment was quantified in real time by measuring propidium iodide (PI) incorporation/fluorescence every 15 min. Cell death was normalized using untreated and TX‐100‐treated cells. The kinetics of one representative experiment and the areas under the curve (AUC) (normalized to the WT AUC) of three independent experiments are shown. Each point represents the mean of a biological triplicate of one experiment; the bar represents the mean ± SD of three independent experiments.
Cell death was measured by LDH release assay 4 h after LPS electroporation. Each dot corresponds to the LDH triplicate of one experiment; the bar represents the mean ± SD of four independent experiments.
Heat map representation of the enrichment factor for the 4 sgRNA targeting each IRF in the genome‐wide screen.
Cell death was measured by LDH release assay 4 h after LPS electroporation. Each dot corresponds to the LDH triplicate of one experiment; the bar represents the mean ± SD of three independent experiments.
Cell death was quantified by measuring PI incorporation/fluorescence every 15 min after treatment with nigericin, UCN‐01, or gliotoxin. The kinetics of one representative experiment and the areas under the curve (AUC) (normalized to the WT AUC) of three independent experiments are shown. Each point represents the mean of a biological triplicate of one experiment; the bar represents the mean ± SD of three independent experiments.
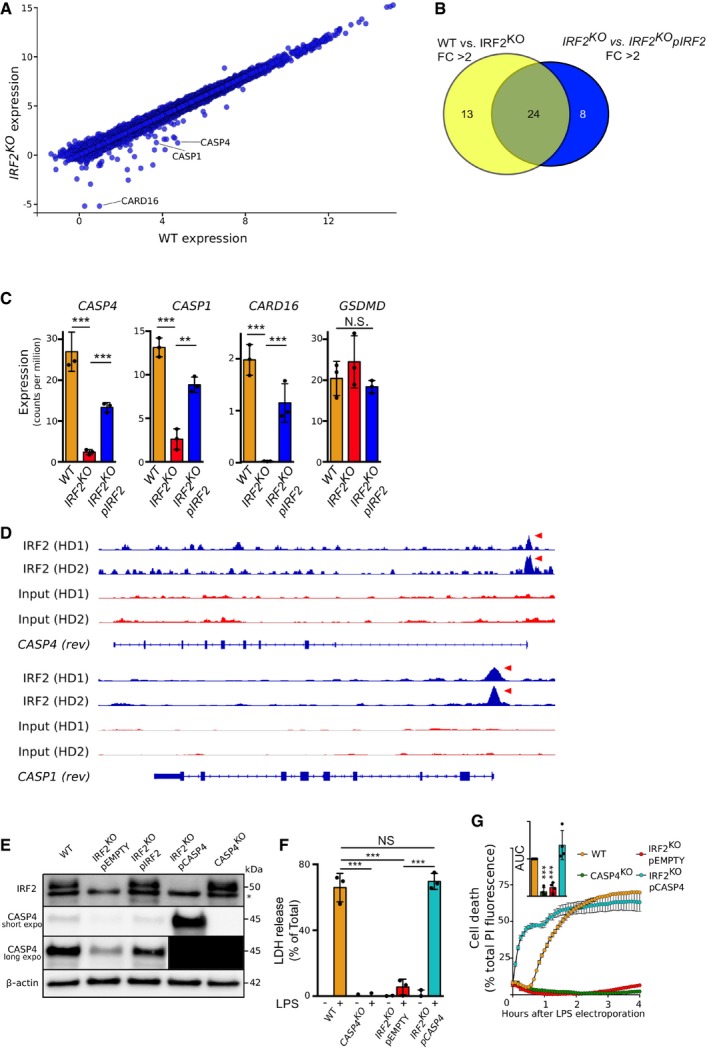
- A
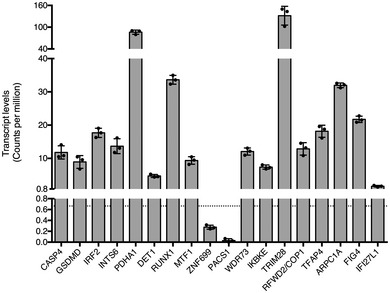
mRNA transcript levels in U937 cells WT vs. IRF2KO cells were quantified by RNA‐seq.
- B
Venn diagram showing the number of genes with a transcript level fold change (FC) greater than 2 in U937 cells WT vs. IRF2KO cells (yellow) and greater than 2 in IRF2KO vs. IRF2KO pIRF2 (Blue).
- C
CASP4, CASP1, CARD16, and GSDMD transcript levels were quantified by RNA‐seq in the indicated U937 cell lines.
- D
Chromatin immunoprecipitation sequencing (ChIP‐seq) in primary human monocytes from two healthy donors (HD) for IRF2 binding onto CASP1 and CASP4 promoters. Red arrows indicate promoter region with IRF2 binding.
- E
IRF2 and CASP4 protein levels were assessed by Western blotting in the indicated cell lines. The asterisk indicates a non‐specific band. For the long exposure of the CASP4 Western blot, the 2 left lanes were covered during revelation to prevent signal bleed through and were blacked out for representation purposes.
- F, G
Cell death was quantified by (F) LDH release assay 4 h after LPS electroporation or (G) by measuring propidium iodide (PI) incorporation/fluorescence every 5 min. Cell death was normalized using untreated and TX‐100‐treated cells. The kinetics of one representative experiment and the areas under the curve (AUC) (normalized to the WT AUC) of four independent experiments are shown. Each point represents the mean of a biological triplicate of one experiment; the bar represents the mean ± SD of four independent experiments.
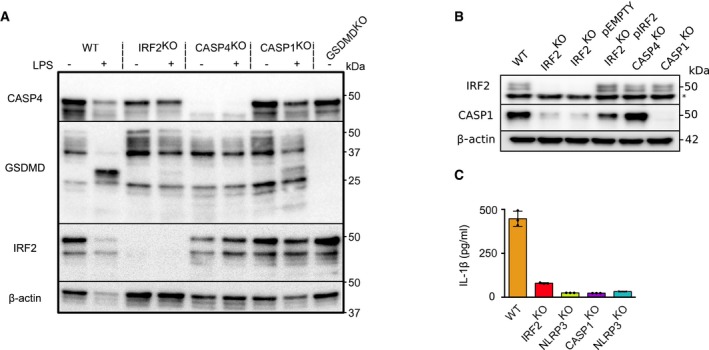
Caspase‐4, gasdermin D, IRF2, and β‐actin protein levels in the indicated U937 cell lines were assessed by Western blotting analysis at 1 h post‐mock (−) or LPS (+) electroporation. Processing of gasdermin D (31 kDa band) is clearly observed in WT U937 cells but is barely detectable in IRF2KO cells. One experiment representative of three independent experiments is shown.
IRF2, caspase‐1, and β‐actin protein levels in the indicated U937 cell lines were assessed by Western blotting analysis at steady state. The asterisk indicates a non‐specific band. One experiment representative of two independent experiments is shown.
IL‐1β level in the supernatant of the indicated PMA‐differentiated U937 cell lines was quantified by ELISA at 2 h post‐nigericin treatment. Each dot represents the value of a biological replicate; the bar represents the mean ± SD of 3 biological replicates from one experiment representative of two independent experiments.
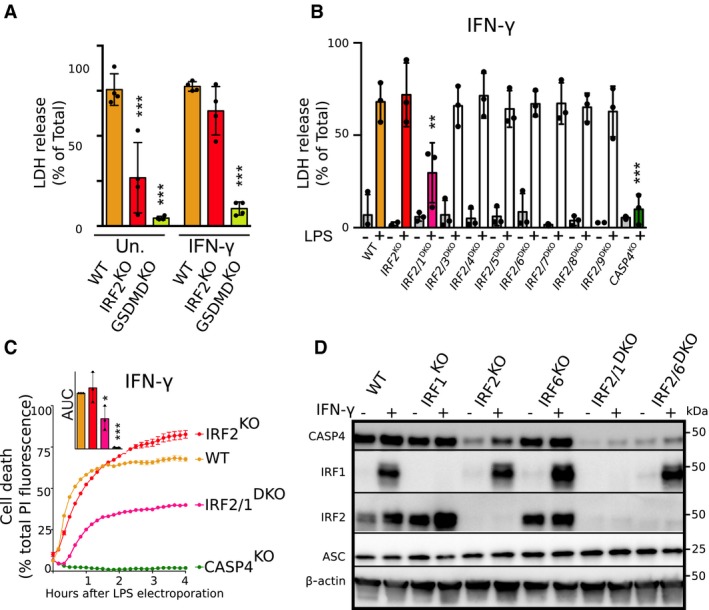
- A–C
Cell death was assessed (A, B) by measuring LDH release 4 h after LPS electroporation or (C) by measuring propidium iodide (PI) incorporation/fluorescence every 10 min in the indicated U937 cell lines primed (A‐as indicated, B, C‐all samples) or not with IFN‐γ. (C) Cell death was normalized using untreated and TX‐100‐treated cells. One real‐time cell death experiment (mean and SD of triplicate) representative of three independent experiments is shown. The areas under the curve (AUC) (normalized to the WT AUC) of three independent experiments are shown. Each point represents the mean of a triplicate of one experiment; the bar represents the mean (and SD) of the three independent experiments.
- D
Caspase‐4, IRF2, and IRF1 protein levels were assessed in the lysate of the indicated U937 cell lines primed or not with IFN‐γ. Data are representative of three independent experiments.
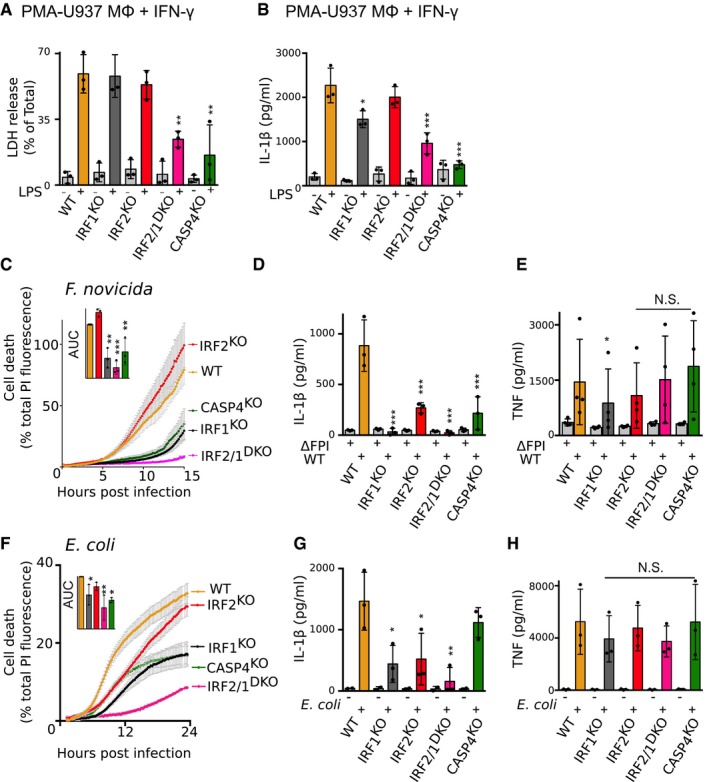
- A
Cell death was quantified by LDH assay 2 h after LPS electroporation.
- B
Cells were primed with Pam3CSK4. IL‐1β levels were assessed by ELISA 4 h after LPS electroporation.
- C
Cell death was quantified by measuring propidium iodide (PI) incorporation/fluorescence every 5 min after infection with F. novicida or (F) E. coli. Cell death was normalized using untreated and TX‐100‐treated cells. One real‐time cell death experiment (mean and SD of triplicate) representative of three independent experiments is shown. The areas under the curve (AUC) (normalized to the WT AUC) of three independent experiments are shown. Each point represents the mean of a triplicate of one experiment; the bar represents the mean (and SD) of the three independent experiments.
- (D–H)
(D, G) IL‐1β and (E, H) TNF levels were assessed by ELISA 6 h after WT or ΔFPI mutant F. novicida (D, E) or E. coli (G, H) infection.
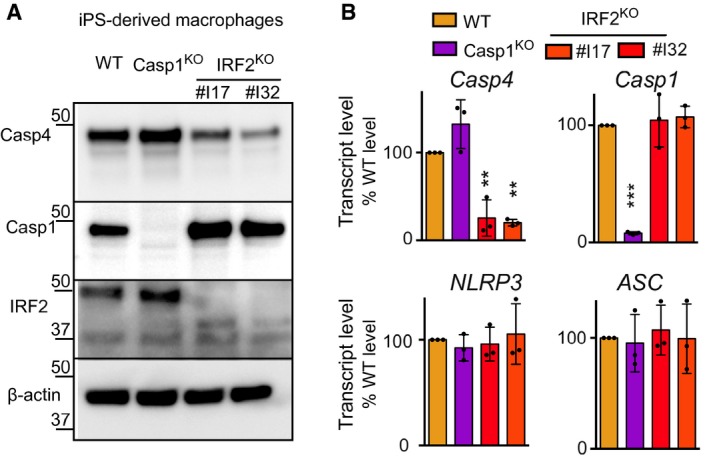
- A, B
Macrophages were derived from human iPSC clones knock‐out for the indicated genes. Two clones were selected for IRF2 KO cells. (A) Caspase‐4, caspase‐1, IRF2, and β‐actin protein levels were assessed by Western blotting analysis. One experiment representative of two independent experiments is shown. (B) The indicated mRNA levels were quantified by qRT–PCR normalized to β‐actin mRNA levels and expressed as fold change compared to WT levels. Each dot represents the average of a technical RT–PCR triplicate from one experiment; the bar represents the mean of three independent experiments. One‐way ANOVA with Dunnet's multiple comparisons test was performed (WT vs. IRF2 KO #I17 **P = 0.0020; WT vs. IRF2 KO #32 **P = 0.0013 for CASP4 transcript. WT vs. CASP1 KO ***P < 0.0001 for CASP1 transcript levels).
Comment in
-
IRF1 and IRF2 regulate the non-canonical inflammasome.EMBO Rep. 2019 Sep;20(9):e48891. doi: 10.15252/embr.201948891. Epub 2019 Aug 5. EMBO Rep. 2019. PMID: 31379068 Free PMC article.
References
-
- Fleischmann C, Scherag A, Adhikari NKJ, Hartog CS, Tsaganos T, Schlattmann P, Angus DC, Reinhart K (2016) Assessment of global incidence and mortality of hospital‐treated sepsis. Current estimates and limitations. Am J Respir Crit Care Med 193: 259–272 - PubMed
-
- Cavaillon J‐M (2017) Exotoxins and endotoxins: inducers of inflammatory cytokines. Toxicon 149: 45–53 - PubMed
-
- Stinebring WR, Youngner JS (1964) Patterns of interferon appearance in mice injected with bacteria or bacterial endotoxin. Nature 204: 712 - PubMed
Publication types
MeSH terms
Substances
Associated data
- Actions
Grants and funding
- ANR-16-CE15-0011-02/Agence Nationale de la Recherche (ANR)/International
- ERC-2012-StGt-311542/EC|H2020|H2020 Priority Excellent Science|H2020 European Research Council (ERC)/International
- SPF201809006927/Fondation pour la Recherche Médicale (FRM)/International
- ANR-11-LABX-0048/Agence Nationale de la Recherche (ANR)/International
- ANR-11-IDEX-0007/Investissements d'Avenir/International
LinkOut - more resources
Full Text Sources
Molecular Biology Databases
Research Materials
