Dynamic Cerebral Autoregulation Reproducibility Is Affected by Physiological Variability
- PMID: 31354518
- PMCID: PMC6634255
- DOI: 10.3389/fphys.2019.00865
Dynamic Cerebral Autoregulation Reproducibility Is Affected by Physiological Variability
Abstract
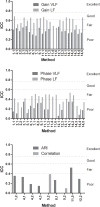
Parameters describing dynamic cerebral autoregulation (DCA) have limited reproducibility. In an international, multi-center study, we evaluated the influence of multiple analytical methods on the reproducibility of DCA. Fourteen participating centers analyzed repeated measurements from 75 healthy subjects, consisting of 5 min of spontaneous fluctuations in blood pressure and cerebral blood flow velocity signals, based on their usual methods of analysis. DCA methods were grouped into three broad categories, depending on output types: (1) transfer function analysis (TFA); (2) autoregulation index (ARI); and (3) correlation coefficient. Only TFA gain in the low frequency (LF) band showed good reproducibility in approximately half of the estimates of gain, defined as an intraclass correlation coefficient (ICC) of >0.6. None of the other DCA metrics had good reproducibility. For TFA-like and ARI-like methods, ICCs were lower than values obtained with surrogate data (p < 0.05). For TFA-like methods, ICCs were lower for the very LF band (gain 0.38 ± 0.057, phase 0.17 ± 0.13) than for LF band (gain 0.59 ± 0.078, phase 0.39 ± 0.11, p ≤ 0.001 for both gain and phase). For ARI-like methods, the mean ICC was 0.30 ± 0.12 and for the correlation methods 0.24 ± 0.23. Based on comparisons with ICC estimates obtained from surrogate data, we conclude that physiological variability or non-stationarity is likely to be the main reason for the poor reproducibility of DCA parameters.
Keywords: ARI index; cerebral blood flow; cerebral hemodynamics; transcranial Doppler; transfer function analysis.
Figures


Similar articles
-
Reproducibility of dynamic cerebral autoregulation parameters: a multi-centre, multi-method study.Physiol Meas. 2018 Dec 7;39(12):125002. doi: 10.1088/1361-6579/aae9fd. Physiol Meas. 2018. PMID: 30523976
-
Assessment of dynamic cerebral autoregulation in humans: Is reproducibility dependent on blood pressure variability?PLoS One. 2020 Jan 10;15(1):e0227651. doi: 10.1371/journal.pone.0227651. eCollection 2020. PLoS One. 2020. PMID: 31923919 Free PMC article.
-
Chasing the evidence: the influence of data segmentation on estimates of dynamic cerebral autoregulation.Physiol Meas. 2020 Apr 17;41(3):035006. doi: 10.1088/1361-6579/ab7ddf. Physiol Meas. 2020. PMID: 32150740
-
Assessment of cerebral autoregulation in stroke: A systematic review and meta-analysis of studies at rest.J Cereb Blood Flow Metab. 2019 Nov;39(11):2105-2116. doi: 10.1177/0271678X19871013. Epub 2019 Aug 21. J Cereb Blood Flow Metab. 2019. PMID: 31433714 Free PMC article.
-
Nonstationarity of dynamic cerebral autoregulation.Med Eng Phys. 2014 May;36(5):576-84. doi: 10.1016/j.medengphy.2013.09.004. Epub 2013 Oct 7. Med Eng Phys. 2014. PMID: 24113077 Review.
Cited by
-
Dynamic cerebral autoregulation measured by diffuse correlation spectroscopy.J Cereb Blood Flow Metab. 2023 Aug;43(8):1317-1327. doi: 10.1177/0271678X231153728. Epub 2023 Jan 26. J Cereb Blood Flow Metab. 2023. PMID: 36703572 Free PMC article.
-
The consistency of invasive and non-invasive arterial blood pressure for the assessment of dynamic cerebral autoregulation in NICU patients.Front Neurol. 2022 Dec 14;13:1032353. doi: 10.3389/fneur.2022.1032353. eCollection 2022. Front Neurol. 2022. PMID: 36588893 Free PMC article.
-
Cerebrovascular hemodynamics association with brain structure and function in Multiple Sclerosis.Mult Scler Relat Disord. 2024 Nov;91:105882. doi: 10.1016/j.msard.2024.105882. Epub 2024 Sep 7. Mult Scler Relat Disord. 2024. PMID: 39276598 Free PMC article.
-
Transfer function analysis of dynamic cerebral autoregulation: A CARNet white paper 2022 update.J Cereb Blood Flow Metab. 2023 Jan;43(1):3-25. doi: 10.1177/0271678X221119760. Epub 2022 Aug 12. J Cereb Blood Flow Metab. 2023. PMID: 35962478 Free PMC article. Review.
-
Near-Infrared Spectroscopy-Derived Dynamic Cerebral Autoregulation in Experimental Human Endotoxemia-An Exploratory Study.Front Neurol. 2021 Sep 10;12:695705. doi: 10.3389/fneur.2021.695705. eCollection 2021. Front Neurol. 2021. PMID: 34566840 Free PMC article.
References
-
- Bendat J. S., Piersol A. G. (1986). Random Data: Analysis, and Measurement Procedures. New York, NY: Wiley.
-
- Box G. E. P., Cox D. R. (1964). An analysis of transformations. J. R. Stat. Soc. Ser. B-Stat. Methodol. 26 211–252.
Grants and funding
LinkOut - more resources
Full Text Sources

