. 2019 Jul 10:10:1433.
doi: 10.3389/fimmu.2019.01433. eCollection 2019.

STAT1 Gain-of-Function Mutations Cause High Total STAT1 Levels With Normal Dephosphorylation

Affiliations

STAT1 Gain-of-Function Mutations Cause High Total STAT1 Levels With Normal Dephosphorylation

Ofer Zimmerman et al. Front Immunol. .

Abstract

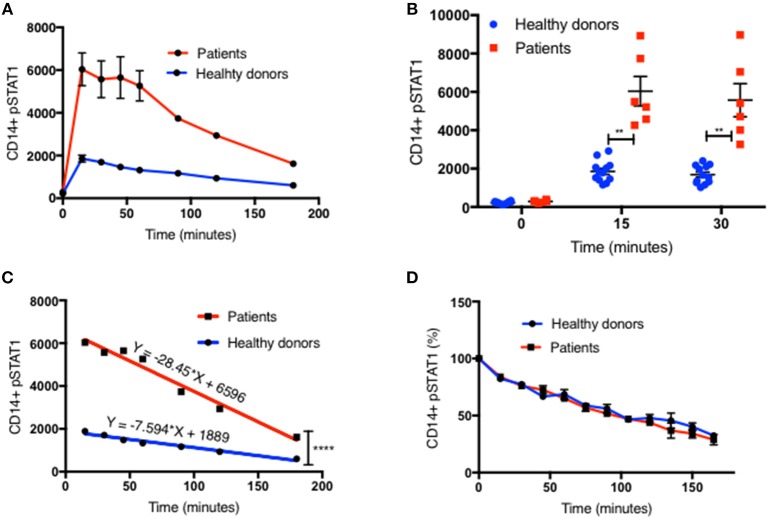
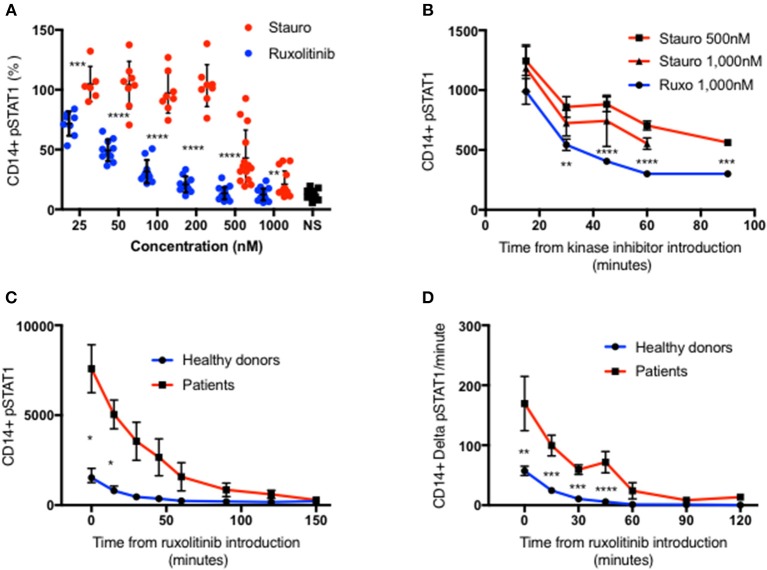
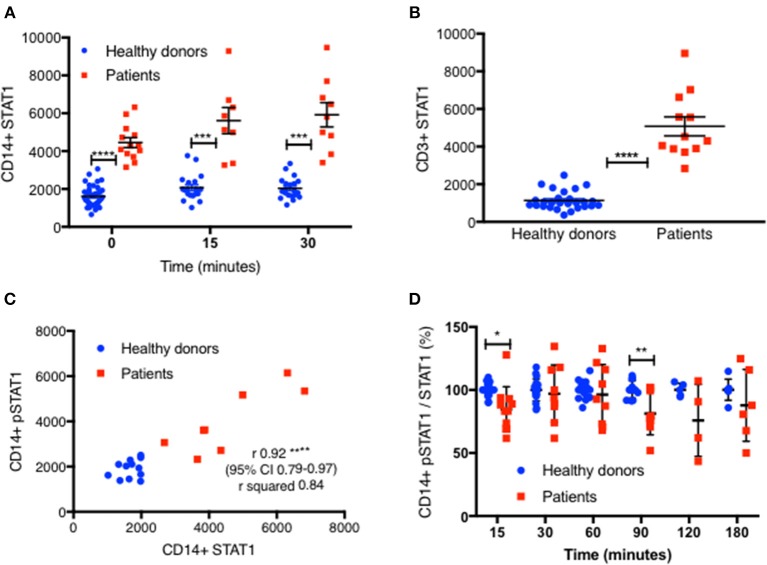
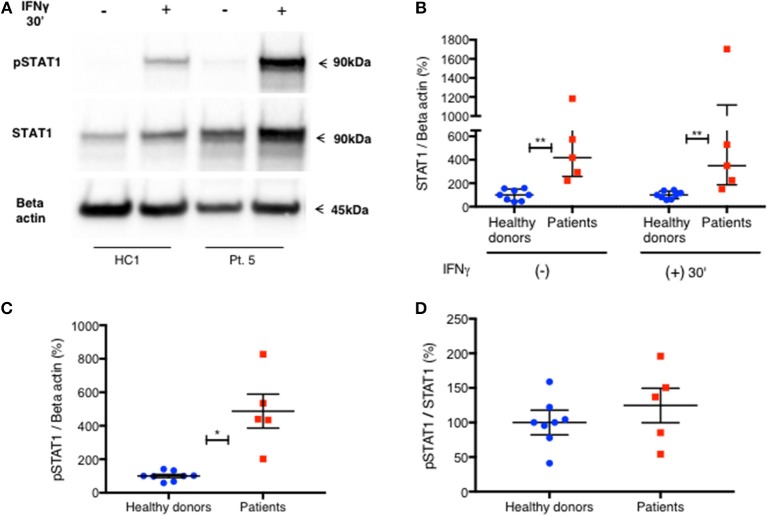
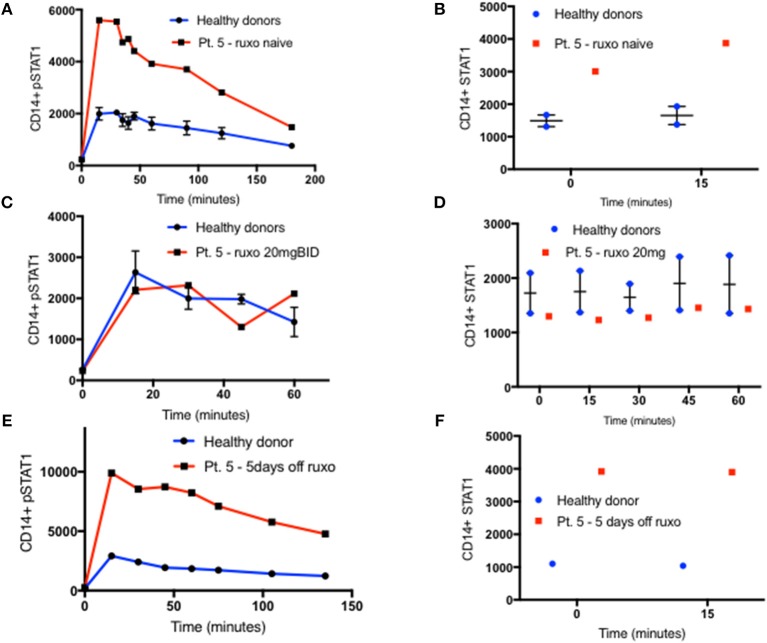
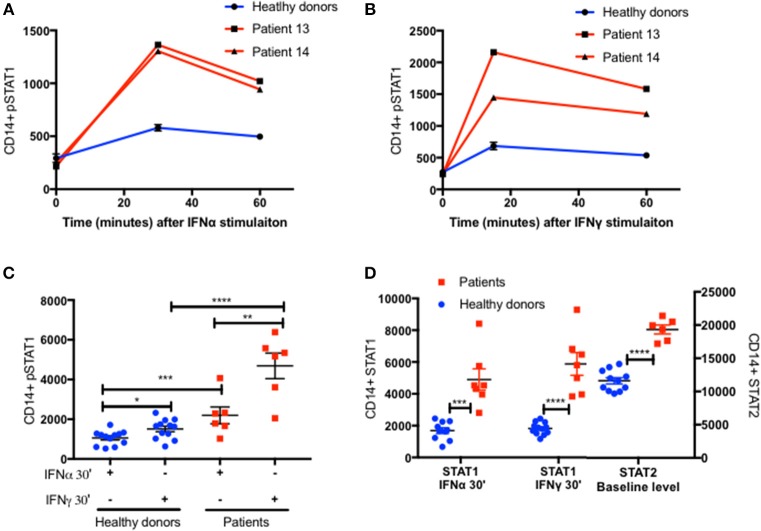
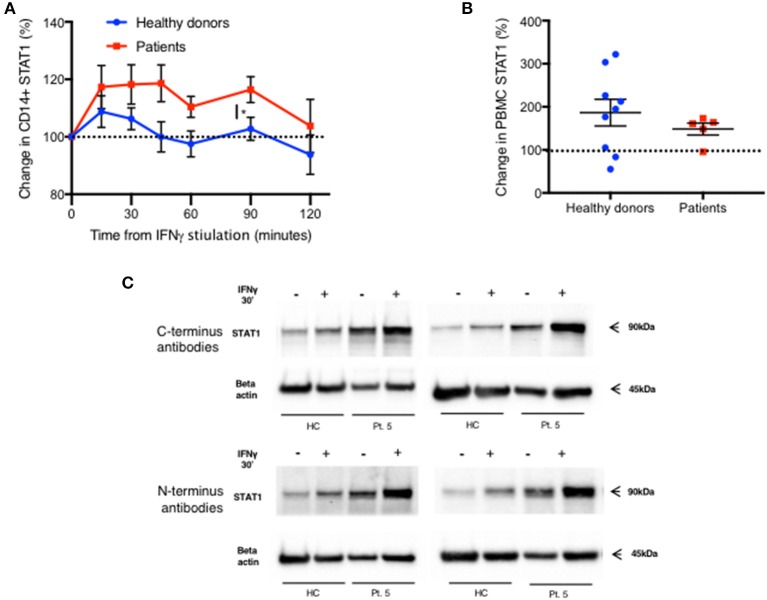
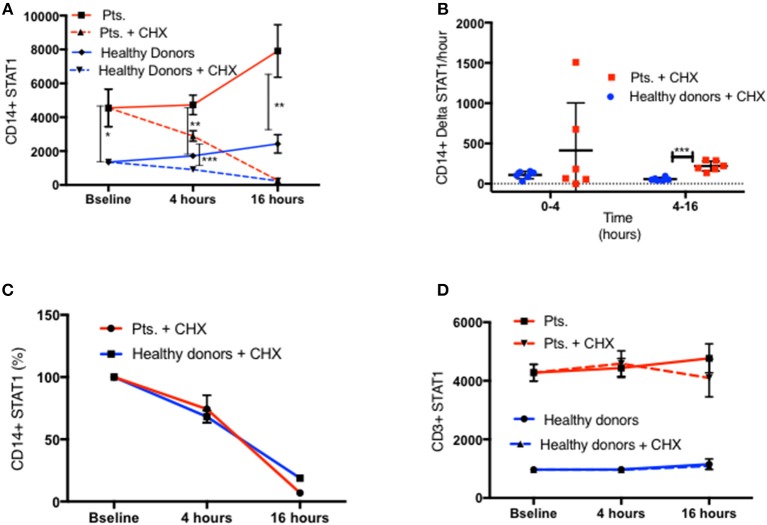
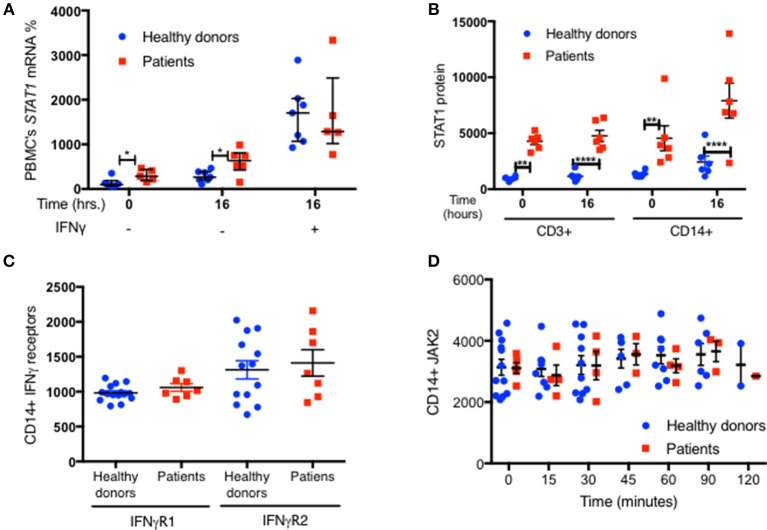
Signal transducer and activator of transcription (STAT1)1 gain of function (GOF) pathogenic variants have been associated with increased levels of phosphorylated STAT1 and STAT1-dependent cellular responses. Delayed dephosphorylation was proposed as the underlying mechanism leading to the characteristically raised pSTAT1 levels. We examined the levels of STAT1 protein and message as well as rates of STAT1 phosphorylation, dephosphorylation, and degradation associated with STAT1 GOF pathogenic variants. Fresh peripheral blood mononuclear cells (PBMC) from 14 STAT1 GOF patients carrying 10 different pathogenic variants in the coiled-coil, DNA binding, and SH2 domains and healthy donors were used to study STAT1 levels and phosphorylation (pSTAT1) following IFNγ and IFNα stimulation. STAT1 protein levels were measured by flow cytometry and immunoblot. STAT1 mRNA levels were measured using quantitative reverse transcription PCR. STAT1 protein degradation was studied using cycloheximide. Patient IFNγ and IFNα induced peak pSTAT1 was higher than in healthy controls. The velocity of pSTAT1 dephosphorylation after treatment of IFNγ stimulated CD14+ monocytes with the Janus Kinase (JAK)-inhibitor ruxolitinib was significantly faster in patient cells. STAT1 protein levels in patient CD14+ monocytes and CD3+ T cells were higher than in healthy donors. There was a strong and positive correlation between CD14+ STAT1 protein levels and peak pSTAT1 levels. Patient fresh PBMC STAT1 mRNA levels were increased at rest and after 16 h of incubation. STAT1 protein degradation was similar in patient and healthy volunteer cells. Patient IFNγ receptors 1 and 2 and JAK2 levels were normal. One patient in our cohort was treated with the oral JAK inhibitor ruxolitinib. Treatment was associated with normalization of both STAT1 protein and peak pSTAT1 levels. After JAK inhibitor treatment was stopped the patient's CD14+ monocyte STAT1 protein and peak phosphorylation levels increased proportionally. These findings suggest that patients with STAT1 GOF mutations have higher levels of total STAT1 protein, leading to high levels of pSTAT1 after stimulation, despite rapid STAT1 dephosphorylation and normal degradation.

Keywords: JAK inhibitors; STAT1; T cells; dephosphorylation; gain of function; mRNA; monocytes; protein.


Figures

Figure 1
Figure 1
Increased peak pSTAT1 levels with normal STAT1 dephosphorylation rate in GOF CD14+ monocytes. (A) Average CD14+ monocytes pSTAT1 level at rest (time 0) and up to 3 h of IFNγ stimulation in GOF patients (red line, n = 6) and healthy donors (blue line, n = 12), as measured by flow cytometry with an anti pSTAT1 AF647 antibody. Levels are expressed in geometric mean of fluorescence. (B) Patients' (red squares, n = 6) and healthy donors' (blue dots, n = 12) pSTAT1 at rest and after 15′ and 30′ of IFNγ stimulation, as measured by flow cytometry. Each red square represents the average of repeated measurement (1–3) of each patient. Each blue dot represents one measurement of one healthy control. Comparisons between the two groups were performed for each time point independently. (C) Linear regression lines of pSTAT1 level over time (minutes), from peak level, starting 15 min after IFNγ stimulation, of patients' (red lines, n = 6) and healthy controls' (blue lines, n = 12) CD14+ monocytes, as measured by flow cytometry. (D) Average CD14+ monocytes pSTAT1 level over time as expressed in percentage from peak level of each tested healthy donor (blue line, n = 36) or GOF patient (red line, n = 12). Peak phosphorylation point was defined as time zero for each patient or healthy control, independently. **P < 0.01; ****P < 0.0001, by t-test (B) or ANCOVA (C). Quantitative data represent mean ± SEM.
Figure 2
Figure 2
Ruxolitinib is more potent than staurosporine in inhibiting STAT1 phosphorylation. (A) Healthy donors CD14+ monocytes pSTAT1 level after 15′ of IFNγ stimulation with pre-incubation with a kinase inhibitor ruxolitinib (blue dots, n = 16) or staurosporine (red dot, n = 14) at increasing concentration (25–1,000 nM). Each individual's pSTAT1 level is expressed in percentage of the same healthy donor pSTAT1 level after 15′ of IFNγ stimulation, without pre-incubation with a kinase inhibitor. (B) CD14+ monocytes pSTAT1 level 15–90′ after introduction of staurosporine (500 or 1,000 nM) or ruxolitinib (1,000 nM) to healthy donors fresh PBMC stimulated with IFNγ for 15 min. Levels are expressed in geometric mean of fluorescence. (C) Average CD14+ monocytes pSTAT1 level of healthy controls (blue, n = 9) and patients (red, n = 3 with 1–3 repeated measurements per patient) over 2.5 h after introduction of ruxolitinib 1,000 nM to fresh PBMC, stimulated first with IFNγ for 15 min. Levels are expressed in geometric mean of fluorescence. (D) Average decrease per minute in CD14+ monocytes pSTAT1 level in healthy controls (blue, n = 9) and patients (red, n = 3) over 2 h after introduction of ruxolitinib 1,000 nM to fresh PBMC, stimulated first with IFNγ for 15 min. *P < 0.05; **P < 0.01; ***P < 0.001; ****P < 0.0001, by t-test. Quantitative data represent mean ± SEM.
Figure 3
Figure 3
STAT1 protein levels are increased in GOF CD14+ monocytes and CD3+ lymphocytes. (A) GOF patients' (red squares, n = 13) and healthy controls' (blue dots, n = 38) CD14+ monocytes STAT1 protein level, at rest, 15′ and 30′ after IFNγ stimulation, as measured by flow cytometry with anti-STAT1 AF647 antibody. Each red dot represents the average of repeated measurement of one patient (1–3). Each blue dot represents one measurement of a healthy control. Comparisons between the two groups were performed for each time point independently. Levels are expressed in geometric mean of fluorescence. (B) CD3+ cells STAT1 protein level in 12 tested GOF (red) patients compared with healthy controls (blue, n = 27), as measured by flow cytometry. Each red dot represents the average of repeated measurement of one patient (1–4). Each blue dot represents one measurement of a healthy control. (C) Pearson correlation of STAT1 protein level (x axis) vs. peak pSTAT1 level (y axis) in CD14+ monocytes of both patients (red squares, n = 8) and healthy controls (blue circles, n = 12) as measured by flow cytometry. Levels are presented in geometric mean of fluorescence. (D) CD14+ monocytes pSTAT1 level corrected by STAT1 protein level in healthy controls (blue dots, n = 5–20 per time point) and GOF patients (red squares, n = 4–11 per time point) 15–180′ after IFNγ stimulation. Data is presented in percentages of healthy controls average level. *P < 0.05; **P < 0.01; ***P < 0.001; ****P < 0.0001, by t test (A,B,D), and Pearson correlation (C). Quantitative data represent mean ± SEM.
Figure 4
Figure 4
Increased level of PBMC STAT1 protein and pSTAT1 in GOF patients—by immunoblotting. (A) Pt. 5 pSTAT1 and STAT1 protein levels at rest and after 30′ of IFNγ stimulation, compared with a healthy control, as measured by immunoblotting (blots of STAT1 and Beta Actin are from the same gel. pSTAT1 blots are from a duplicate gel of the same samples). (B) STAT1 protein/Beta actin ratio at rest and after 30′ of IFNγ stimulation in five patients (red squares) compared with eight healthy controls (blue dots), as measured by immunoblotting. Data is presented in percentages of the same day healthy controls' average ratio of STAT1/Beta actin, as measured by optical densitometry (OD). (C) pSTAT1/Beta actin ratio after 30′ of IFNγ stimulation in five patients (red squares) compared to eight healthy controls (blue dots), as measured by immunoblotting. Data is presented in percentages of the same day healthy controls' average ratio of pSTAT1/Beta actin, as measured by optical densitometry (OD). (D) pSTAT1/STAT1 protein ratio, 30 min after IFNγ stimulation level in healthy controls (blue dots, n = 8) and GOF patients (red squares, n = 5) as measured by immunoblotting. Data is presented in percentages of the same day healthy controls' pSTAT1/STAT1average ratio as measured by optical densitometry (OD). *P < 0.05; **P < 0.01, by Mann-Whitney (B) or t test (C,D). Quantitative data represent median with interquartile range (B) or mean ± SEM (C,D).
Figure 5
Figure 5
STAT1 and pSTAT1 normalization with oral ruxolitinib treatment. (A) Patient five (red line) and two healthy controls (blue line) CD14+ monocytes pSTAT1 level 0–180′ after IFNγ stimulation, as measured by flow cytometry while the patient was ruxolitinib naïve. Levels are expressed in geometric mean of fluorescence. (B) Patient five (red squares) and two healthy controls (blue dots) CD14+ monocytes STAT1 protein level at rest and 15 min after IFNγ stimulation, as measured by flow cytometry while the patient was ruxolitinib naïve. (C) Patient five (red line) and two healthy controls (blue line), CD14+ monocytes pSTAT1 level 0–60′ after IFNγ stimulation while the patient was on oral ruxolitinib 20 mg BID. (D) Patient five (red squares) and two healthy controls (blue dots) CD14+ monocytes STAT1 protein level at rest and up to 60 min after IFNγ stimulation while the patient was on oral ruxolitinib 20 mg BID. (E) Patient five (red line) and a healthy control (blue line) CD14+ monocytes pSTAT1 protein level 0–135′ min after IFNγ stimulation, 5 days after the patient stopped ruxolitinib treatment. (F) Patient five (red squares) and a healthy control (blue dots) CD14+ monocytes STAT1 protein level at rest and 15 min after IFNγ stimulation, 5 days after the patient stopped ruxolitinib treatment. Quantitative data represent mean ± SEM.
Figure 6
Figure 6
Increased STAT2 protein level in patients CD14+ monocytes. Patients 13 and 14 (Red lines) CD14+ monocytes pSTAT1 level over 60 min following IFNα (A) and IFNγ (B) stimulation compared to two healthy donors' average level (blue line), as measured by flow cytometry with an anti pSTAT1 PerCP-Cy 5.5 antibody. Levels are expressed in geometric mean of fluorescence. (C) Patients (n = 6, red squares) and healthy donors (n = 11–12, blue dots) pSTAT1 level 30 min after IFNα or IFNγ stimulation as measured by flow cytometry. (D) Patients (n = 6, red squares) and healthy donors (n = 10–12, blue dots) STAT1 protein level 30 min after IFNα or IFNγ stimulation and baseline STAT2 protein level, as measured by flow cytometry. *P < 0.05; **P < 0.01; ***P < 0.001; ****P < 0.0001, by t test (C,D). Quantitative data represent mean ± SEM (A–D).
Figure 7
Figure 7
Rapid increase in STAT1 protein level after IFNγ stimulation in both patients and healthy donors. (A) Change in STAT1 protein level in CD14+ monocytes after IFNγ stimulation in healthy controls (blue line, n = 4–16 per time point) and GOF patients (red line, n = 3–10 per time point). Change is expressed in percentages from the baseline level. STAT1 level was measured using flow cytometry (B) Change in STAT1 protein level in PBMC 30 min after IFNγ stimulation in healthy controls (blue dots, n = 9) and GOF patients (red squares, n = 5). Change is expressed in percentages from the baseline level. STAT1 level was measured using immunoblotting. (C) Patient five STAT1 protein level with and without IFNγ stimulation (30′), compared to a healthy control, as measured by immunoblotting using four different antibodies targeting four different sites of STAT1 protein [two at the C-terminus and two at the N- terminus (see methods)]. The same patient sample was used on three separate membranes. *P < 0.05, by t-test. Quantitative data represent mean ± SEM (A-B).
Figure 8
Figure 8
Similar STAT1 degradation rate in patients and healthy donors. (A) CD11b+/CD14+/CD64+ live monocytes STAT1 protein level in fresh PBMC of patients (red lines, n = 6) and healthy controls (blue lines, n = 8) at baseline and after 4 and 16 h with cycloheximide (CHX) 100 ng/ml (dotted lines) and without cycloheximide (solid lines), as measured by flow cytometry. Levels are expressed in geometric mean of fluorescence. (B) Average absolute decrease in STAT1 protein per hour in the monocytes of healthy donors (blue dots, n = 8) and patients (red squares, n = 6), during the first 4 h (0–4) and the last 12 h (4–16) of cycloheximide incubation. (C) Rate of decrease (%) in STAT1 protein level in healthy donor (blue line, n = 8) and patient (red line, n = 6) monocytes during the first 4 h (0–4) and the last 12 h (4–16) of cycloheximide incubation. (D) CD3+ lymphocyte STAT1 protein level in fresh PBMC of patients (red lines, n = 6) and healthy controls (blue lines, n = 8) at baseline and after 4 and 16 h with cycloheximide (CHX) 100 ng/ml (dotted lines) and without cycloheximide (solid lines) as measured by flow cytometry. Levels are expressed in geometric mean of fluorescence. *P < 0.05; **P < 0.01; ***P < 0.001, by t-test. Quantitative data represent mean ± SEM (D).
Figure 9
Figure 9
Increased STAT1 mRNA expression in GOF PBMC. (A) Average fresh PBMC STAT1 mRNA relative expression at baseline and after 16 h in vitro incubation with and without IFNγ stimulation, in healthy controls (blue dots, n = 7) and GOF patients (red squares, n = 6). Levels are expressed in percentages of same day healthy controls median STAT1 mRNA relative expression. Each dot or square represent an average of 1–3 biological replicates. Beta actin was used as the normalizing gene. (B) CD3+ and CD14+ cells STAT1 protein level in the samples used for the RNA extraction of the seven healthy controls and six GOF patients in (A). STAT1 levels were measured by flow cytometry and are expressed in geometric mean of fluorescence. (C) Levels of IFNγ receptors (R) 1 and 2 in healthy controls (blue dots; n = 13–15) and GOF patients (red squares, n = 7), as measured by flow cytometry. Data is represented in geometric mean of fluorescence. Each dot or square represents the average of two technical duplicates. (D) JAK2 protein level in healthy controls (blue dots, n = 2–12 per time point) and GOF patients (red square, n = 1–5 per time point) at rest (time o) and up to 2 h of IFNγ stimulation, as measured by flow cytometry. Data is represented in geometric mean of fluorescence. *P < 0.05; **P < 0.01; ****P < 0.0001, by t-test, Quantitative data represent mean ± SEM.

References

    1. van de Veerdonk FL, Plantinga TS, Hoischen A, Smeekens SP, Joosten LA, Gilissen C, et al. . STAT1 mutations in autosomal dominant chronic mucocutaneous candidiasis. N Engl J Med. (2011) 365:54–61. 10.1056/NEJMoa1100102 - DOI - PubMed
    1. Liu L, Okada S, Kong XF, Kreins AY, Cypowyj S, Abhyankar A, et al. . Gain-of-function human STAT1 mutations impair IL-17 immunity and underlie chronic mucocutaneous candidiasis. J Exp Med. (2011) 208:1635–48. 10.1084/jem.20110958 - DOI - PMC - PubMed
    1. Sampaio EP, et al. . Signal transducer and activator of transcription 1 (STAT1) gain-of-function mutations and disseminated coccidioidomycosis and histoplasmosis. J Allergy Clin Immunol. (2013) 131:1624–34. 10.1016/j.jaci.2013.01.052 - DOI - PMC - PubMed
    1. Uzel G, Sampaio EP, Lawrence MG, Hsu AP, Hackett M, Dorsey MJ, et al. . Dominant gain-of-function STAT1 mutations in FOXP3 wild-type immune dysregulation-polyendocrinopathy-enteropathy-X-linked-like syndrome. J Allergy Clin Immunol. (2013) 131:1611–23. 10.1016/j.jaci.2012.11.054 - DOI - PMC - PubMed
    1. Mizoguchi Y, Tsumura M, Okada S, Hirata O, Minegishi S, Imai K, et al. . Simple diagnosis of STAT1 gain-of-function alleles in patients with chronic mucocutaneous candidiasis. J Leukoc Biol. (2014) 95:667–76. 10.1189/jlb.0513250 - DOI - PMC - PubMed

Publication types

Substances