. 2019 Jul 11:10:1501.
doi: 10.3389/fimmu.2019.01501. eCollection 2019.

Innate-Like Lymphocytes Are Immediate Participants in the Hyper-Acute Immune Response to Trauma and Hemorrhagic Shock

Affiliations

Innate-Like Lymphocytes Are Immediate Participants in the Hyper-Acute Immune Response to Trauma and Hemorrhagic Shock

Joanna Manson et al. Front Immunol. .

Abstract

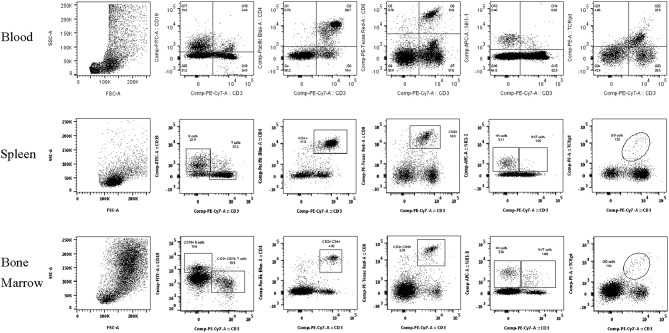
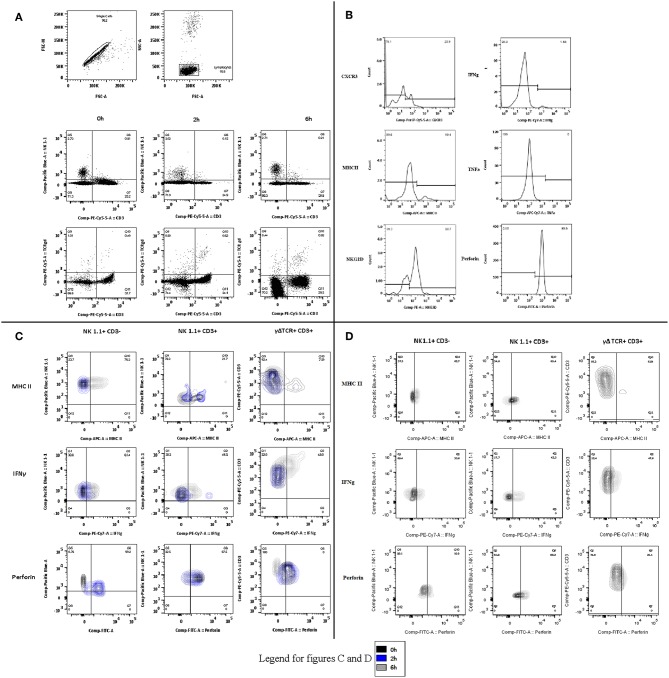
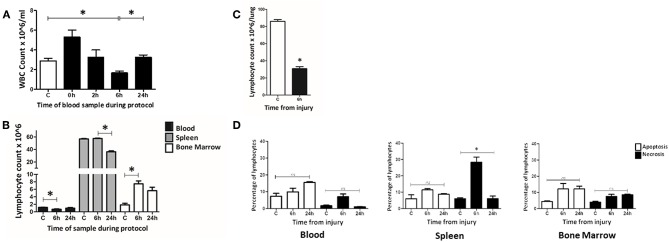
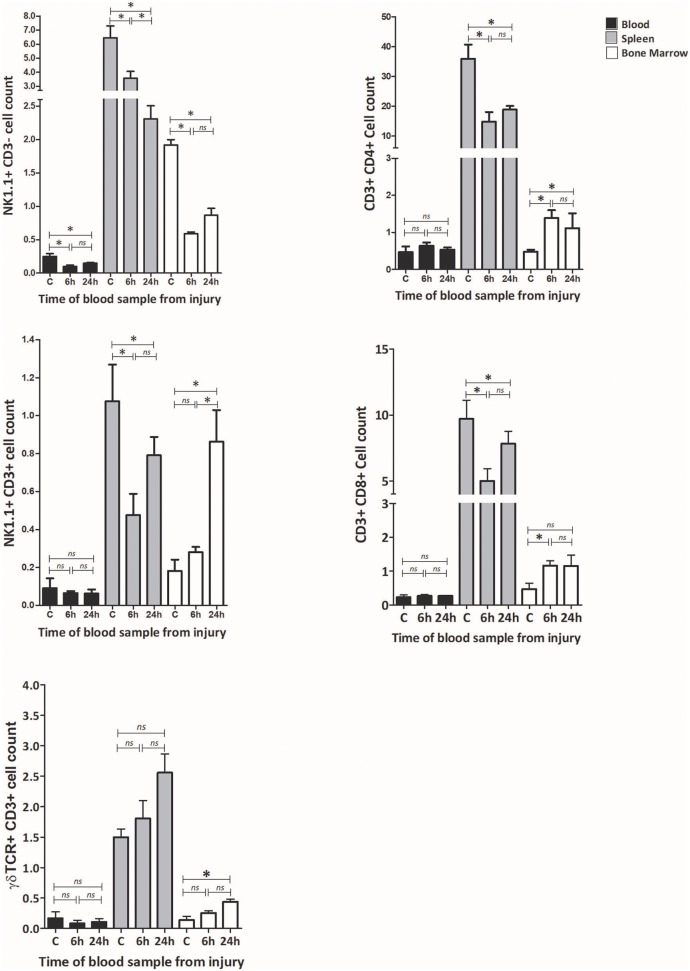
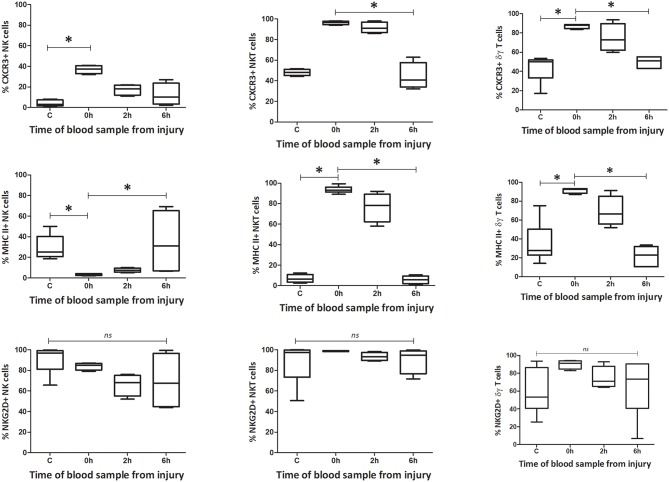
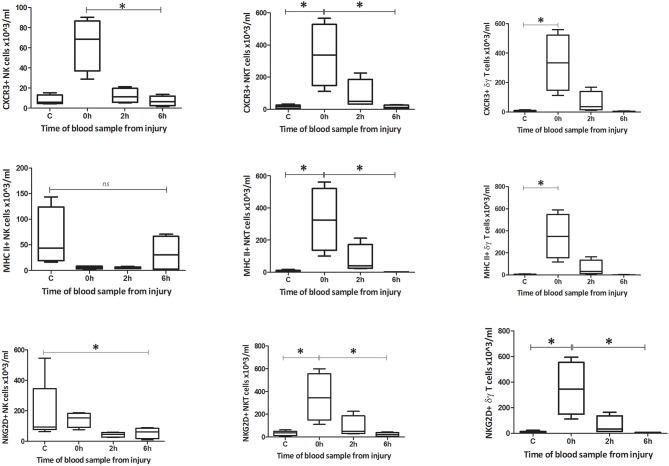
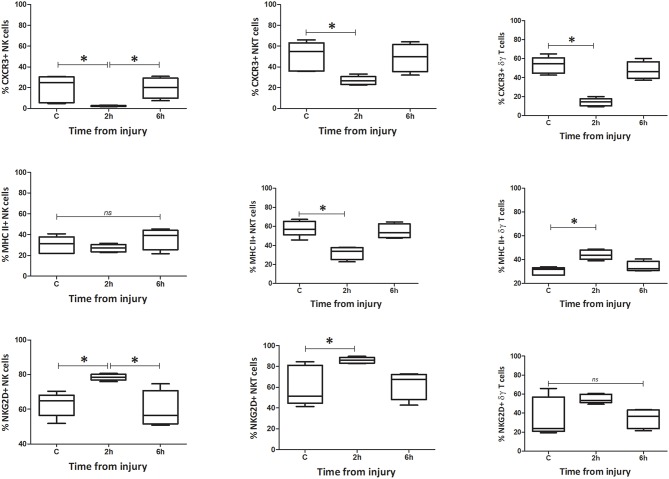
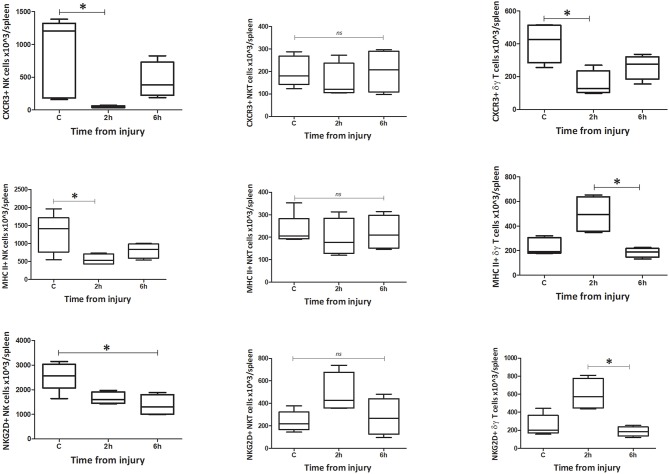
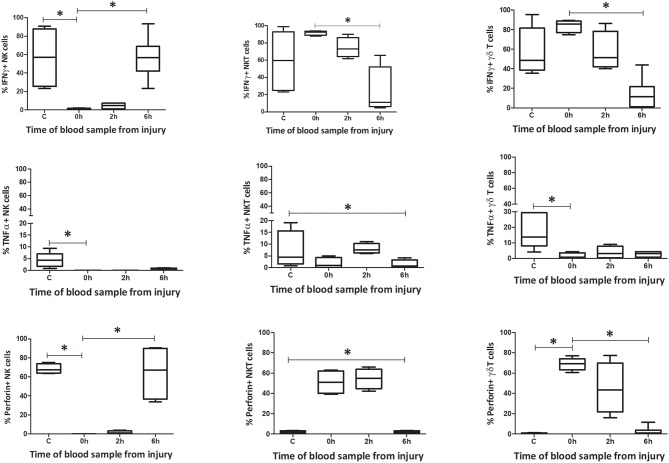
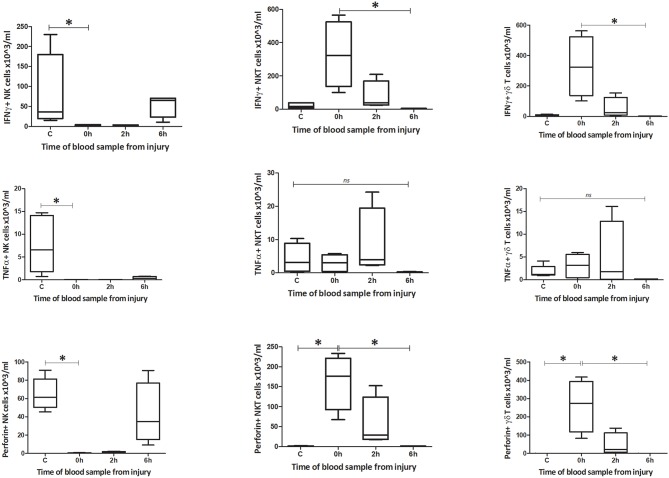
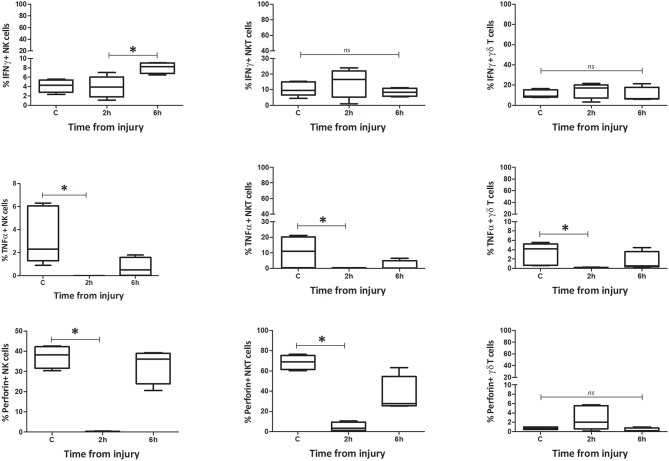
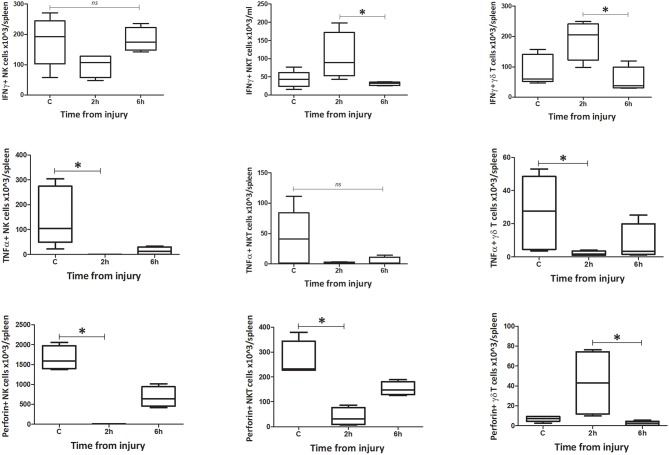
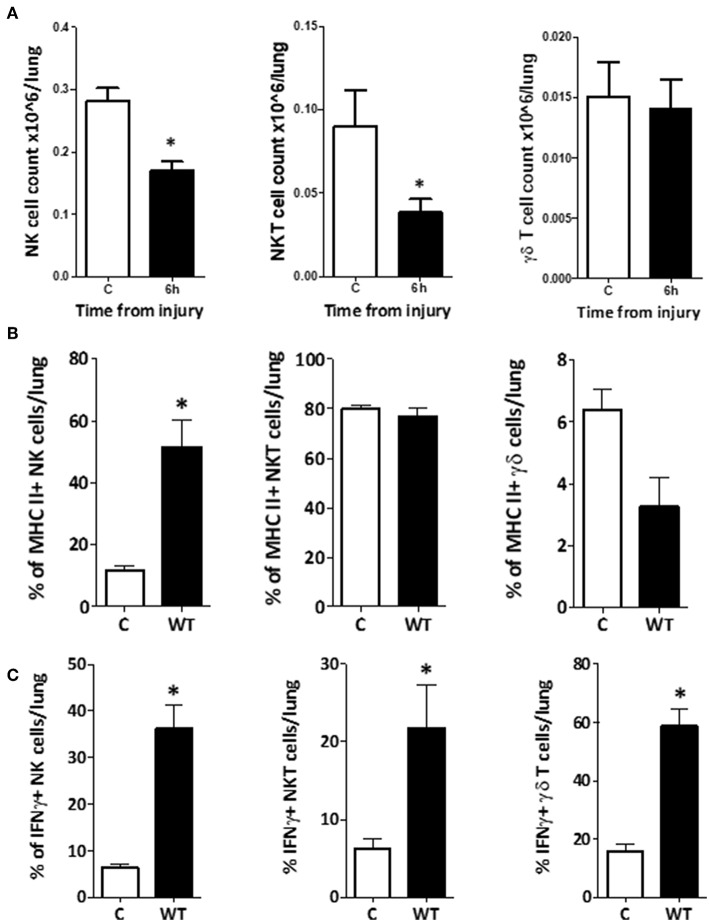
Adverse outcomes following severe traumatic injury are frequently attributed to a state of immunological dysfunction acquired during treatment and recovery. Recent genomic evidence however, suggests that the trajectory toward development of multiple organ dysfunction syndrome (MODS) is already in play at admission (<2 h following injury). Improved understanding of the molecular events during the hyper-acute immunological response to trauma, <2 h following injury, may reveal opportunities to ameliorate organ injury and expedite recovery. Lymphocytes have not previously been considered key participants in this early response; however, two observations in human trauma patients namely, raised populations of circulating NKT and NK cells during the hyper-acute phase and persistent lymphopenia beyond 48 h show association with the development of MODS during recovery. These highlight the need for greater understanding of lymphocyte function in the hyper-acute phase of inflammation. An exploratory study was therefore conducted in a well-established murine model of trauma and hemorrhagic shock (T&HS) to investigate (1) the development of lymphopenia in the murine model and (2) the phenotypic and functional changes of three innate-like lymphocyte subsets, NK1.1+ CD3-, NK1.1+ CD3+, γδTCR+ CD3+ cells, focusing on the first 6 h following injury. Rapid changes in phenotype and function were demonstrated in these cells within blood and spleen, but responses in lung tissue lagged behind. This study describes the immediacy of the innate-like lymphocyte response to trauma in different body compartments and considers new lines for further investigation to develop our understanding of MODS pathogenesis.

Keywords: MODS; immune response; innate immunity; innate-like lymphocytes; major trauma; trauma; trauma immunology.


Figures

Figure 1
Figure 1
Lymphocyte subset flow cytometry gating strategies. Representative flow cytometry plots demonstrating the gating strategy for the lymphocyte subset identification after removal of doublets and selection of lymphocyte population in (A) Blood, (B) Spleen, and (C) Bone Marrow.
Figure 2
Figure 2
Phenotype and function flow cytometry gating strategies (A) Gating strategies for phenotype and function experiments in blood, spleen, and lung. Following identification of single cells, the lymphocyte population was selected and divided by CD3 and either NK1.1 or TCRγδ. Representative plots are displayed for 0, 2, and 6 h. (B) Phenotype and function. The phenotype markers (CXCR3, MHCII, and NKG2D) and functional markers (Intracellular IFNγ, TNFα, and perforin) were then examined and recorded as percentage of positive cells for each lymphocyte subset. Representative histograms are displayed. (C) Changes in blood over time. Contours plots were overlaid to demonstrate the shifts in phenotype and function within each lymphocyte subset at the different sample points in the protocol. Representative plots of NK1.1 CD3–, NK1.1 CD3+, and CD3 TCRγδ are displayed for blood-borne cells at 0, 2, and 6 h. (D) Lung lymphocytes. As in (C), the same process was followed to demonstrate the changes by cell type over time, in this case only Control and 6 h.
Figure 3
Figure 3
At 6 h following T&HS lymphocyte count was reduced in blood and lung but static or increased in the lymphoid tissues. (A) Peripheral blood leucocyte count was determined manually on samples taken at intervals through the T&HS protocol. An initial leukocytosis at the onset of hemorrhagic shock was followed by leucopenia at 6 h. This returned to baseline by 24 h. C = 2.9 (2.6–3.1), 0 h = 5.3 (4.6–6.0), 2 h = 3.3 (2.5–4.0), 6 h = 1.7 (1.5–1.8), 24 h = 3.3 (3.0–3.5). Data are presented as mean (SEM) count × 106/ml and tested using Kruskal Walis and Dunn's multiple comparison post-test. (B) The lymphocyte population in blood, spleen and bone marrow was quantified, at intervals through the protocol, using flow cytometry. The lymphopenia demonstrated in blood at 6 h was not mirrored in the other lymphoid organ compartments. In spleen, lymphocyte count was static at 6 h but reduced by 24 h. In bone marrow, the lymphocyte count had increased by 6 h and remained above baseline at 24 h. Control(C) denotes a naïve subject of the same strain and age. C, 6 h, 24 h = Blood: 1.2 (0.03), 0.7 (0.11), 1.0 (0.18). Spleen: 56.7 (0.71), 57.5 (0.57), 36.3 (1.36). Bone marrow: 1.9 (0.43), 7.5 (0.77), 5.6 (0.93). Data are presented as mean (SEM) absolute cell count × 106/ml of blood/spleen/both hind limbs (n = 6–19). Data were tested using Kruskal Walis with Dunn's multiple comparisons test. All had a p-value < 0.01 and *denotes the positive comparisons. (C) The lymphocyte count in lung was examined at 6 h using flow cytometry. Lung was selected as a representative, non-lymphoid organ. By 6 h, the absolute count of lymphocytes in the lung tissue had reduced almost threefold C = 86 (84–87), 6 h = 31 (28–32), p < 0.01 (n = 6). Data are presented as mean (SEM) and tested with Mann Whitney U test, *denotes p < 0.05. (D) Evidence of widespread lymphocyte apoptosis was sought using a cell death assay on samples of blood, spleen, and bone marrow taken at 6 and 24 h following T&HS. Apoptosis was defined as Annexin V + 7AAD- and necrosis was defined as Annexin V+ 7AAD+. An increase in necrosis was observed in the spleen at 6 h. In all other organs and timepoints, there were no significant changes in apoptosis or cell death over the 24 h protocol. Blood: Apoptosis = 6 (6–9), 7 (7–10), 16 (15–16), p = 0.15. Necrosis = 2 (2–2), 7 (4–10), 1 (1–1), p = 0.08. Spleen: Apoptosis = 4 (4–7), 12 (10–13), 9 (9–9), p = 0.10, Necrosis = 5 (4–6), 29 (10–32), 6 (5–7), p = 0.02. Bone Marrow: Apoptosis = 4 (4–5), 12 (9–15), 12 (11–13), p = 0.10, Necrosis = 4 (3–5), 7 (6–8), 9 (8–9), p = 0.06. C denotes a naïve subject of the same strain and age. Data are presented as median (IQR) and tested with Kruskal Wallis and Dunn's comparison of all columns, *denotes p < 0.05.
Figure 4
Figure 4
T&HS provokes dynamic changes in lymphocyte subsets which are cell specific, compartment specific and time dependent. Flow cytometry was used to examine the lymphocyte subset populations at 6 and 24 h following injury. Blood, spleen and bone marrow were the compartments selected for examination. Changes in peripheral blood populations of NK 1.1+ CD3– cells were observed at 6 h, while NK1.1+ CD3+, γδTCR+ CD3+ cells, CD3+ CD4+, and CD3+ CD8+ cell populations remained unchanged. In spleen, a decrease in the population of NK 1.1+ CD3–, NK1.1+ CD3+, CD3+ CD4+, and CD3+ CD8+ was observed by 6 h, while γδTCR+ CD3+ cells remained broadly unchanged. In bone marrow, the NK 1.1+ CD3– cell population fell by 6 h while the other cell populations were seen to increase. Examination of lymphocyte sub-set populations revealed dynamic shifts within the immune compartments, principally within the first 6 h. Control (C) denotes a naïve subject of the same strain and age. Data are presented as mean (SEM) absolute cell counts × 106 (per ml of blood, per spleen or per both hind limbs) and tested using Kruskal Wallis with Dunn's multiple comparison of columns, *denotes p < 0.05.
Figure 5
Figure 5
Innate-like cells in blood change their phenotype and function during the first 6 h following T&HS. To determine whether the innate-like cells in this study changed their phenotype after T&HS, flow cytometry was conducted on blood and spleen taken at several sample points during the protocol. This revealed dynamic changes in all three cells, within the first 6 h of injury. Percentage blood phenotype: percentage of CXCR3, MHC II, and NKG2D positive cells. Data are presented as median (min-max) and tested with Kruskal Wallis and Dunns multiple comparison test, *denotes p < 0.05.
Figure 6
Figure 6
Absolute cell count for blood phenotype: Number of CXCR3, MHC II, and NKG2D positive cells in blood (n = 5–8). Data are presented as median (min-max) and tested with Kruskal Wallis and Dunns multiple comparison test, *denotes p < 0.05.
Figure 7
Figure 7
Percentage spleen phenotype: percentage of CXCR3, MHC II, and NKG2D positive cells. Data are presented as median (min-max) and tested with Kruskal Wallis and Dunns multiple comparison test, *denotes p < 0.05.
Figure 8
Figure 8
Absolute cell count for spleen phenotype: Number of CXCR3, MHC II, and NKG2D positive cells in spleen (n = 5–8). Data are presented as median (min-max) and tested with Kruskal Wallis and Dunns multiple comparison test, *denotes p < 0.05.
Figure 9
Figure 9
Innate-like cells in the spleen change their phenotype and function during the first 6 h following T&HS. To determine whether the innate-like cells in this study changed their intracellular cytokine levels after T&HS, flow cytometry was conducted on blood and spleen taken at several sample points during the protocol. This revealed extremely dynamic changes in all three cell types, within the first 6 h of injury. Percentage blood: percentage of IFNγ, TNFα, and Perforin positive cells. Data are presented as median (min-max) and tested with Kruskal Wallis and Dunns multiple comparison test, *denotes p < 0.05.
Figure 10
Figure 10
Absolute cell count for blood: number of IFNγ, TNFα, and Perforin positive cells in blood (n = 5–8). Data are presented as median (min-max) and tested with Kruskal Wallis and Dunns multiple comparison test, *denotes p < 0.05.
Figure 11
Figure 11
Percentage spleen: percentage of IFNγ, TNFα, and Perforin positive cells. Data are presented as median (min-max) and tested with Kruskal Wallis and Dunns multiple comparison test. *denotes p < 0.05.
Figure 12
Figure 12
Absolute cell count for spleen: number of IFNγ, TNFα, and Perforin positive cells in spleen (n = 5–8). Data are presented as median (min-max) and tested with Kruskal Wallis and Dunns multiple comparison test, *denotes p < 0.05.
Figure 13
Figure 13
Changes in phenotype and function of innate-like lymphocytes within lung, were comparatively delayed. (A) To investigate whether the innate-like lymphocytes within lung also displayed changes in phenotype or function after T&HS, flow cytometry of a single cell suspension of lung tissue was conducted using the same staining protocol. The total number of NK1.1+ CD3– and NK1.1+ CD3+ cells within the lung reduced by 6 h, but no change in γδ TCR+ CD3+ cells was demonstrated. Cell counts (× 106/lung): NK1.1+ CD3–: 0.28 (0.26–0.30) vs. 0.17 (0.15–0.18), p = 0.02. NK1.1+ CD3+: 0.09 (0.06–0.11) vs. 0.04 (0.03–0.04), p = 0.04. γδ TCR+ CD3+: 0.01 (0.01–0.02) vs. 0.02 (0.01–0.02), p = 0.89, n = 6–8. Control (C) represents a naïve subject of the same strain and age, n = 4–6. Data are presented as mean (SEM) and tested with a Mann Whitney test, *denotes p < 0.05. (B) NK1.1+ CD3– cells in lung tissue upregulated MHCII expression by 6 h following T&HS. Cell surface phenotype markers on NK1.1+ CD3–, NK1.1+ CD3+, and γδ TCR+ CD3+ cell populations were examined in lung tissue, using flow cytometry at 6 h following injury. The NK1.1+ CD3– cell population demonstrated upregulation of MHC II, while NK1.1+ CD3+ MHCII expression remained the same. γδ TCR+ CD3+ cells appeared to downregulate MHCII, although this did not reach significance. NK1.1+ CD3–: C vs. 6h: 12 (2) vs. 52 (9), p = 0.02. NK1.1+ CD3+: C = 80 (2) vs. 77 (4), p = 0.56. γδ TCR+ CD3+: C = 6 (1) vs. 3 (1), p = 0.09. Control (C) denotes a naïve subject of the same strain and age (n = 4–6). Data are presented as median (IQR) and tested with a Mann Whitney test, *denotes p < 0.05. (C) NK1.1+ CD3–, NK1.1+ CD3+, and γδ TCR+ CD3+ cells within lung tissue, all demonstrated an increase in the % of IFNγ+ cells by 6 h following T&HS. To assess activity of innate-like lymphocytes within lung tissue, intracellular IFNγ, TNFα, and perforin were examined using flow cytometry. At 6 h following T&HS more NK1.1+ CD3–, NK1.1+ CD3+, and γδ TCR+ CD3+ cells within lung tissue, were positive for IFNγ compared with their naïve state. No change in TNFα or perforin production was observed. Control (C) denotes a naïve subject of the same strain and age. C vs. 6 h: NK1.1+ CD3– = 6 (1) vs. 36 (5), p = 0.02, NK1.1+ CD3+ = 6 (1) vs. 22 (6), p = 0.02, γδ TCR+ CD3+ = 16 (2) vs. 59 (6), p = 0.02. n = 6–8 and data are presented as median (IQR) and tested with a Mann Whitney test, *denotes p < 0.05.

References

    1. Xiao W, Mindrinos MN, Seok J, Cuschieri J, Cuenca AG, Gao H, et al. . A genomic storm in critically injured humans. J Exp Med. (2011) 208:2581–90. 10.1084/jem.20111354 - DOI - PMC - PubMed
    1. Hranjec T, Swenson BR, Dossett LA, Metzger R, Flohr TR, Popovsky KA, et al. . Diagnosis-dependent relationships between cytokine levels and survival in patients admitted for surgical critical care. J Am Coll Surg. (2010) 210:833–44. 10.1016/j.jamcollsurg.2009.12.042 - DOI - PMC - PubMed
    1. Napolitano LM, Ferrer T, McCarter RJ, Scalea TM. Systemic inflammatory response syndrome score at admission independently predicts mortality and length of stay in trauma patients. J Trauma. (2000) 49:647–52; discussion 652–3. 10.1097/00005373-200010000-00011 - DOI - PubMed
    1. Gebhard F, Pfetsch H, Steinbach G, Strecker W, Kinzl L, Brückner UB. Is interleukin 6 an early marker of injury severity following major trauma in humans? Arch Surg. (2000) 135:291–5. 10.1001/archsurg.135.3.291 - DOI - PubMed
    1. Minei JP, Cuschieri J, Sperry J, Moore EE, West MA, Harbrecht BG, et al. . The changing pattern and implications of multiple organ failure after blunt injury with hemorrhagic shock*. Crit Care Med. (2012) 40:1129–35. 10.1097/CCM.0b013e3182376e9f - DOI - PMC - PubMed

Publication types

LinkOut - more resources