. 2019 Jul 12:10:910.
doi: 10.3389/fpls.2019.00910. eCollection 2019.

Characterization of the Wood Mycobiome of Vitis vinifera in a Vineyard Affected by Esca. Spatial Distribution of Fungal Communities and Their Putative Relation With Leaf Symptoms

Affiliations

Characterization of the Wood Mycobiome of Vitis vinifera in a Vineyard Affected by Esca. Spatial Distribution of Fungal Communities and Their Putative Relation With Leaf Symptoms

Giovanni Del Frari et al. Front Plant Sci. .

Abstract

Esca is a disease complex belonging to the grapevine trunk diseases cluster. It comprises five syndromes, three main fungal pathogenic agents and several symptoms, both internal (i.e., affecting woody tissue) and external (e.g., affecting leaves and bunches). The etiology and epidemiology of this disease complex remain, in part, unclear. Some of the points that are still under discussion concern the sudden rise in disease incidence, the simultaneous presence of multiple wood pathogens in affected grapevines, the causal agents and the discontinuity in time of leaf symptoms manifestation. The standard approach to the study of esca has been mostly through culture-dependent studies, yet, leaving many questions unanswered. In this study, we used Illumina® next-generation amplicon sequencing to investigate the mycobiome of grapevines wood in a vineyard with history of esca. We characterized the wood mycobiome composition, investigated the spatial dynamics of the fungal communities in different areas of the stem and in canes, and assessed the putative link between mycobiome and leaf symptoms. An unprecedented diversity of fungi is presented (289 taxa), including five genera reported for the first time in association with grapevines wood (Debaryomyces, Trematosphaeria, Biatriospora, Lopadostoma, and Malassezia) and numerous hitherto unreported species. Esca-associated fungi Phaeomoniella chlamydospora and Fomitiporia sp. dominate the fungal community, and numerous other fungi associated with wood syndromes are also encountered (e.g., Eutypa spp., Inonotus hispidus). The spatial analysis revealed differences in diversity, evenness and taxa abundances, the unique presence of certain fungi in specific areas of the plants, and tissue specificity. Lastly, the mycobiome composition of the woody tissue in proximity to leaves manifesting 'tiger stripes' symptoms of esca, as well as in leaf-symptomatic canes, was highly similar to that of plants not exhibiting any leaf symptomatology. This observation supports the current understanding that leaf symptoms are not directly linked with the fungal communities in the wood. This work builds to the understanding of the microbial ecology of the grapevines wood, offering insights and a critical view on the current knowledge of the etiology of esca.

Keywords: Vitis; esca disease; grapevine trunk diseases; metabarcoding; microbial ecology; mycobiome.


Figures
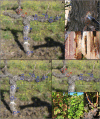
FIGURE 1
FIGURE 1
Sampling points in perennial wood or canes of grapevine cv Cabernet sauvignon. (GU) Graft union, (T) Trunk, (UT) Upper trunk, (A1) Arm 1, (S1) Spur 1, (A2) Arm 2, (S2) Spur 2, (SA) Symptomatic arm, (SS) Symptomatic spur. Cordon (1) presented healthy leaves in all ten sampled plants, while cordon (2) presented leaf symptoms, in canes departing from SS, in five of the sampled plants. Red circles indicate wood sampled in proximity of symptomatic leaves, blue circles indicate wood not associated with leaf symptoms. (A) Sampling points used to characterize the mycobiome of perennial wood – objective 1 –. (B) Sampling procedure involved using a gimlet to drill the wood and extract wood cores. (C) Cores of wood extracted with a gimlet (red arrows indicate wood symptomatology). From left to right: brown wood streaking, wood necrosis, extensive wood necrosis, wood decay-white rot-wood necrosis. (D) Sampling points used to test the spatial distribution of fungal communities – objective 2 –. (E) Sampling points used to examine the mycobiome present in the wood in proximity of symptomatic (AS, SS) and healthy (A1, S1) leaves – objective 3 –. (F) From left to right: symptomatic canes sampled from plants with leaf symptoms, asymptomatic canes sampled from plants with no leaf symptoms in either of the cordons or with leaf symptoms in only one of the two cordons; the sampling area for each cane is indicated by the blue rectangle.
FIGURE 2
FIGURE 2
Box plots of diversity indexes (Shannon, Pielou’s evenness) of the fungal communities present in different sampling areas of perennial wood (Graft Union, Trunk, Upper trunk, Arm 1, Spur 1, Arm 2, and Spur 2) and canes. Vertical boxes denote the median, the upper and lower quartiles, and the extremes of data. The black, horizontal brackets at the top of the figure denote statistical comparisons of the two tissues at each end of the bracket, calculated using a one-way ANOVA with post hoc Tukey’s HSD. Statistical differences are shown by asterisks, where P < 0.05 = *.
FIGURE 3
FIGURE 3
Non-metric multidimensional scaling (NMDS) plots based on Jaccard’s index. Fungal communities present in different tissue types in grapevine. (A) Shows all samples ordinated together, while (B) is the same data, split up per tissue type. Ellipses illustrate the multivariate normal distribution of samples within the same tissue type.
FIGURE 4
FIGURE 4
Barplots of the relative abundance of the 20 most abundant taxa identified to species (s_) or genus (g_) level, found in different sampling areas of the stem and in the canes of grapevine. ‘Unassigned’ are taxa identified to a lower taxonomic level than genus, ‘Others’ are taxa not included in the 20 most abundant.
FIGURE 5
FIGURE 5
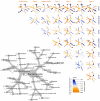
Differential heat tree matrix depicting the change in taxa abundance between different tissue types, for ascomycetes, represented in the dataset (RA > 0.01%). The size of the individual nodes in the gray cladogram depicts the number of taxa identified at that taxonomic level. The smaller cladograms show pairwise comparisons between each tissue type: an orange node indicates a higher abundance of the taxon in the tissue type stated on the abscissa, than in the tissue type stated on the ordinate. A blue node indicates the opposite. Taxa identified as statistically differently represented, according to the Wilcoxon test, are tagged with a black star.
FIGURE 6
FIGURE 6
Differential heat tree matrix depicting the change in taxa abundance between different tissue types, for basidiomycetes, represented in the dataset (RA > 0.01%). The size of the individual nodes in the gray cladogram depicts the number of taxa identified at that taxonomic level. The smaller cladograms show pairwise comparisons between each tissue group: an orange node indicates a higher abundance of the taxon in the tissue group stated on the abscissa, than in the tissue group stated on the ordinate. A blue node indicates the opposite. Taxa identified as statistically differently represented, according to the Wilcoxon test, are tagged with a black star.
FIGURE 7
FIGURE 7
Non-metric multidimensional scaling (NMDS) plots based on Jaccard’s index. Fungal communities present in different tissue types in grapevine. (A) Communities found in the perennial wood in proximity of symptomatic leaves (‘Symptomatic_arm’) or of asymptomatic leaves, either in symptomatic plants (‘Asymptomatic_arm symptomatic_plant’) or in asymptomatic plants (‘Asymptomatic_arm asymptomatic_plant’). (B) Communities found in canes with manifested leaf symptoms (‘Symptomatic_cane’) or asymptomatic, but coming from symptomatic plants (‘Asymptomatic_cane symptomatic_plant’) or asymptomatic plants (‘Asymptomatic_cane asymptomatic_plant’). Ellipses illustrate the multivariate normal distribution of samples within the same tissue group.
FIGURE 8
FIGURE 8
Barplots of the relative abundance of the 20 most abundant taxa identified to species (s_), genus (g_) or family (f_) level. ‘Unassigned’ are taxa identified to a lower taxonomic level than family. ‘Others’ are taxa not included in the 20 most abundant. (A) Communities found in the PW in proximity of symptomatic leaves (‘Symptomatic_arm’) or of asymptomatic leaves, either in symptomatic plants (‘Asymptomatic_arm symptomatic_plant’) or in asymptomatic plants (‘Asymptomatic_arm asymptomatic_plant’). (B) Communities found in canes with manifested leaf symptoms (‘Symptomatic_cane’) or asymptomatic, but coming from symptomatic (‘Asymptomatic_cane symptomatic_plant’) or asymptomatic plants (‘Asymptomatic_cane asymptomatic_plant’).
FIGURE 9
FIGURE 9
Differential heat tree matrix depicting the change in taxa abundance between different tissue groups, perennial wood (A) and canes (B), represented in the dataset (RA > 0.01%). The size of the individual nodes in the gray cladogram depicts the number of taxa identified at that taxonomic level. The smaller cladograms show pairwise comparisons between each tissue group, with the color illustrating the log2 fold change: a red node indicates a higher abundance of the taxon in the tissue group stated on the abscissa, than in the tissue group stated on the ordinate. A blue node indicates the opposite. No taxa were identified as statistically differently represented, according to the Wilcoxon test.

References

    1. Abdelfattah A., Wisniewski M., Droby S., Schena L. (2016). Spatial and compositional variation in the fungal communities of organic and conventionally grown apple fruit at the consumer point-of-purchase. Hortic. Res. 3:16047. 10.1038/hortres.2016.47 - DOI - PMC - PubMed
    1. Abou-Mansour E., Couché E., Tabacchi R. (2004). Do fungal naphthalenones have a role in the development of esca symptoms? Phytopathol. Mediterr. 43 75–82.
    1. Ahmed S. A., van de Sande W. W. J., Stevens D. A., Fahal A., van Diepeningen A. D., Menken S. B. J., et al. (2014). Revision of agents of black-grain eumycetoma in the order Pleosporales. Persoonia 33 141–154. 10.3767/003158514X684744 - DOI - PMC - PubMed
    1. Andolfi A., Mugnai L., Luque J., Surico G., Cimmino A., Evidente A. (2011). Phytotoxins produced by fungi associated with grapevine trunk diseases. Toxins 3 1569–1605. 10.3390/toxins3121569 - DOI - PMC - PubMed
    1. Aurand J. M. (2017). “State of the vitiviniculture world market,” in Proceedings of the 38th OIV World Congress of Vine and Wine, Mainz.