. 2019 Jul 3:10:1332-1347.
doi: 10.3762/bjnano.10.132. eCollection 2019.

Nanoscale spatial mapping of mechanical properties through dynamic atomic force microscopy

Affiliations

Nanoscale spatial mapping of mechanical properties through dynamic atomic force microscopy

Zahra Abooalizadeh et al. Beilstein J Nanotechnol. .

Abstract

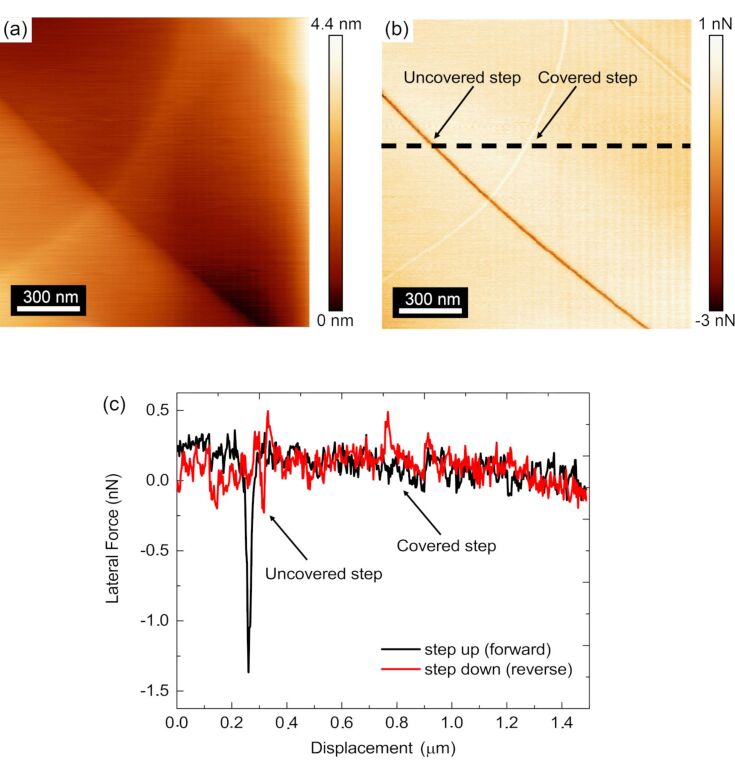
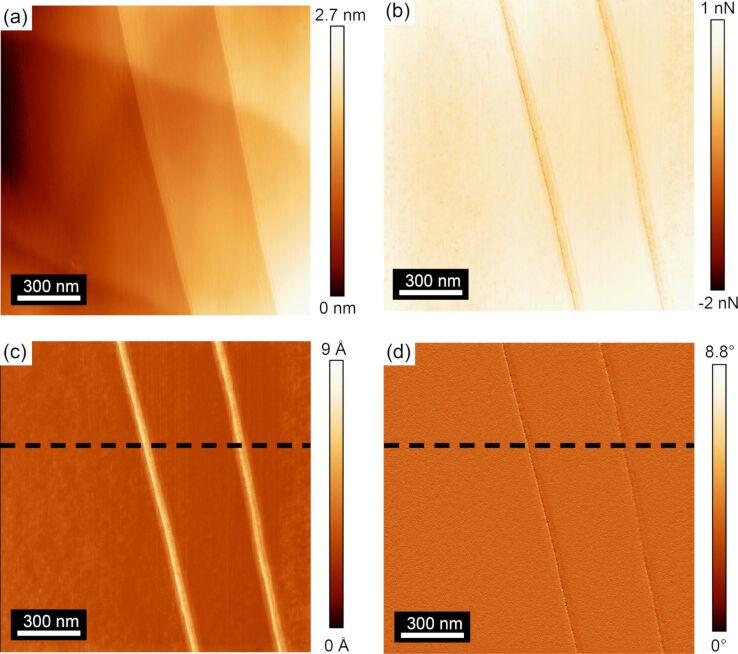
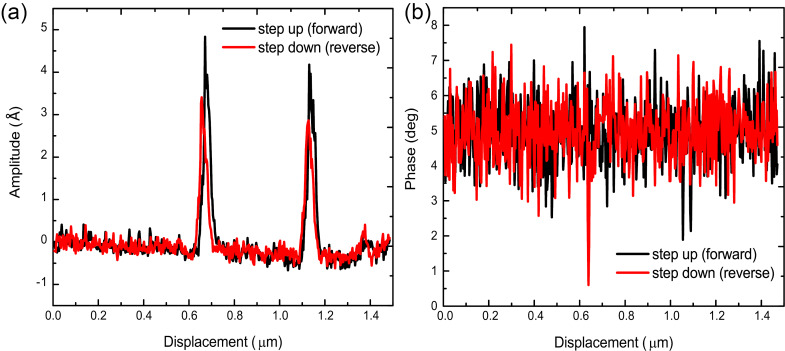
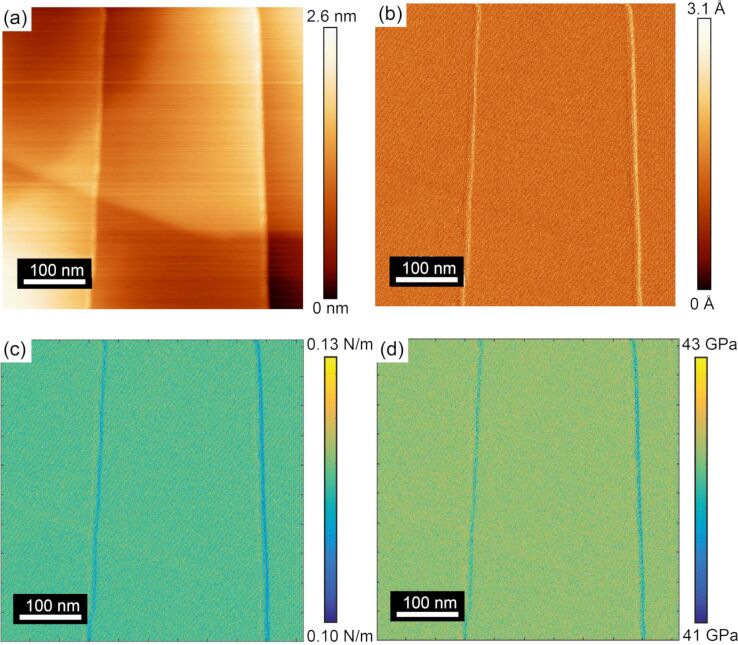
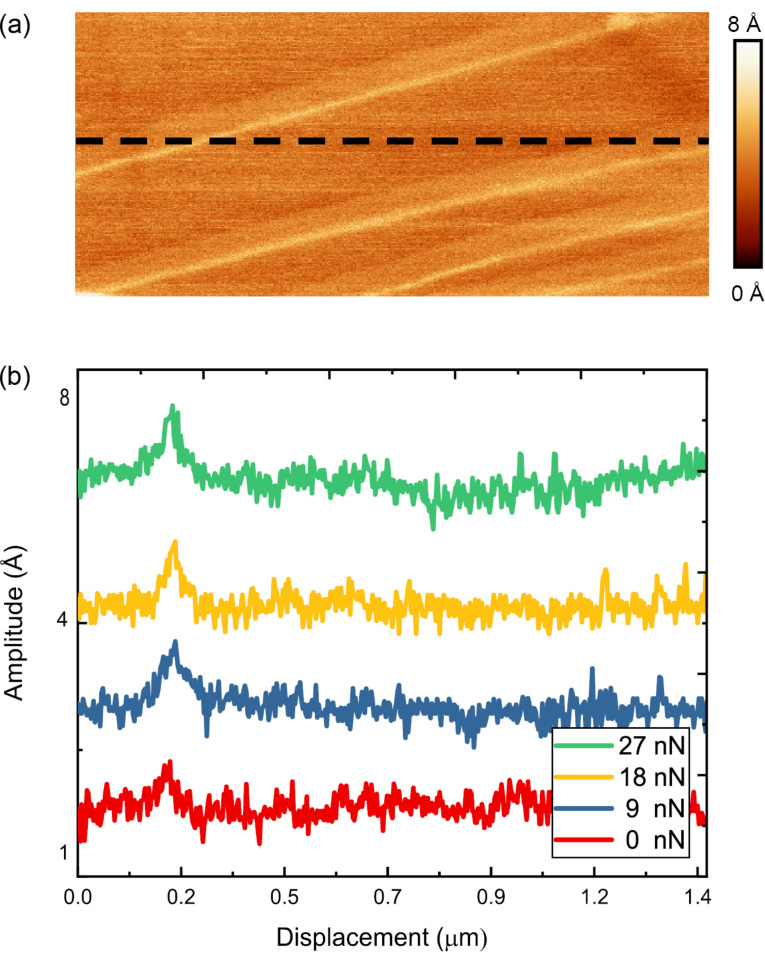
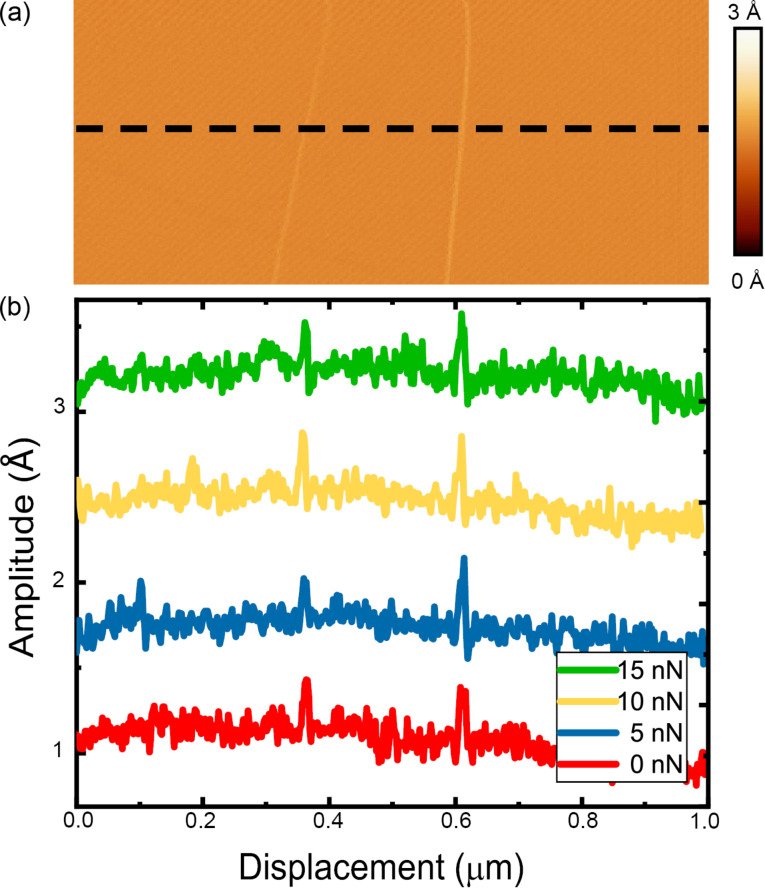
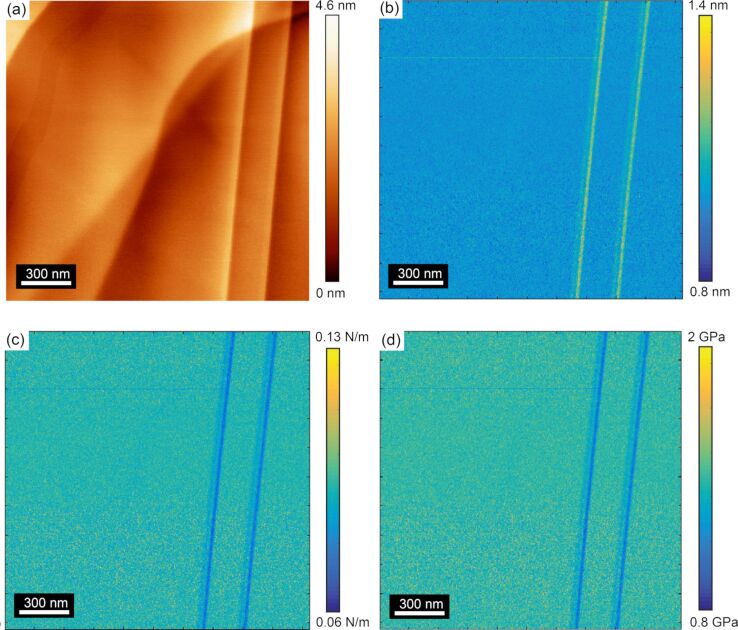
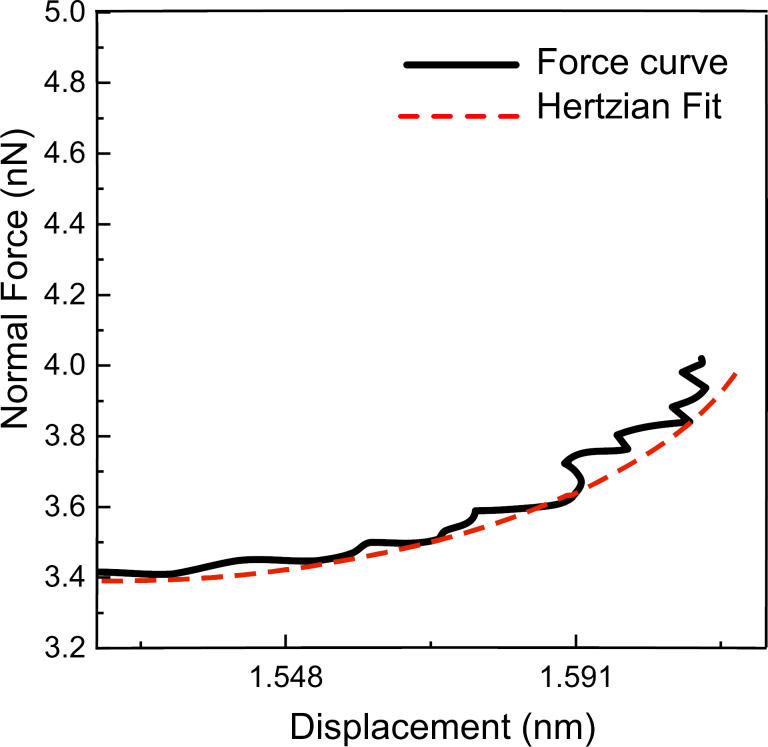
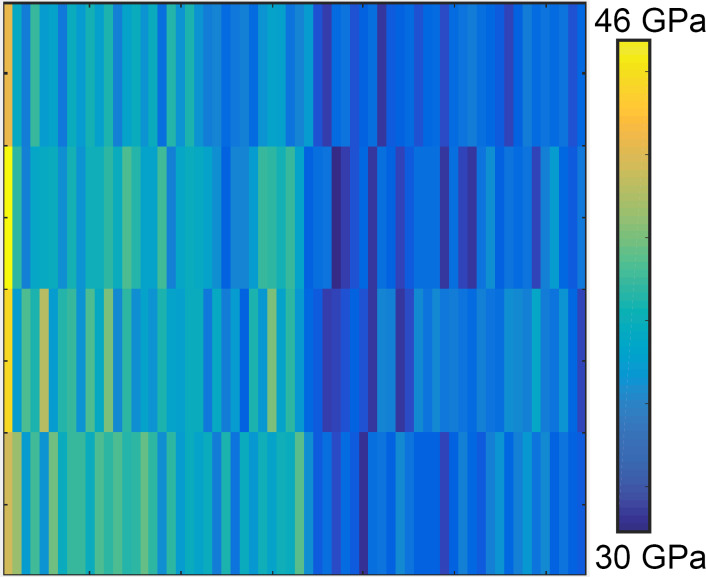
Dynamic atomic force microscopy (AFM) was employed to spatially map the elastic modulus of highly oriented pyrolytic graphite (HOPG), specifically by using force modulation microscopy (FMM) and contact resonance (CR) AFM. In both of these techniques, a variation in the amplitude signal was observed when scanning over an uncovered step edge of HOPG. In comparison, no variation in the amplitude signal was observed when scanning over a covered step on the same surface. These observations qualitatively indicate that there is a variation in the elastic modulus over uncovered steps and no variation over covered ones. The quantitative results of the elastic modulus required the use of FMM, while the CR mode better highlighted areas of reduced elastic modulus (although it was difficult to convert the data into a quantifiable modulus). In the FMM measurements, single atomic steps of graphene with uncovered step edges showed a decrease in the elastic modulus of approximately 0.5%, which is compared with no change in the elastic modulus for covered steps. The analysis of the experimental data taken under varying normal loads and with several different tips showed that the elastic modulus determination was unaffected by these parameters.

Keywords: atomic force microscopy; contact resonance (CR) AFM; elastic modulus mapping; force modulation microscopy (FMM); highly oriented pyrolytic graphite (HOPG); mechanical properties; surface science; surface steps.


Figures

Figure 1
Figure 1
TEM image of four different tips employed in the dAFM experiments. The tips are referred to as (a) tip A, (b) tip B, (c) tip C, and (d) tip D in their acquired images. A circle in a red solid line has been drawn to emphasize the selected radius of each tip. Each TEM image has been rotated to compensate for the tilt angle of the AFM cantilever with respect to the plane of the sample surface, thus making a horizontal line in this figure the plane of the surface. The measured tip radii are as follows: (a) 3.0 ± 0.2 nm, (b) 25 ± 5 nm, (c) 10 ± 1 nm, and (d) 15 ± 1 nm and the adhesion force corresponding to the tips is as follows: (a) 4.0 nN, (b) 8 nN, (c) 5.5 nN, and (d) 6 nN. The black dashed line in the bottom indicates the HOPG surface plane.
Figure 2
Figure 2
Schematic of the non-contact/free resonance and contact resonance frequencies of the AFM cantilever used in all experiments (blue lines). Typical frequencies and Q-factors that are measured both in non-contact (f = 15 kHz, Q = 100,000) and in contact mode (f = 70 kHz, Q = 200) are shown on the graph. Excitation frequencies used in CF-AFM and FMM modes are shown with red lines. The FMM measurement has a range of excitation frequency which is smaller than the first free resonance of the cantilever and above 1 kHz.
Figure 3
Figure 3
AFM (a) topographic and (b) reverse scan direction lateral force maps of the HOPG obtained by FMM. The covered and uncovered single atomic steps have been labeled in (a) to specify their locations. A dashed black line in (b) shows the location where the lateral force profile in (c) was obtained from, which crosses over both the uncovered and covered atomic steps. (c) Lateral force line profile of the forward and reverse scan directions, highlighting the difference in the forces measured for uncovered and covered steps. The data presented in this figure were acquired with tip A.
Figure 4
Figure 4
(a) Topographic and (b) lateral force maps acquired in the forward scan direction on uncovered and covered steps of an HOPG surface from the CR experiment. The simultaneously recorded (c) amplitude and (d) phase maps (modulation frequency of 82 kHz) show contrast only from the uncovered steps. The data presented in this figure were acquired with tip B.
Figure 5
Figure 5
Line profile of (a) amplitude and (b) phase at uncovered steps acquired with the CR-mode at a contact resonance of 82 kHz. The data presented in this figure were acquired with tip B.
Figure 6
Figure 6
(a) AFM topographic map of a third area of the HOPG surface containing both uncovered and covered steps acquired with FMM. (b) Corresponding amplitude map (1.5 kHz modulation frequency) measured on the surface. Calculated (c) contact stiffness and (d) elastic modulus maps of the surface. The data presented in this figure were acquired with tip C.
Figure 7
Figure 7
(a) Amplitude map obtained while the tip traversed four single-height, uncovered atomic steps on an HOPG surface in CR (modulation frequency = 78 kHz). (b) Amplitude line profiles acquired along the black dashed line in (a). The normal force was increased from 0 nN (red), 9 nN (blue), 18 nN (yellow), and 27 nN (green) while recording the amplitude variation. Each line profile has been offset by a value of 4 Ångström to make identification of the amplitude variation over the uncovered step clear. The data presented in this figure were acquired with tip D.
Figure 8
Figure 8
(a) Amplitude map obtained while the tip traversed two single-height uncovered atomic steps on an HOPG surface in FMM (modulation frequency = 1.5 kHz). (b) Amplitude line profiles acquired along the black dashed line in (a). The normal force was increased from 0 nN (red), 5 nN (blue), 10 nN (yellow), and 15 nN (green) while recording the amplitude variation of the cantilever. Each line profile has been offset by a value of 1 Ångström to make identification of the amplitude variation over the uncovered step clear. The data presented in this figure were acquired with tip C.
Figure 9
Figure 9
(a) Schematic of the physical construction of the cantilever. A piezo actuator (blue rectangle) excites the cantilever/tip assembly that is in contact with a sample (yellow rectangle). (b) A Kelvin–Voigt model representing the tip–sample contact in dynamic AFM mode.
Figure 10
Figure 10
(a) AFM topography image, (b) amplitude, (c) corresponding converted contact stiffness and (d) corresponding converted elastic modulus of the HOPG surface. This series of images was recorded with tip A and with CR ARM (modulation frequency = 77 kHz.)
Figure 11
Figure 11
Force–distance curve from the static indentation measurement on an HOPG surface using a cantilever with a stiffness of 39 N/m. The force versus displacement (black curve) was fit with a Hertzian contact (red curve) to extract the elastic modulus. The radius of the tip apex that made contact with the surface was 11 nm.
Figure 12
Figure 12
The elastic modulus map according to the grid pattern in four lines, where each line includes 64 rows of static indentation over the HOPG surface.

Similar articles

Cited by

References

    1. Miller R E, Shenoy V B. Nanotechnology. 2000;11:139–147. doi: 10.1088/0957-4484/11/3/301. - DOI
    1. Luan B, Robbins M O. Nature. 2005;435:929–932. doi: 10.1038/nature03700. - DOI - PubMed
    1. Mo Y, Turner K T, Szlufarska I. Nature. 2009;457(7233):1116–1119. doi: 10.1038/nature07748. - DOI - PubMed
    1. Szczech J R, Higgins J M, Jin S. J Mater Chem. 2011;21:4037–4055. doi: 10.1039/c0jm02755c. - DOI
    1. Paul D R, Robeson L M. Polymer. 2008;49(15):3187–3204. doi: 10.1016/j.polymer.2008.04.017. - DOI

LinkOut - more resources