

Highly ordered mesoporous silica film nanocomposites containing gold nanoparticles for the catalytic reduction of 4-nitrophenol
- PMID: 31355105
- PMCID: PMC6633902
- DOI: 10.3762/bjnano.10.135
Highly ordered mesoporous silica film nanocomposites containing gold nanoparticles for the catalytic reduction of 4-nitrophenol
Abstract
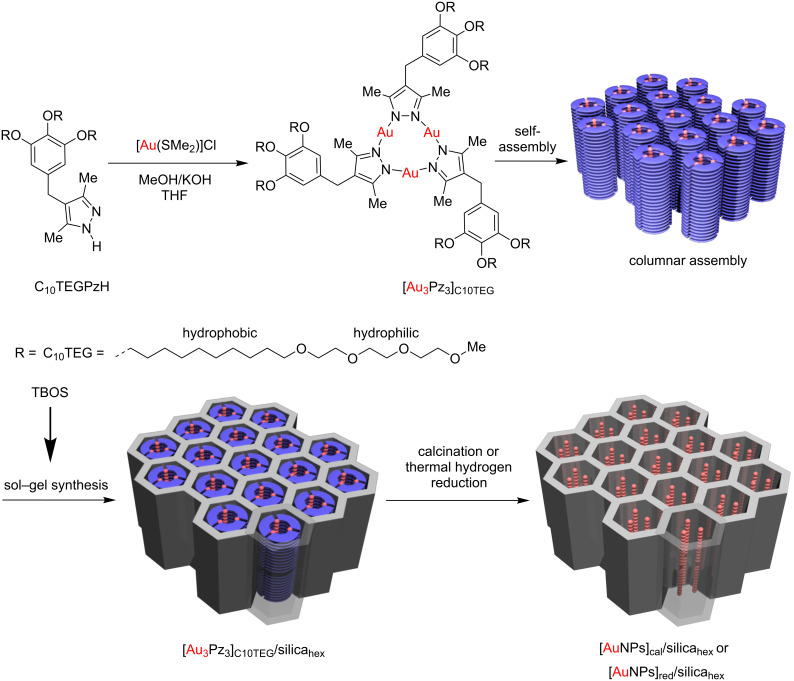
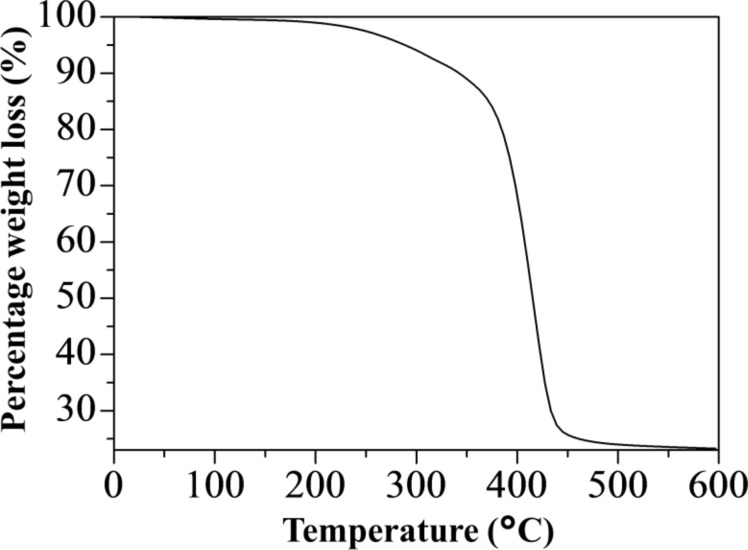
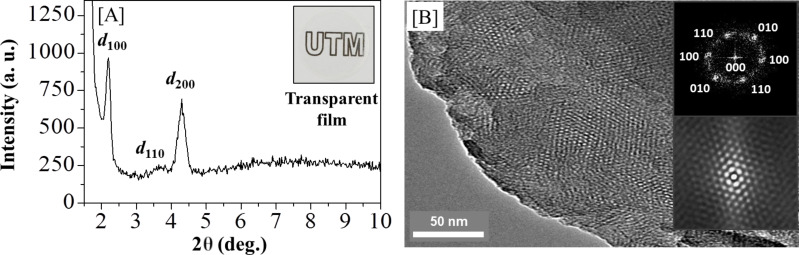
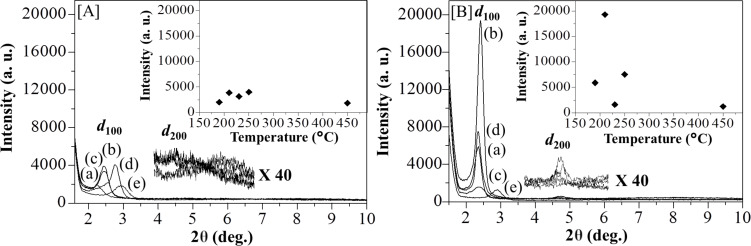
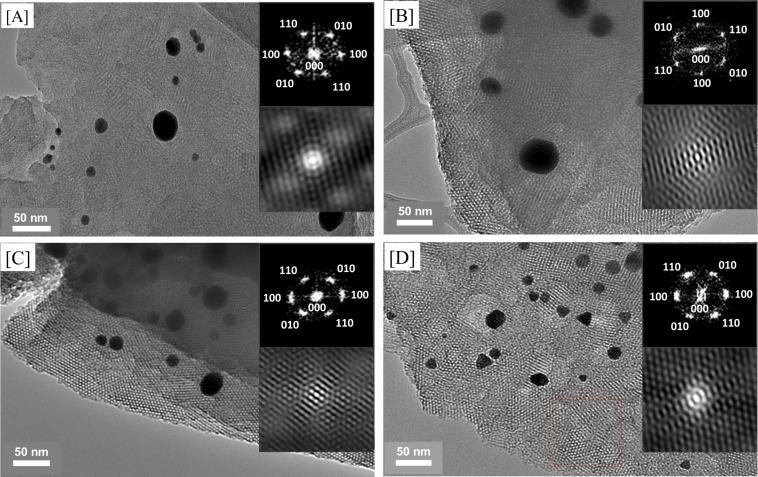
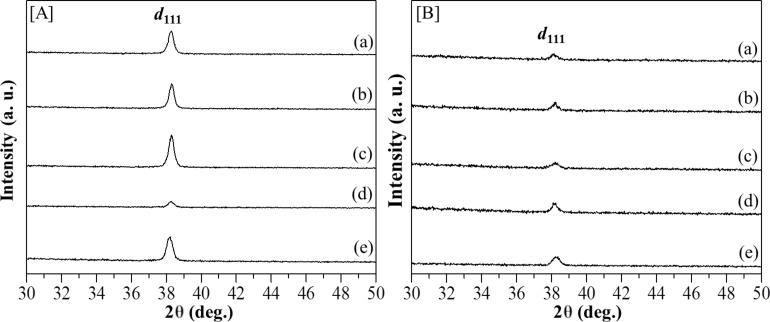
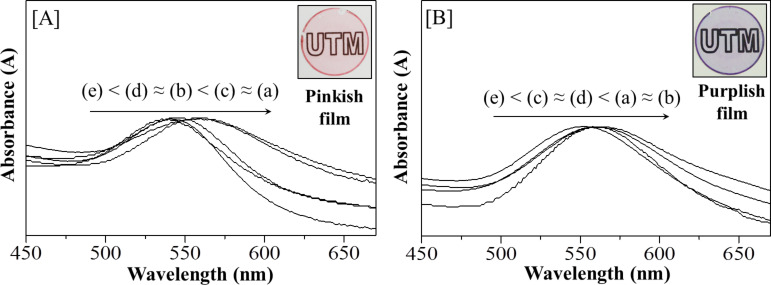
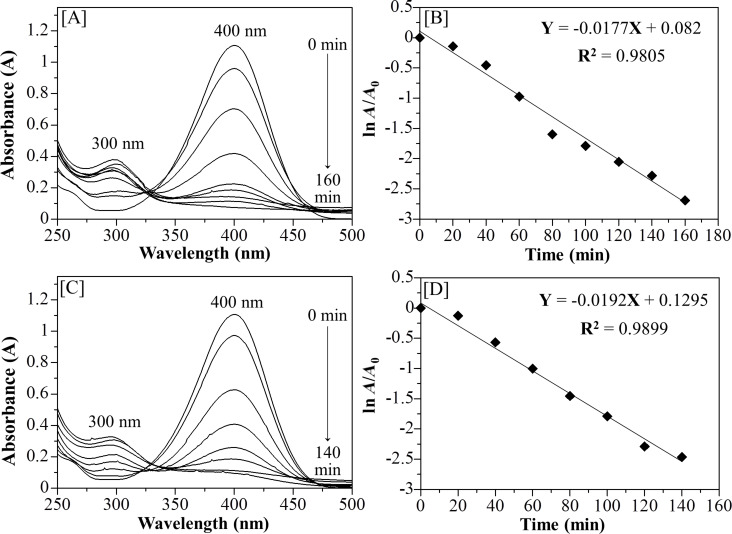
We report that transparent mesostructured silica/gold nanocomposite materials with an interpore distance of 4.1 nm, as-synthesized from a templated sol-gel synthesis method using discotic trinuclear gold(I) pyrazolate complex, were successfully utilized for the fabrication of thin film mesoporous silica nanocomposites containing gold nanoparticles. The material exhibited a highly ordered hexagonal structure when subjected to a thermal hydrogen reduction treatment at 210 °C. In contrast, when the material was subjected to calcination as a heat treatment from 190 to 450 °C, the thin film nanocomposites showed an intense d 100 X-ray diffraction peak. Moreover, gold nanoparticles inside the thin film nanocomposites were confirmed by the presence of the d 111 diffraction peak at 2θ = 38.2°, a surface plasmon resonance peak between 500-580 nm, and the spherical shape observed in the transmission electron microscope images, as well as the visual change in color from pink to purple. Interestingly, by simply dipping the material into a reaction solution of 4-nitrophenol at room temperature, the highly ordered structure of the as-fabricated silica/gold nanoparticle thin film composite after thermal hydrogen reduction at 210 °C resulted in an improved catalytic activity for the reduction of 4-nitrophenol to 4-aminophenol compared to the material calcined at 250 °C. Such catalytic activity is due to the presence of gold nanoparticles of smaller size in the silicate channels of the highly ordered mesoporous film nanocomposites.
Keywords: 4-nitrophenol reduction; catalyst; gold nanoparticle; mesoporous silica; nanocomposite; thermal hydrogen reduction.
Figures

Similar articles
-
Synthesis of ordered mesoporous La2O3-ZrO2 composites with encapsulated Pt NPs and the effect of La-dopping on catalytic activity.J Colloid Interface Sci. 2017 Oct 1;503:178-185. doi: 10.1016/j.jcis.2017.05.023. Epub 2017 May 10. J Colloid Interface Sci. 2017. PMID: 28521220
-
Gold Incorporated Mesoporous Silica Thin Film Model Surface as a Robust SERS and Catalytically Active Substrate.Molecules. 2016 May 20;21(5):667. doi: 10.3390/molecules21050667. Molecules. 2016. PMID: 27213321 Free PMC article.
-
A general route to hollow mesoporous rare-earth silicate nanospheres as a catalyst support.Chemistry. 2014 Feb 17;20(8):2344-51. doi: 10.1002/chem.201303752. Epub 2014 Jan 21. Chemistry. 2014. PMID: 24449457
-
A general protocol for precise syntheses of ordered mesoporous intermetallic nanoparticles.Nat Protoc. 2023 Oct;18(10):3126-3154. doi: 10.1038/s41596-023-00872-1. Epub 2023 Sep 14. Nat Protoc. 2023. PMID: 37710021 Review.
-
Synthesis of Polymer-Mesoporous Silica Nanocomposites.Materials (Basel). 2010 Jul 13;3(7):4066-4079. doi: 10.3390/ma3074066. Materials (Basel). 2010. PMID: 28883321 Free PMC article. Review.
Cited by
-
Factors associated with uptake of human papilloma virus vaccine among adolescent girls: A cross sectional survey on insights into HPV Infection Prevention in Kabarole District, Western Uganda.PLoS One. 2025 Mar 10;20(3):e0306960. doi: 10.1371/journal.pone.0306960. eCollection 2025. PLoS One. 2025. PMID: 40063659 Free PMC article.
-
Direct synthesis of Fe-aluminosilicates from red mud for catalytic deoxygenation of waste cooking oil.RSC Adv. 2023 Oct 31;13(45):31989-31999. doi: 10.1039/d3ra05910c. eCollection 2023 Oct 26. RSC Adv. 2023. PMID: 37915446 Free PMC article.
-
Novel mesoporous silica nanocarriers containing gold; a rapid diagnostic tool for tuberculosis.BMC Complement Med Ther. 2021 Nov 5;21(1):277. doi: 10.1186/s12906-021-03451-7. BMC Complement Med Ther. 2021. PMID: 34740364 Free PMC article.
References
-
- Saptiama I, Kaneti Y V, Oveisi H, Suzuki Y, Tsuchiya K, Takai K, Sakae T, Pradhan S, Hossain M S A, Fukumitsu N, et al. Bull Chem Soc Jpn. 2018;91(2):195–200. doi: 10.1246/bcsj.20170295. - DOI
-
- Saptiama I, Kaneti Y V, Suzuki Y, Suzuki Y, Tsuchiya K, Sakae T, Takai K, Fukumitsu N, Alothman Z A, Hossain M S A, et al. Bull Chem Soc Jpn. 2017;90(10):1174–1179. doi: 10.1246/bcsj.20170184. - DOI
LinkOut - more resources
Full Text Sources