. 2019 Jul 24;5(7):eaaw2238.
doi: 10.1126/sciadv.aaw2238. eCollection 2019 Jul.

Clockophagy is a novel selective autophagy process favoring ferroptosis

Affiliations

Clockophagy is a novel selective autophagy process favoring ferroptosis

Minghua Yang et al. Sci Adv. .

Abstract

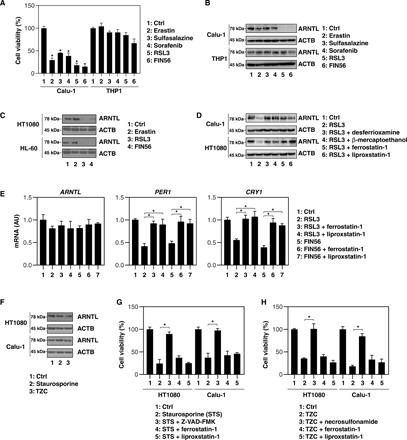
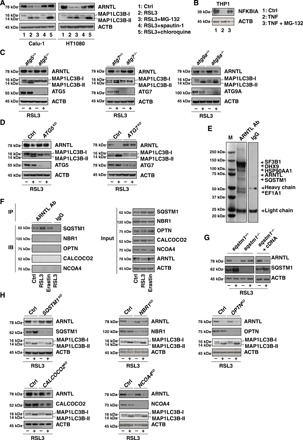
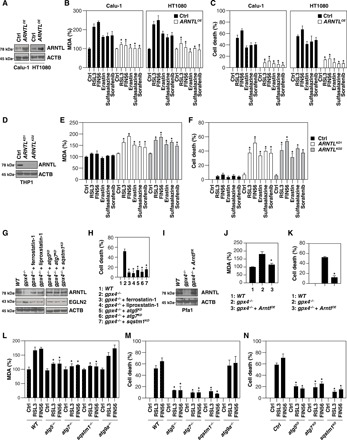
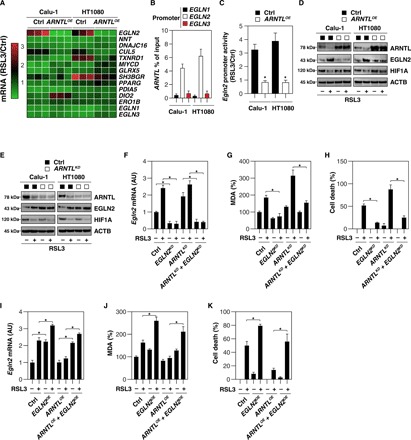
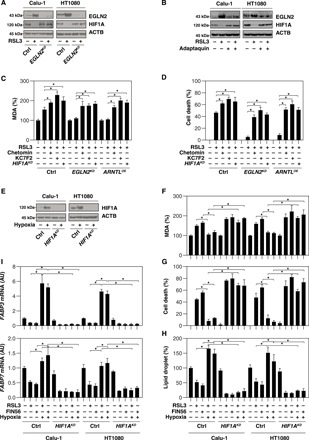
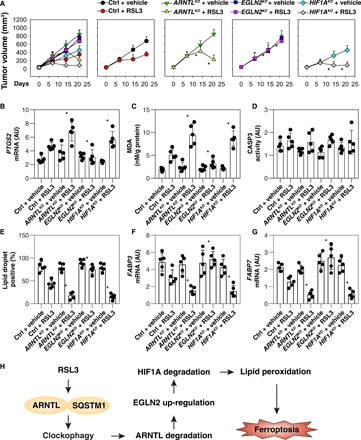
Ferroptosis is a form of nonapoptotic regulated cell death driven by iron-dependent lipid peroxidation. Autophagy involves a lysosomal degradation pathway that can either promote or impede cell death. A high level of autophagy has been associated with ferroptosis, but the mechanisms underpinning this relationship are largely elusive. We characterize the contribution of autophagy to ferroptosis in human cancer cell lines and mouse tumor models. We show that "clockophagy," the selective degradation of the core circadian clock protein ARNTL by autophagy, is critical for ferroptosis. We identify SQSTM1 as a cargo receptor responsible for autophagic ARNTL degradation. ARNTL inhibits ferroptosis by repressing the transcription of Egln2, thus activating the prosurvival transcription factor HIF1A. Genetic or pharmacological interventions blocking ARNTL degradation or inhibiting EGLN2 activation diminished, whereas destabilizing HIF1A facilitated, ferroptotic tumor cell death. Thus, our findings reveal a new pathway, initiated by the autophagic removal of ARNTL, that facilitates ferroptosis induction.


Figures

Fig. 1
Fig. 1. Selective degradation of ARNTL in ferroptosis.
(A) Cell viability of Calu-1 and THP1 cells following treatment with erastin (10 μM), sulfasalazine (500 μM), sorafenib (10 μM), RSL3 (0.5 μM), or FIN56 (5 μM) for 12 hours (n = 3, *P < 0.05 versus control group). (B) In parallel, Western blot analyses were conducted to assess the expression of the indicated proteins in Calu-1 and THP1 cells. (C) Immunoblot analysis of the indicated proteins in HT1080 and HL-60 cells following treatment with erastin (10 μM), RSL3 (0.5 μM), or FIN56 (5 μM) for 12 hours. (D) Western blot analysis of the indicated proteins in HT1080 and Calu-1 cells following treatment with RSL3 (0.5 μM) for 12 hours in the absence or presence of desferrioxamine (10 μM), β-mercaptoethanol (5 μM), ferrostatin-1 (0.5 μM), or liproxstatin-1 (0.5 μM). (E) Quantitative polymerase chain reaction (qPCR) analysis of the indicated mRNAs in HT1080 cells following treatment with RSL3 (0.5 μM) or FIN56 (5 μM) for 12 hours in the absence or presence of ferrostatin-1 (0.5 μM) or liproxstatin-1 (0.5 μM) (n = 3, *P < 0.05). (F) Western blot analysis of the indicated proteins in HT1080 and Calu-1 cells following treatment with staurosporine (1 μM) or TZC [TNF (50 nM), ZVAD-FMK (20 μM), and cycloheximide (10 μg/ml)] for 12 hours. (G) Viability of HT1080 cells following treatment with staurosporine (1 μM) for 12 hours in the absence or presence of Z-VAD-FMK (20 μM), ferrostatin-1 (0.5 μM), or liproxstatin-1 (0.5 μM) (n = 3, *P < 0.05). (H) Viability of HT1080 cells after treatment with TZC [TNF (50 nM), ZVAD-FMK (20 μM), and cycloheximide (10 μg/ml)] for 12 hours in the absence or presence of necrosulfonamide (1 μM), ferrostatin-1 (0.5 μM), or liproxstatin-1 (0.5 μM) (n = 3, *P < 0.05). AU, arbitrary units.
Fig. 2
Fig. 2. Contribution of SQSTM1 to the autophagic degradation of ARNTL.
(A) Western blot analysis of the indicated proteins in HT1080 and Calu-1 cells following treatment with RSL3 (0.5 μM) in the absence or presence of MG-132 (2.5 μM), spautin-1 (5 μM), or chloroquine (50 μM) for 12 hours. (B) Western blot analysis of the indicated proteins in THP1 cells after treatment with TNF (10 ng/ml) in the absence or presence of MG-132 (2.5 μM) for 1 hour. (C) Western blot analysis of the indicated proteins in wild-type, atg5−/−, atg7−/−, and atg9a−/− mouse embryonic fibroblasts (MEFs) after treatment with RSL3 (0.5 μM) for 12 hours. (D) Western blot analysis of the indicated protein expression in control, ATG5 knockdown (ATG5KD), and ATG7 knockdown (ATG7KD) HT1080 cells following treatment with RSL3 (0.5 μM) for 12 hours. (E) Mass spectrometry analysis identified SQSTM1 as a direct binding protein of ARNTL in HT1080 cells. These are gels of the proteins that bind to ARNTL, stained with Coomassie Brilliant Blue. Ab, antibody; IgG, immunoglobulin G. (F) Immunoprecipitation (IP) analysis of ARNTL-binding proteins in HT1080 cells following treatment with erastin (10 μM) or RSL3 (0.5 μM) for 6 hours. IB, immunoblot. (G) Western blot analysis of the indicated proteins in wild-type cells, sqstm1−/− MEFs, or sqstm1−/− cells transfected with Sqstm1 complementary DNA (cDNA) (sqstm1−/− + cDNA) following treatment with RSL3 (0.5 μM) for 12 hours. (H) Western blot analysis of the indicated proteins in control and the indicated gene knockdown HT1080 cells following treatment with RSL3 (0.5 μM) for 12 hours. ACTB, actin beta.
Fig. 3
Fig. 3. Autophagy-mediated ARNTL degradation promotes ferroptosis.
(A) Western blot analysis of the indicated proteins in control and ARNTL-overexpressing (ARNTLOE) HT1080 and Calu-1 cells. (B and C) Analysis of MDA levels (B) and cell death (C) in control and ARNTL-overexpressing (ARNTLOE) HT1080 and Calu-1 cells following treatment with erastin (10 μM), sulfasalazine (500 μM), sorafenib (10 μM), RSL3 (0.5 μM), or FIN56 (5 μM) for 12 hours (n = 3, *P < 0.05 versus control group). (D) Western blot analysis of the indicated proteins in control and ARNTL knockdown (ARNTLKD) THP1 cells. (E and F) Analysis of MDA levels (E) and cell death (F) in control and ARNTL knockdown (ARNTLKD) THP1 cells following treatment with erastin (10 μM), sulfasalazine (500 μM), sorafenib (10 μM), RSL3 (0.5 μM), or FIN56 (5 μM) for 12 hours (n = 3, *P < 0.05 versus control group). (G) Western blot analysis of the indicated proteins in gpx4−/− Pfa1 cells cultured in the absence or presence of ferroptosis inhibitors [e.g., ferrostatin-1 (0.5 μM, 24 hours) and liproxstatin-1 (0.5 μM, 24 hours)] or the knockdown of Atg5, Atg7, or Sqstm1. (H) Cell death in the setting of (G) (n = 3, *P < 0.05 versus single gpx4−/− group). (I) Western blot analysis of the indicated proteins in gpx4−/− Pfa1 cells with or without ARNTL overexpression. (J and K) MDA levels (J) and cell death (K) in the setting of (I) (n = 3, *P < 0.05 versus single gpx4−/− group). (L and M) MDA levels (L) and cell death (M) in MEFs with the indicated genotypes following treatment with RSL3 (0.5 μM) or FIN56 (5 μM) for 12 hours [n = 3, *P < 0.05 versus control wild-type (WT) group]. (N) Cell death in a panel of gene knockdown HT1080 cells following treatment with RSL3 (0.5 μM) or FIN56 (5 μM) for 12 hours (n = 3, *P < 0.05 versus control group).
Fig. 4
Fig. 4. ARNTL-mediated EGLN2 down-regulation blocks ferroptosis.
(A) Heat map of mRNA expression levels in control or ARNTL-overexpressing (ARNTLOE) HT1080 and Calu-1 cells following treatment with RSL3 (0.5 μM) for 12 hours. (B) Binding of ARNTL to EGLN1, EGLN2, or EGLN3 promoter was analyzed by ChIP-qPCR in HT1080 or Calu-1 cells (n = 3). (C) EGLN2 promoter activity in control or ARNTL-overexpressing (ARNTLOE) HT1080 and Calu-1 cells after treatment with RSL3 (0.5 μM) for 12 hours (n = 3, *P < 0.05 versus control group). (D) Western blot analysis of the indicated protein expression in control and ARNTL-overexpressing (ARNTLOE) HT1080 and Calu-1 cells upon treatment with RSL3 (0.5 μM) for 12 hours. (E) Western blot analysis of the indicated proteins in control and ARNTL knockdown (ARNTLKD) HT1080 and Calu-1 cells following treatment with RSL3 (0.5 μM) for 12 hours. (F to H) Analysis of EGLN2 mRNA (F), MDA levels (G), and cell death (H) in the indicated gene knockdown HT1080 cells after treatment with RSL3 (0.5 μM) for 12 hours (n = 3, *P < 0.05). (I to K) Analysis of EGLN2 mRNA (I), MDA level (J), and cell death (K) in the indicated gene-overexpressing HT1080 cells following treatment with RSL3 (0.5 μM) for 12 hours (n = 3, *P < 0.05).
Fig. 5
Fig. 5. EGLN2-mediated HIF1A down-regulation promotes ferroptosis.
(A) Western blot analysis of the indicated proteins in control and EGLN2 knockdown (EGLN2KD) HT1080 and Calu-1 cells upon treatment with RSL3 (0.5 μM) for 12 hours. (B) Western blot analysis of the indicated protein expression in HT1080 and Calu-1 cells after treatment with RSL3 (0.5 μM) in the absence or presence of adaptaquin (4 μM) for 12 hours. (C and D) Analysis of MDA level (C) and cell death (D) in the indicated HT1080 cells subsequent to treatment with RSL3 (0.5 μM) in the absence or presence of chetomin (0.25 μM) and KC7F2 (25 μM) for 12 hours (n = 3, *P < 0.05). (E) Western blot analysis of the indicated proteins in control and HIF1A knockdown (HIF1AKD) HT1080 and Calu-1 cells following treatment with hypoxia (1% O2) for 24 hours. (F to I) Analysis of MDA level (F), cell death (G), lipid droplet (H), and gene mRNA (I) in the indicated hypoxia (1% O2, 24 hours)–pretreated HT1080 and Calu-1 cells after being cultured with RSL3 (0.5 μM) and FIN56 (5 μM) for 12 hours (n = 3, *P < 0.05).
Fig. 6
Fig. 6. Effects of genetic inhibition of ARNTL, EGLN2, and HIF1A on ferroptosis in vivo.
(A) Athymic nude mice were injected subcutaneously with the indicated HT1080 cells for 7 days and then treated with RSL3 (30 mg/kg; intraperitoneally, once every other day) at day 7 for 2 weeks. Tumor volumes were calculated weekly (n = 5 mice per group, *P < 0.05 versus ctrl + RSL3 group). (B to G) In parallel, PTGS2 mRNA (B), MDA level (C), CASP3 activity (D), lipid droplets (E), FABP3 mRNA (F), and FABP7 mRNA (G) in isolated tumors at day 14 after treatment were assayed (n = 5 mice per group, *P < 0.05 versus ctrl + RSL3 group). (H) Schematic summary of the role of clockophagy in the regulation of lipid peroxidation and ferroptosis.

Comment in

References

    1. Tang D., Kang R., Berghe T. V., Vandenabeele P., Kroemer G., The molecular machinery of regulated cell death. Cell Res. 29, 347–364 (2019). - PMC - PubMed
    1. Dixon S. J., Lemberg K. M., Lamprecht M. R., Skouta R., Zaitsev E. M., Gleason C. E., Patel D. N., Bauer A. J., Cantley A. M., Yang W. S., Morrison B. III, Stockwell B. R., Ferroptosis: An iron-dependent form of nonapoptotic cell death. Cell 149, 1060–1072 (2012). - PMC - PubMed
    1. Yang W. S., SriRamaratnam R., Welsch M. E., Shimada K., Skouta R., Viswanathan V. S., Cheah J. H., Clemons P. A., Shamji A. F., Clish C. B., Brown L. M., Girotti A. W., Cornish V. W., Schreiber S. L., Stockwell B. R., Regulation of ferroptotic cancer cell death by GPX4. Cell 156, 317–331 (2014). - PMC - PubMed
    1. Ran Q., Van Remmen H., Gu M., Qi W., Roberts L. J. II, Prolla T., Richardson A., Embryonic fibroblasts from Gpx4+/− mice: A novel model for studying the role of membrane peroxidation in biological processes. Free Radic. Biol. Med. 35, 1101–1109 (2003). - PubMed
    1. Canli O., Alanku Y. B., Grootjans S., Vegi N., Hultner L., Hoppe P. S., Schroeder T., Vandenabeele P., Bornkamm G. W., Greten F. R., Glutathione peroxidase 4 prevents necroptosis in mouse erythroid precursors. Blood 127, 139–148 (2016). - PMC - PubMed

Publication types

MeSH terms

LinkOut - more resources